Using Software Tracing to Record Network Packets on STM32
This tutorial shows how to use VisualGDB’s Software Tracing feature to analyze the real-time behavior of a simple HTTP server running on the STMF7-Discovery board. We will first trace the DHCP logic, quickly showing which functions are being called, then will modify the tracepoints to record the incoming and outgoing DHCP packets, and will finally show how to use tracing to record the URLs of all pages requested by the HTTP client.
Before you begin, install VisualGDB 6.0 or later.
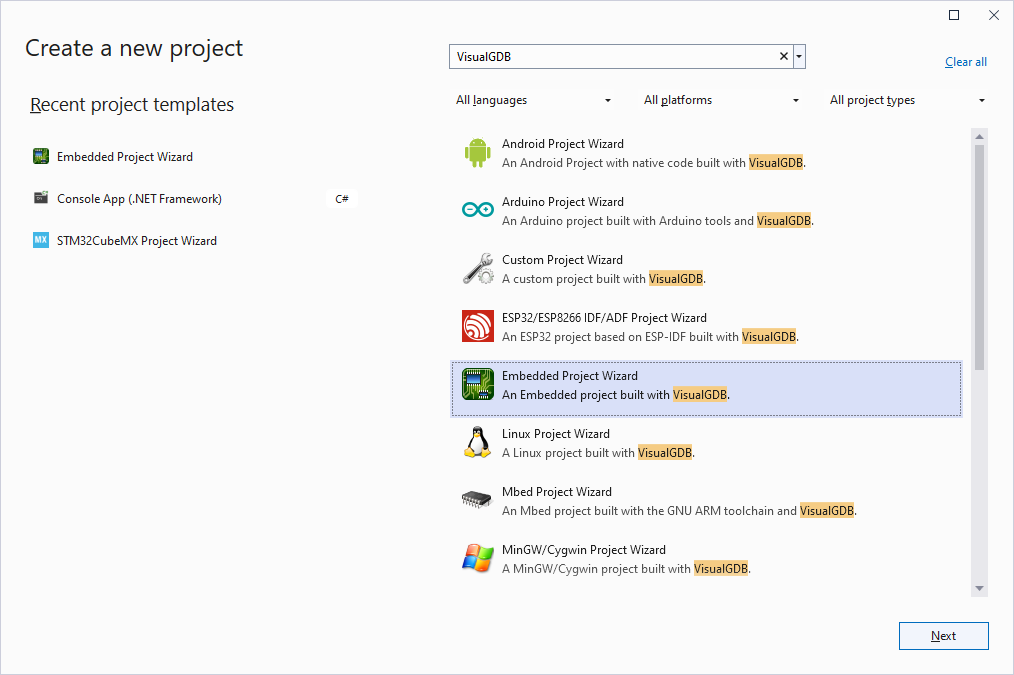
- Start Visual Studio and open the VisualGDB Embedded Project Wizard:
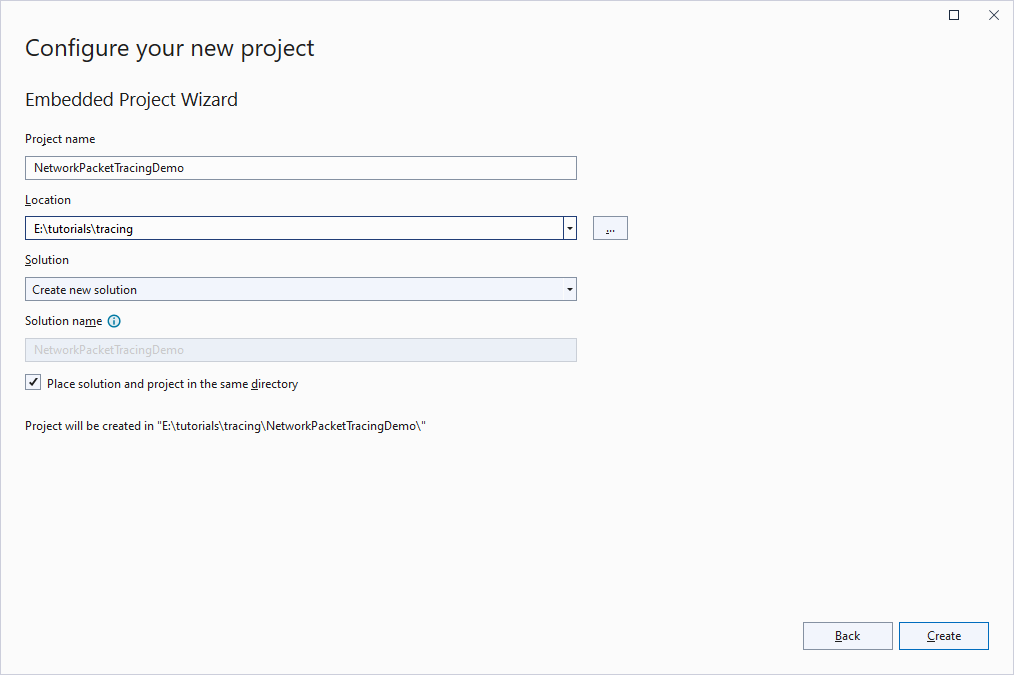
- Enter the name and location of your project:
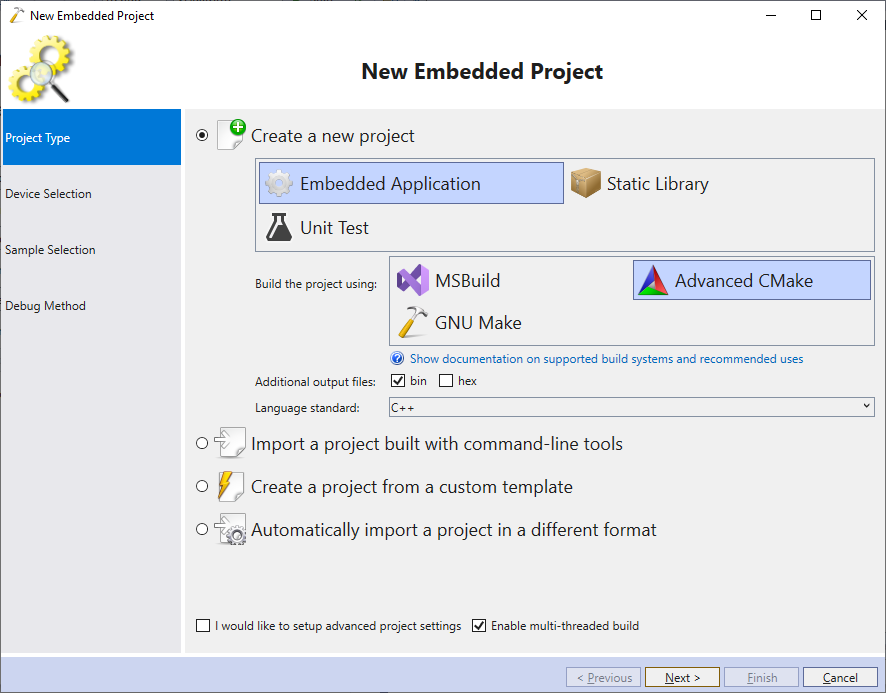
- Select the default options (new embedded application -> Advanced CMake):
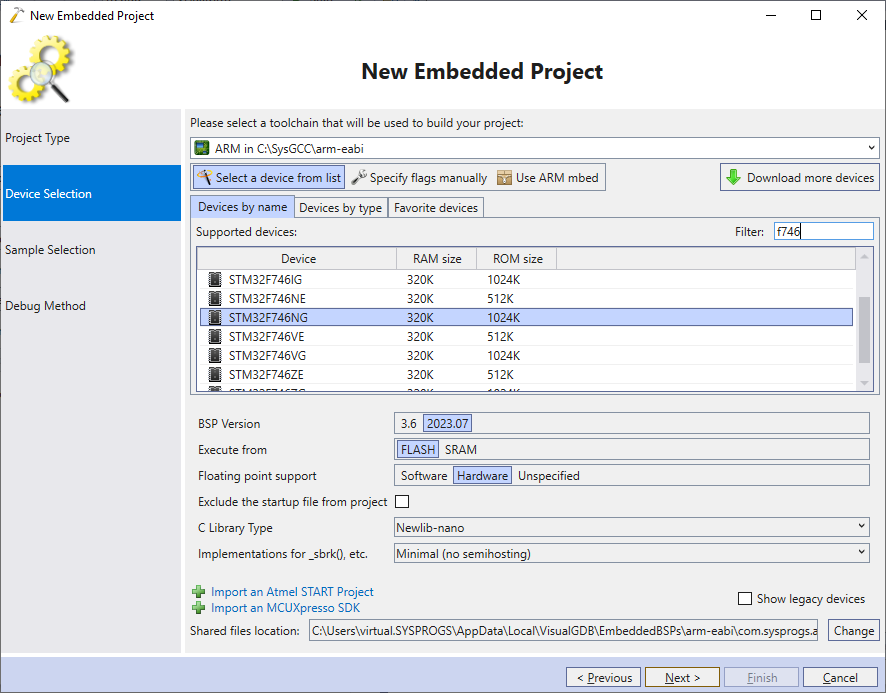
- Select the latest ARM toolchain and pick your device:
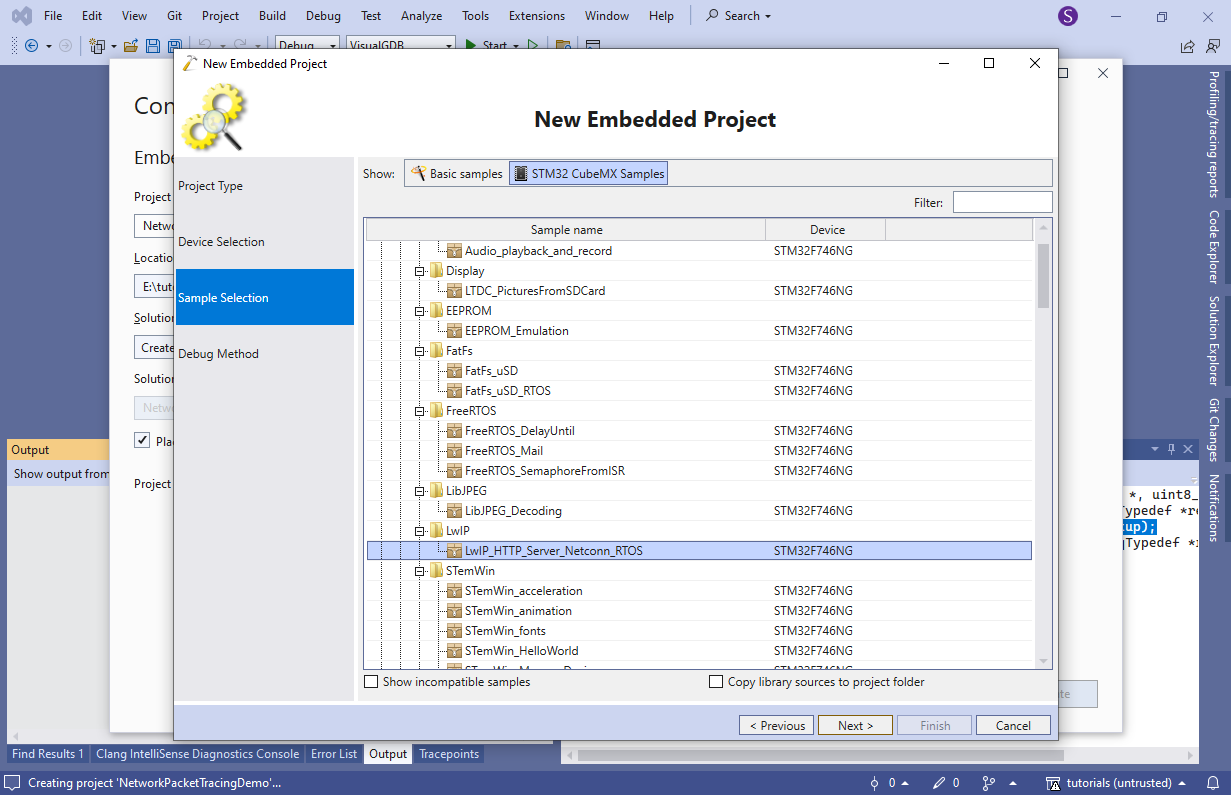
- On the next page pick STM32CubeMX Samples->LwIP->LwIP_HTTP_Server_Netconn_RTOS:
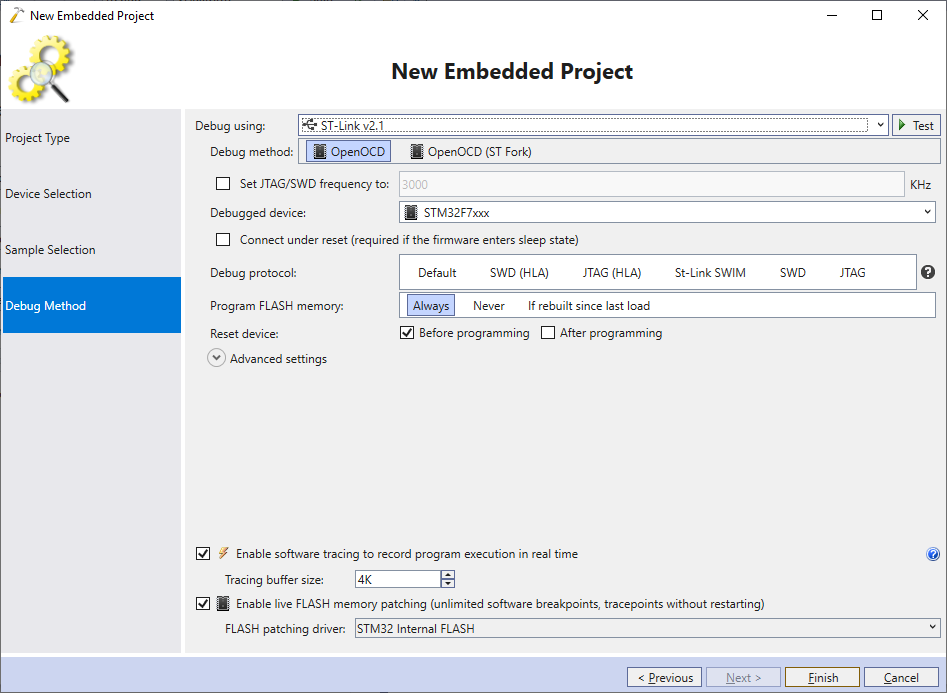
- Finally, configure the debugging settings and click “Finish” to create the project:
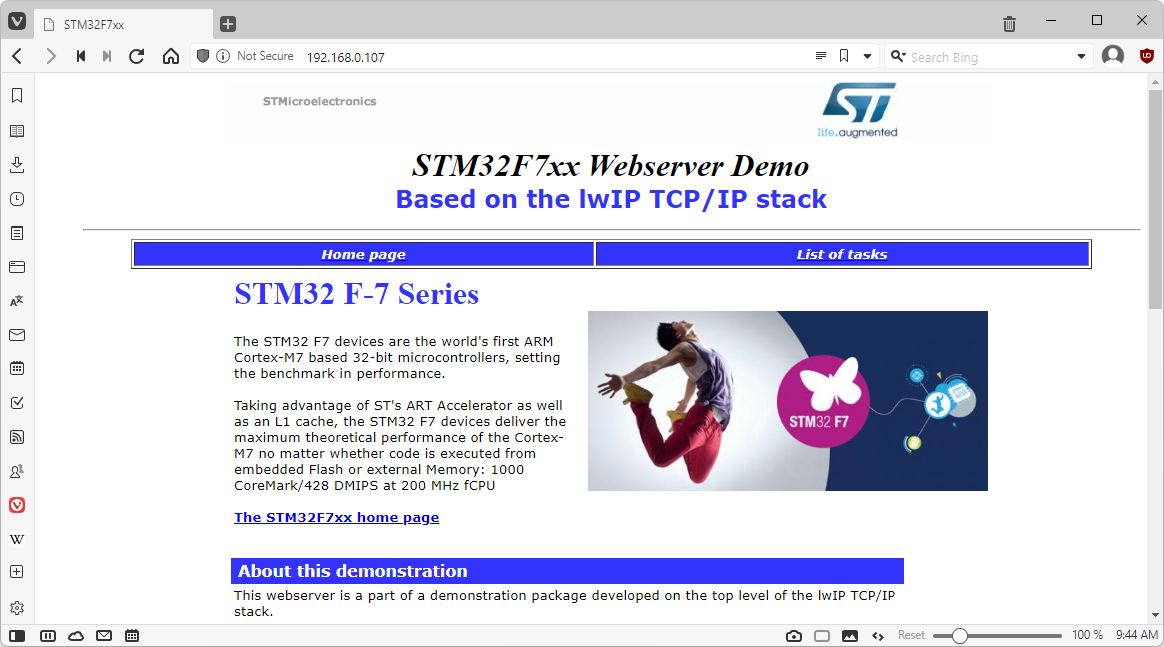
- Press F5 to build the project and start debugging it. Once it obtains an IP address from the DHCP server, try opening it in the browser. If everything goes well, you should see the following page:
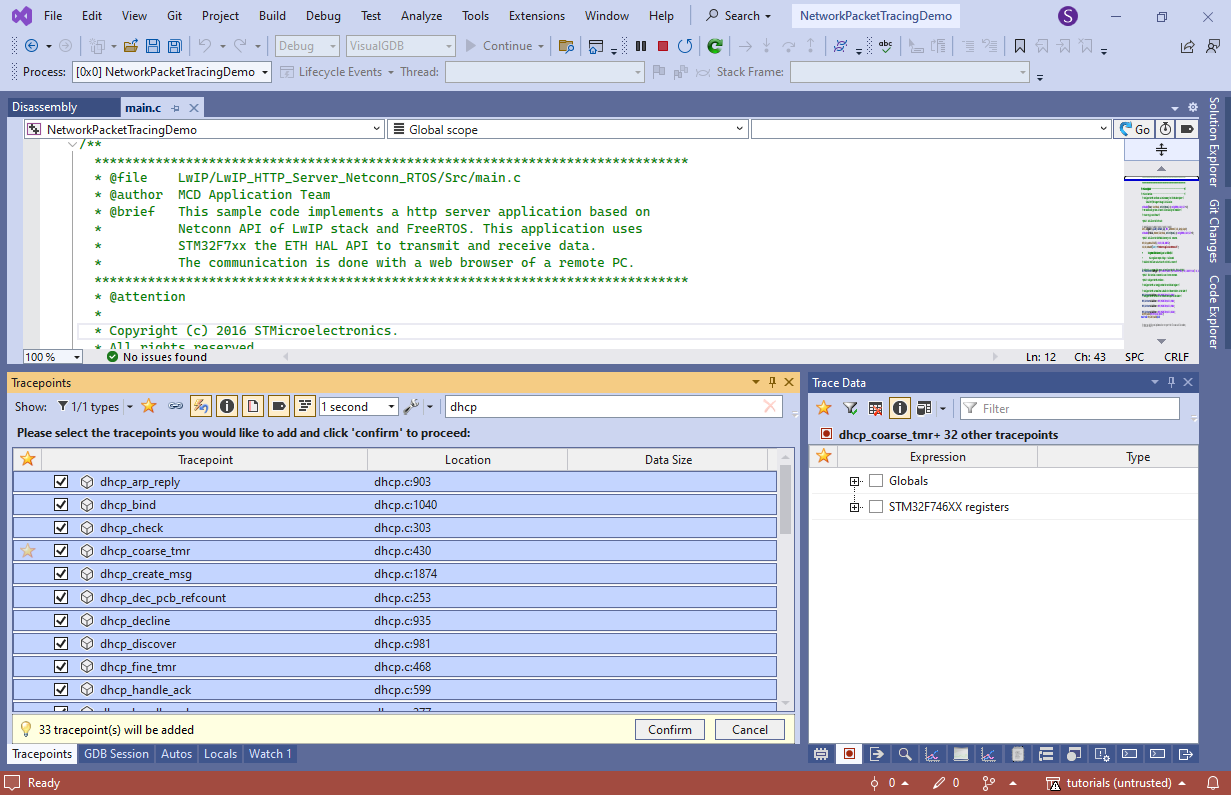
- Now we will show how to use Software Tracing to see what functions are running on the target, and record the details of their execution. Open the Debug->Windows->Tracepoints window, type “dhcp” in the filter, select all functions (Ctrl+A) and press space to trace all of them:
- In order to avoid any memory overhead, VisualGDB didn’t reserve any memory for the trace data before we set the first tracepoint, so you would need to restart the debug session to begin tracing:
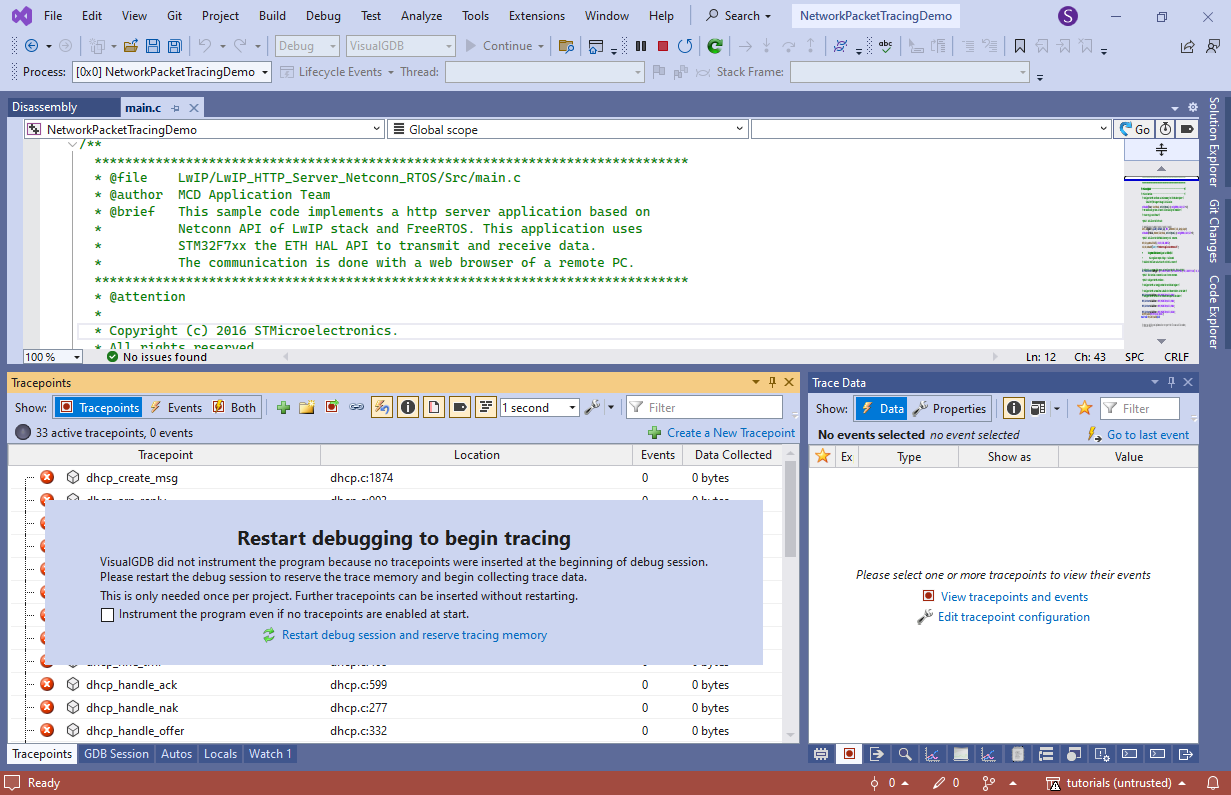 You can configure this behavior (i.e. always reserve tracing memory) via VisualGDB Project Properties -> Software Tracing.
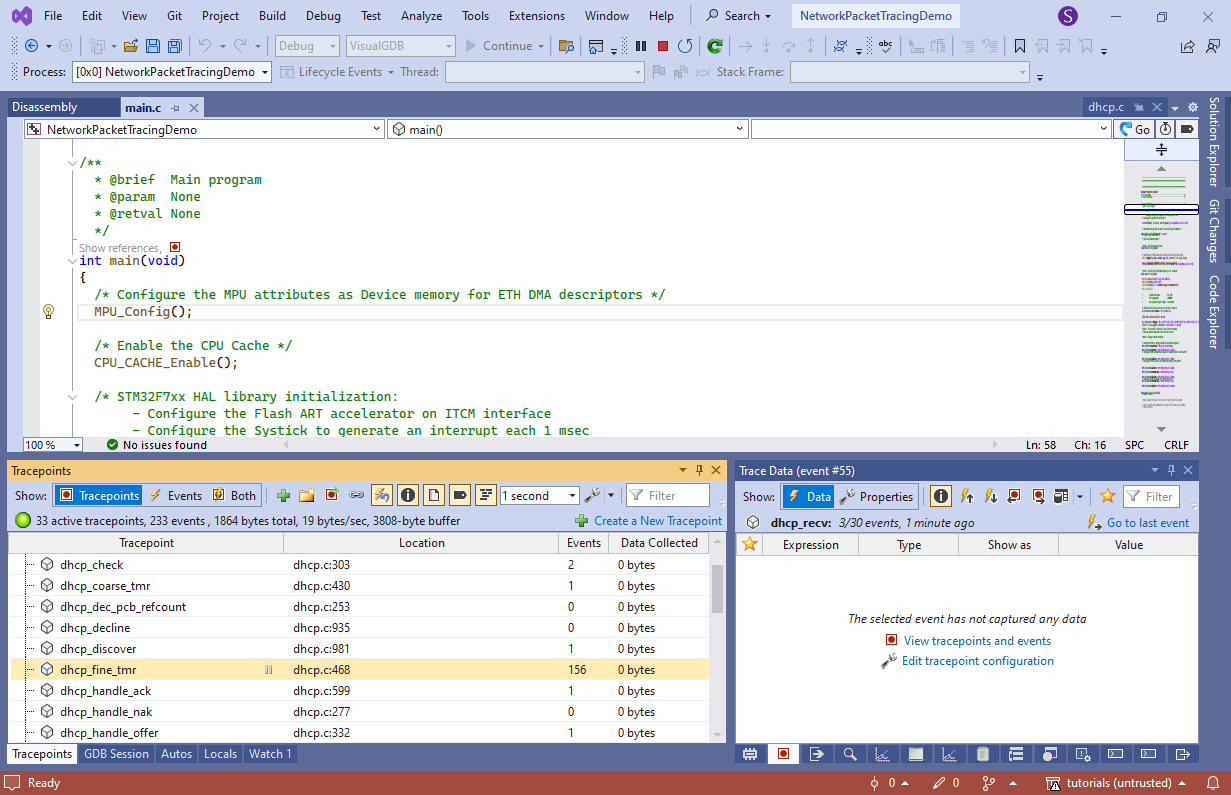
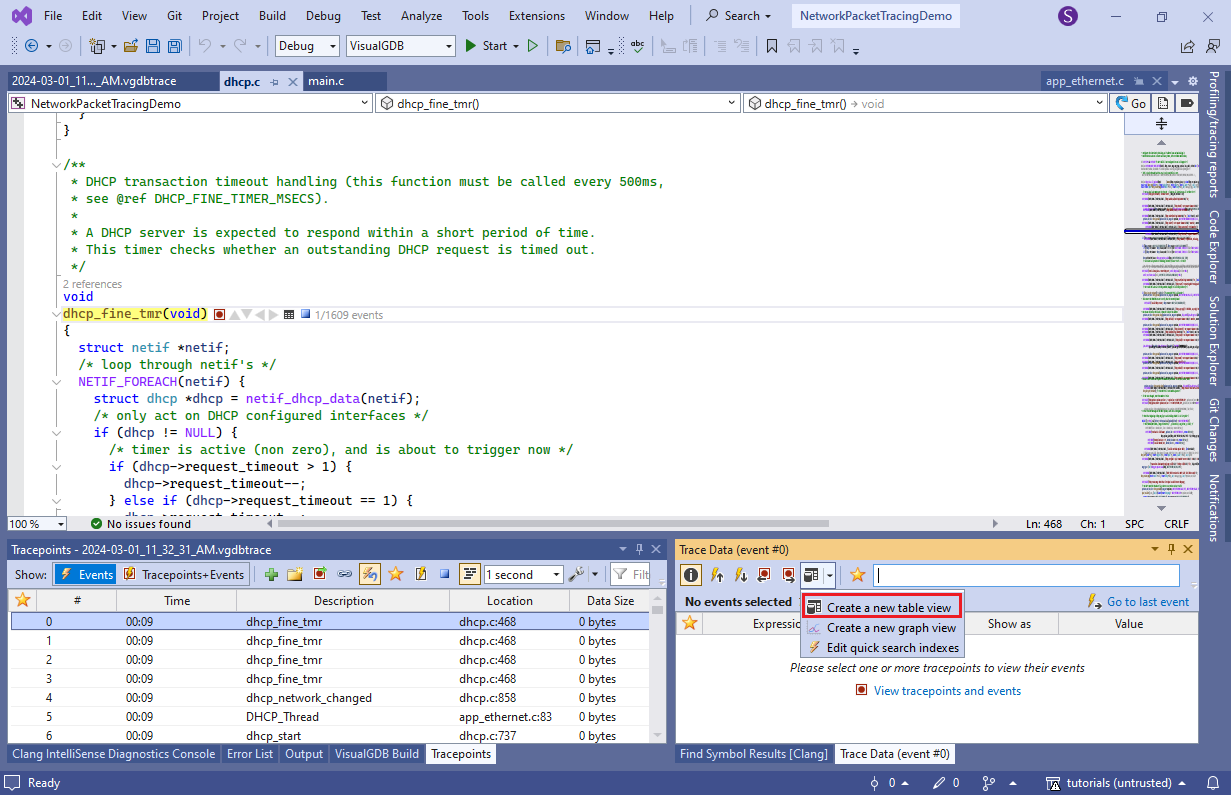
 - Once the debug session is started again, VisualGDB will show that dhcp_fine_tmr() is running all the time, while functions like dhcp_recv() executed a couple of times and stopped:
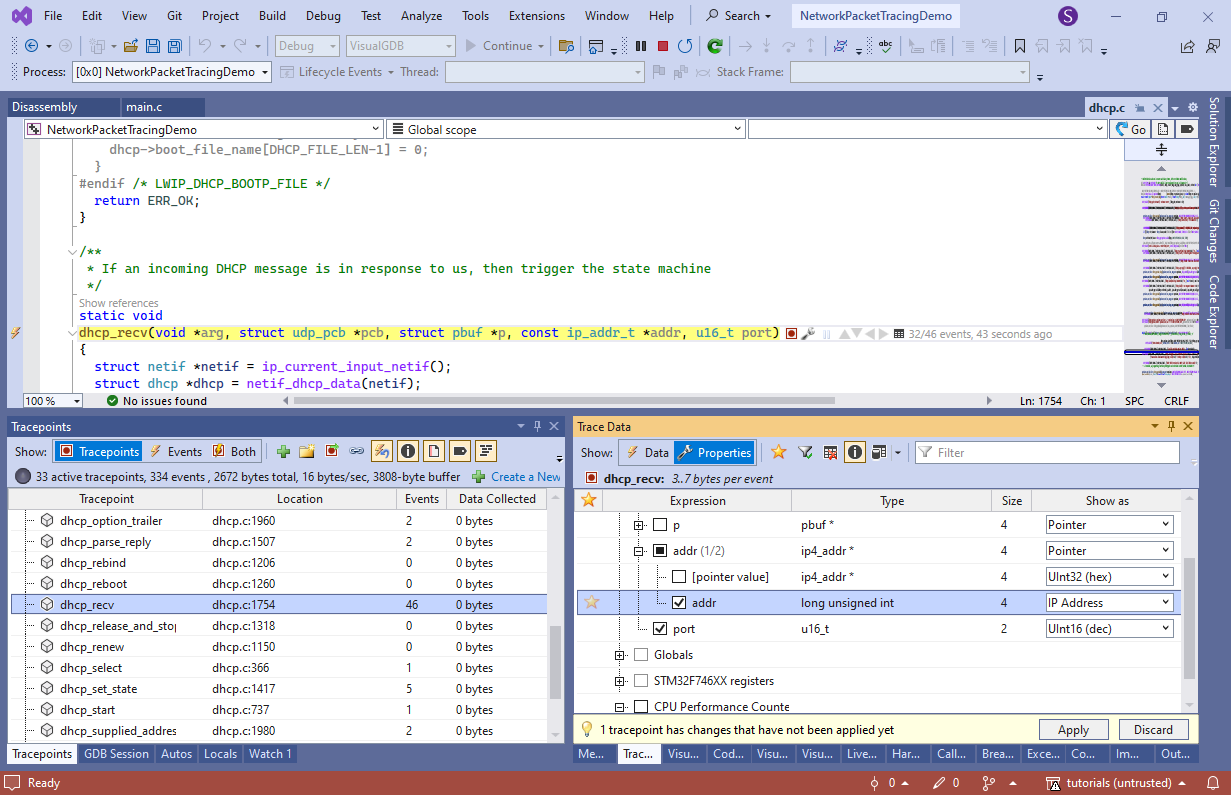
- Select the tracepoint for dhcp_recv() and configure it to record addr->addr as IP Address and port as UInt16:
- Also enable recording of p->payload as a dynamic array of [p->len] elements:
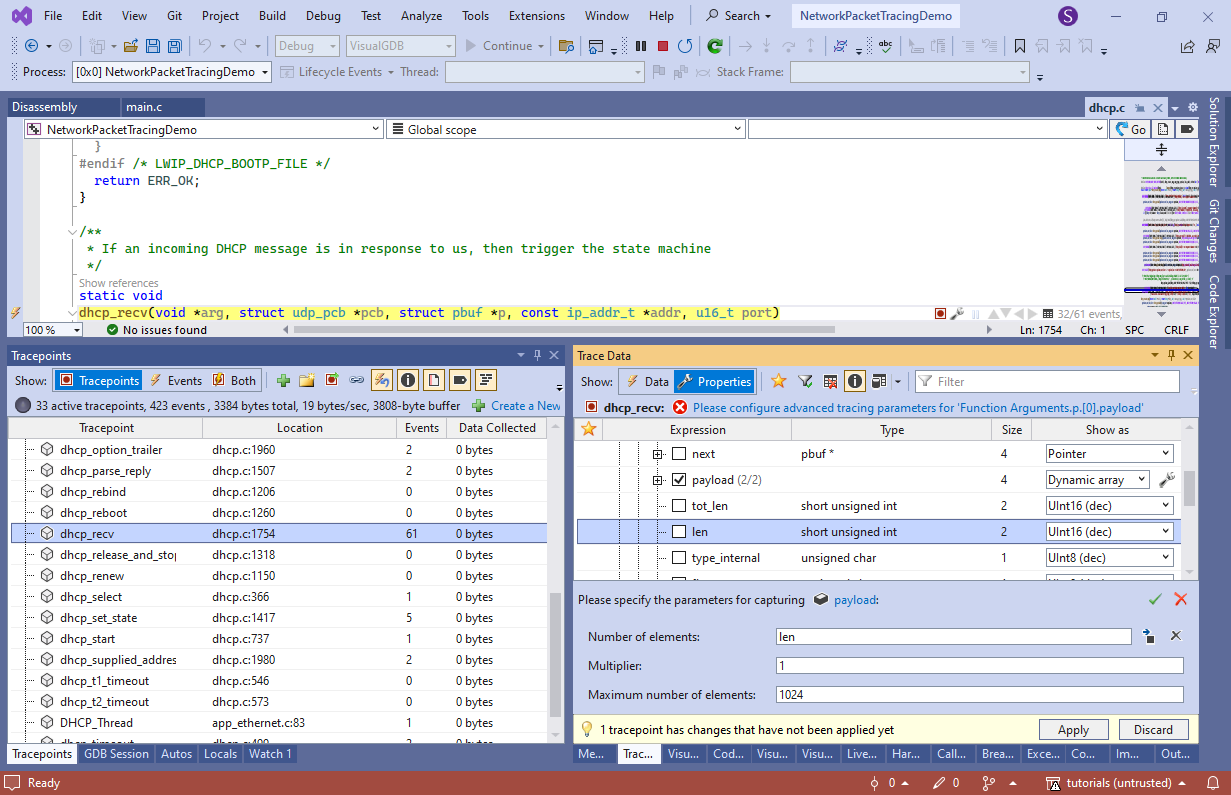
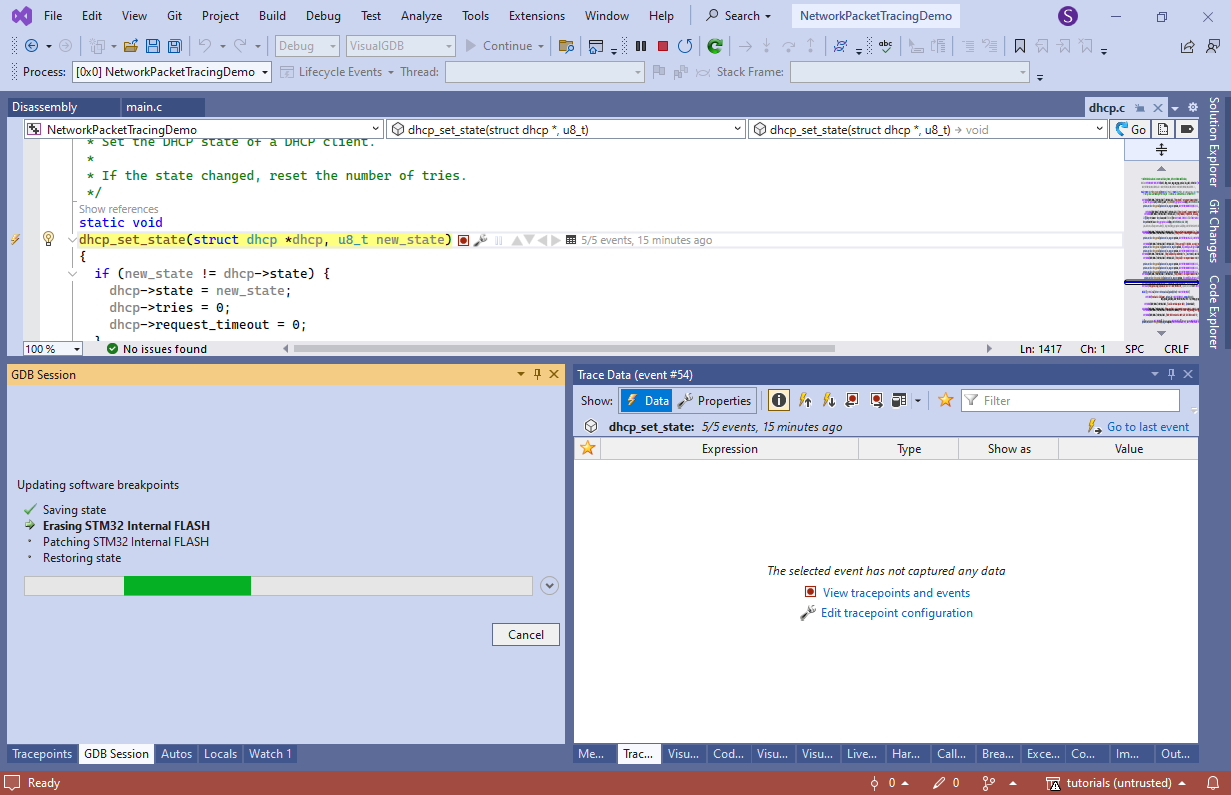
- Click Apply and VisualGDB will automatically patch the trace program in the FLASH memory:
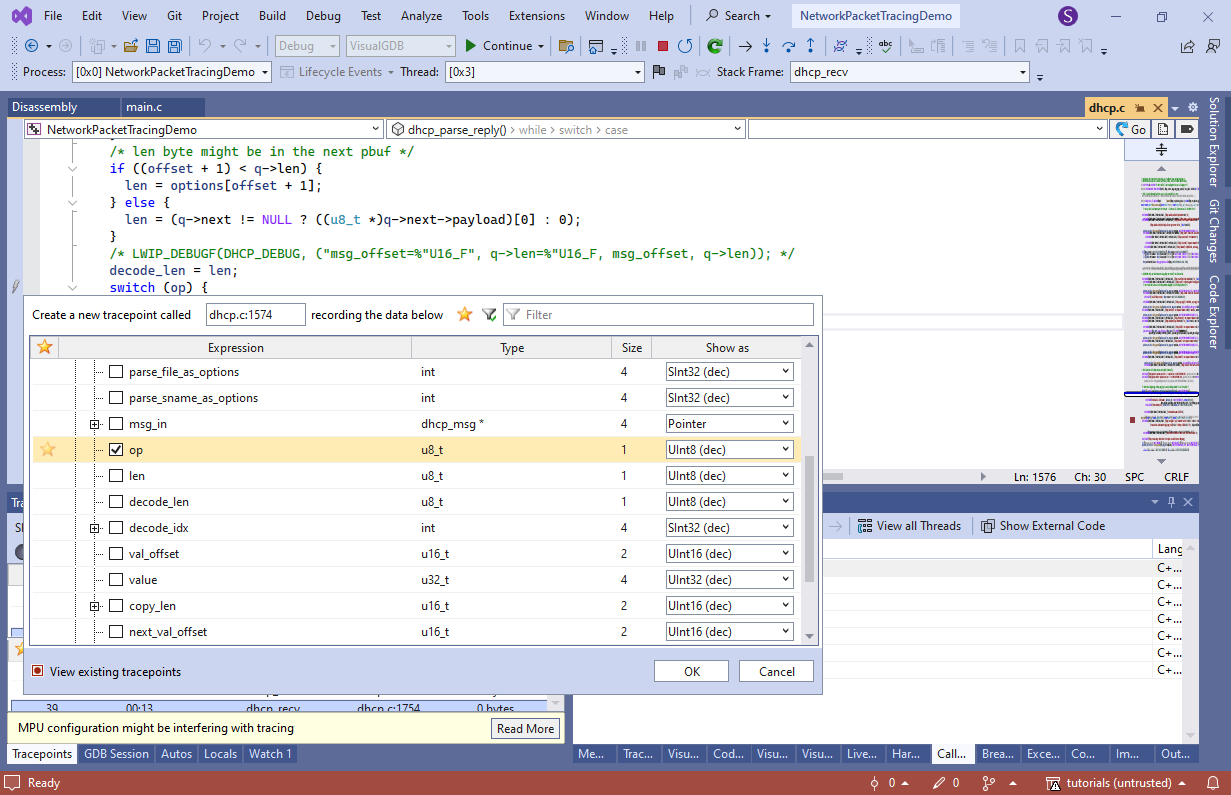
- We can also record the specific DHCP options contained in the packets. It will be redundant since we are already recording entire packets, but will allow seeing what is going on quicker. Set a tracepoint in the option byte check in dhcp_parse_reply() and set it to record op:
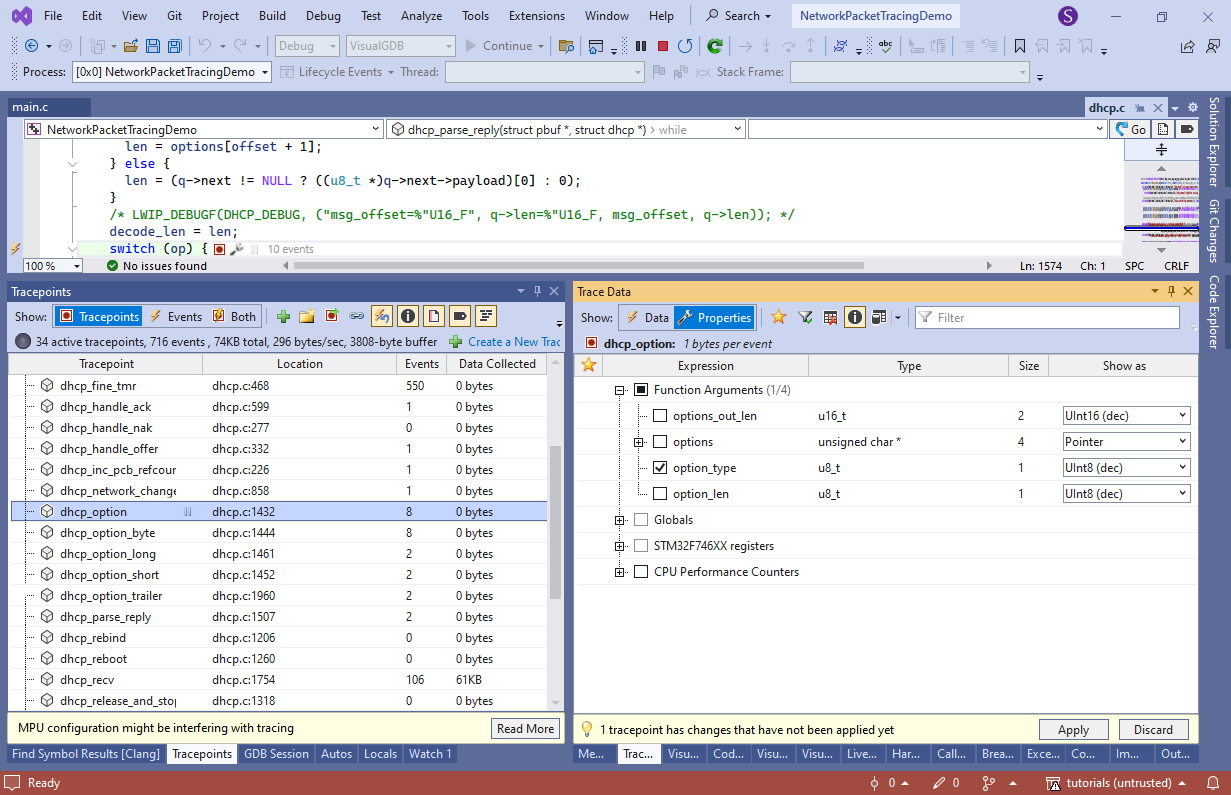
- Similarly,record dhcp_option() to keep a track of the options in the outgoing packet:
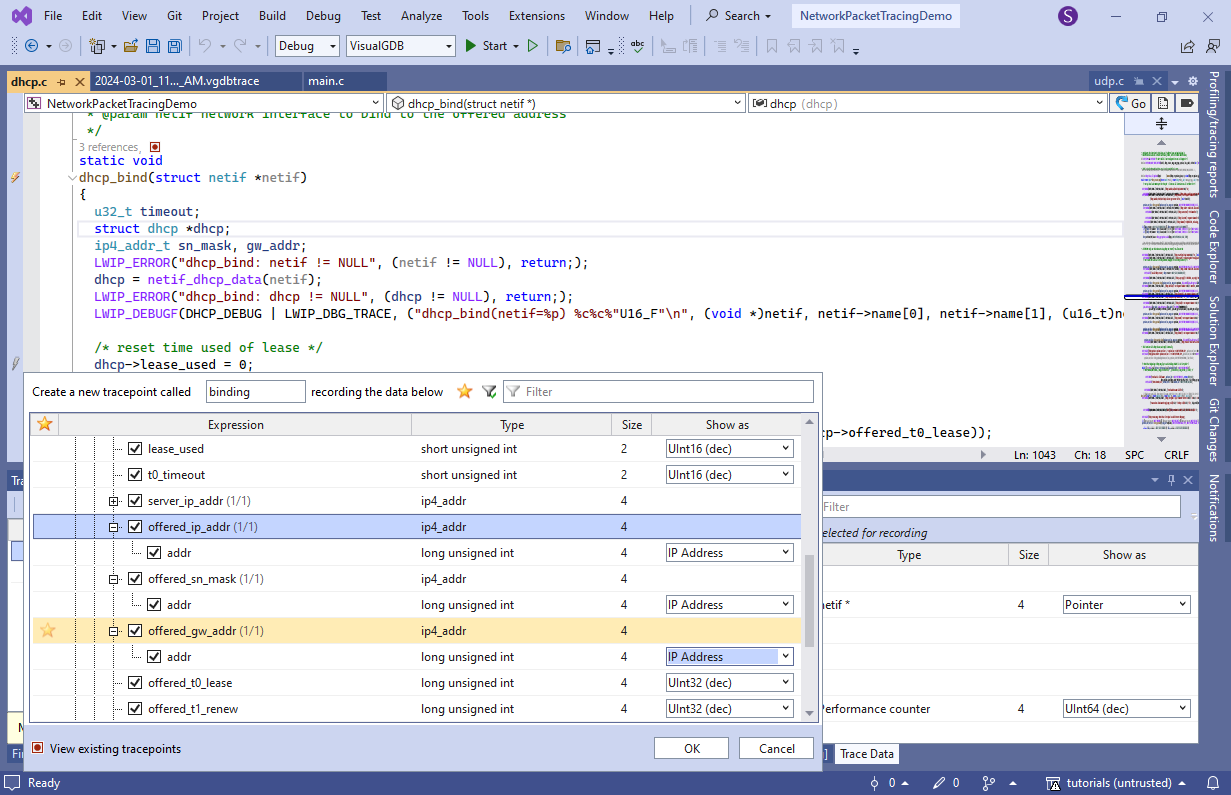
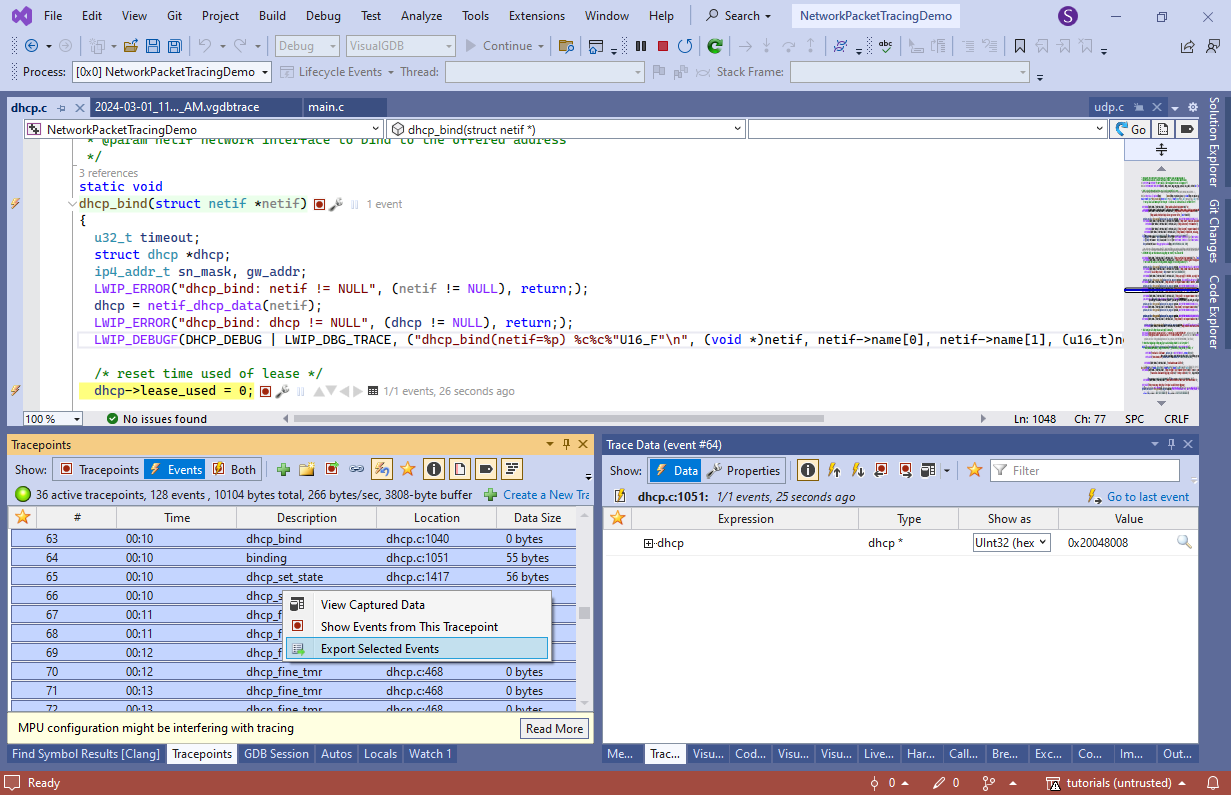
- Place another tracepoint in dhcp_bind() after it has computed the address of struct dhcp and record all fields of it:
- Reconnect the network cable to force another DHCP communication and check the traced events. Select all of them and click “Export selected events”:
 VisualGDB will produce a text file with records showing the incoming and outgoing DHCP communication:
=== udp_sendto_if_src ===
    p = {...}
        len = 308
    payload = 0x2004808c [01 01 06 00 ... 00]
    dst_ip = 0x08022910
        addr = 255.255.255.255
    dst_port = 67
=== dhcp_recv ===
    p = {...}
        len = 576
        payload = 0x20003862 [02 01 06 00 ... 00]
    addr = {...}
        addr = 192.168.0.2
    port = 67
=== Parse option ===
    op = 53
=== Parse option ===
    op = 51
=== Parse option ===
    op = 54
=== Parse option ===
    op = 1
=== Parse option ===
    op = 3
In this example, you see how the server (192.168.0.2) sent a packet containing the Msg Type (53), Address Time (51), DHCP Server ID (54), Subnet Mask (1) and Router (3) options. We did not record the value of each option in this example, but it can be easily done by adding another tracepoint.
- You can also let VisualGDB create tables with the data from relevant tracepoints. Create a new table view as shown below:
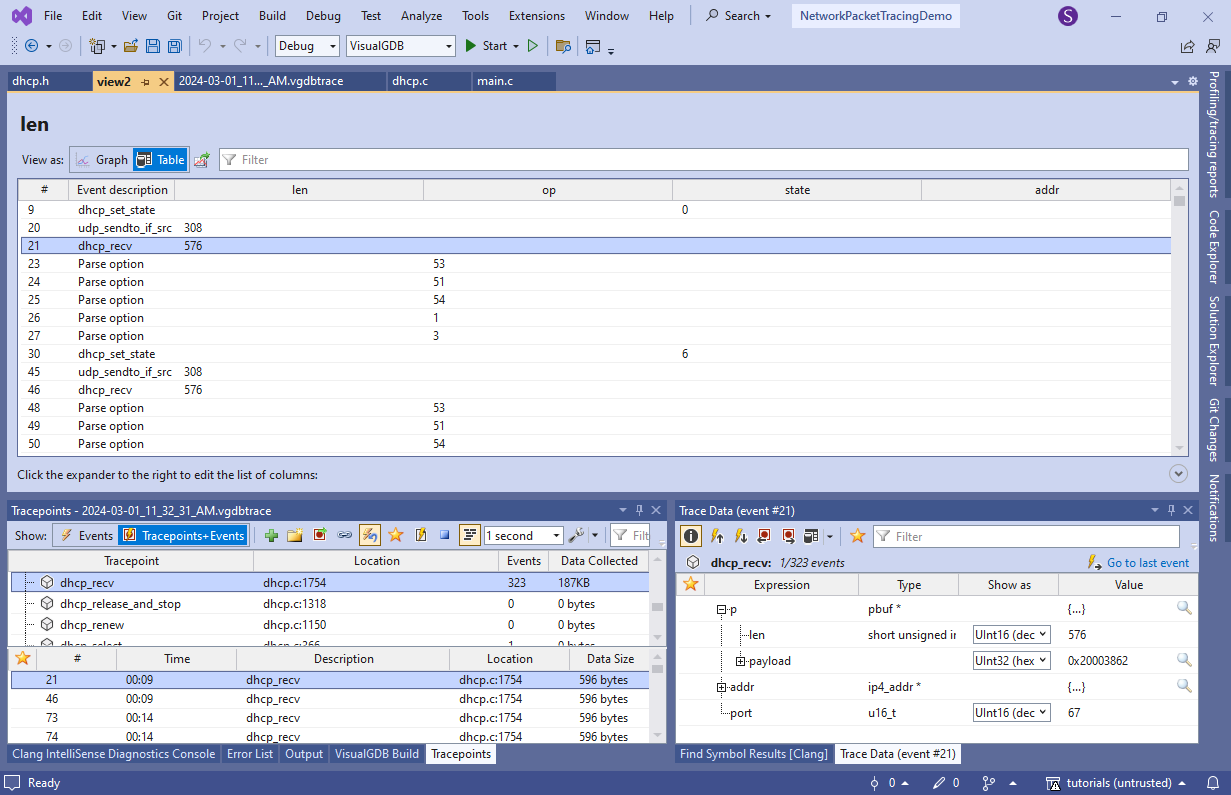
- Drag the option values from the tracepoints recording them into one column, then add another column for the incoming/outgoing packet length, and yet another one for DHCP state. VisualGDB will show the same information in a more compact form:
- Click the “export tracepoint set” button on the toolbar and enter a name for the set. VisualGDB will save the tracepoints (with their configuration) and remove them from the list:
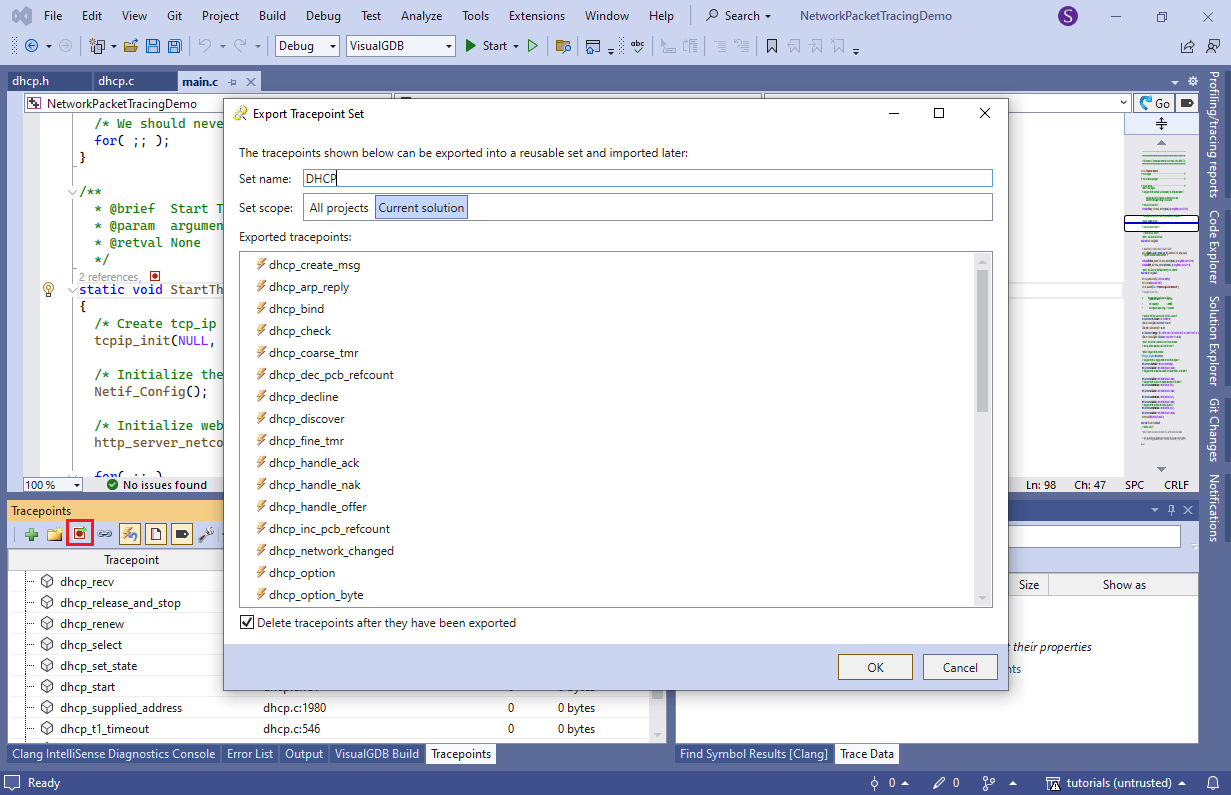 Next time you want to trace DHCP logic, you can simply import the tracepoint set via the context menu.
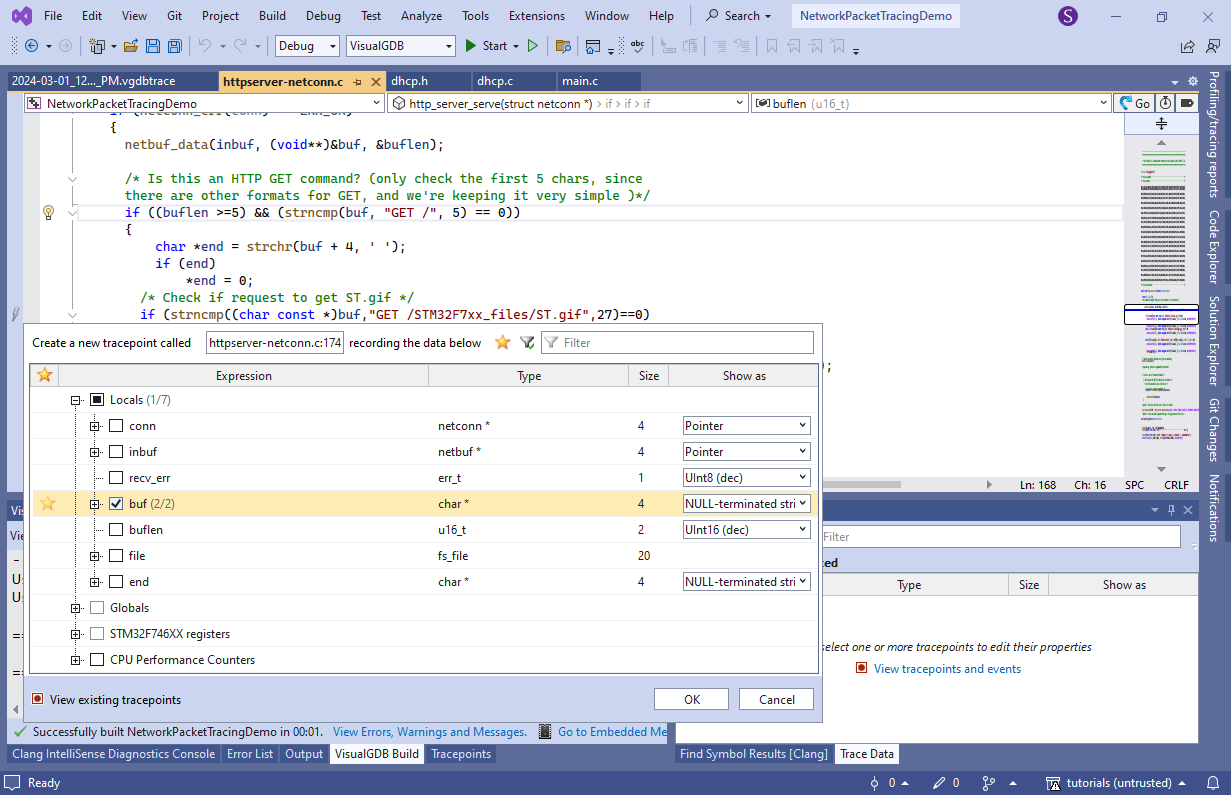
 - Now we will show how to record the URLs of all pages requested by the HTTP clients. Go to http_server_serve(), set a tracepoint on the first URL comparison and record buf as a null-terminated string:
- Refresh the page and observe how VisualGDB recorded new events. Then, create another table view:
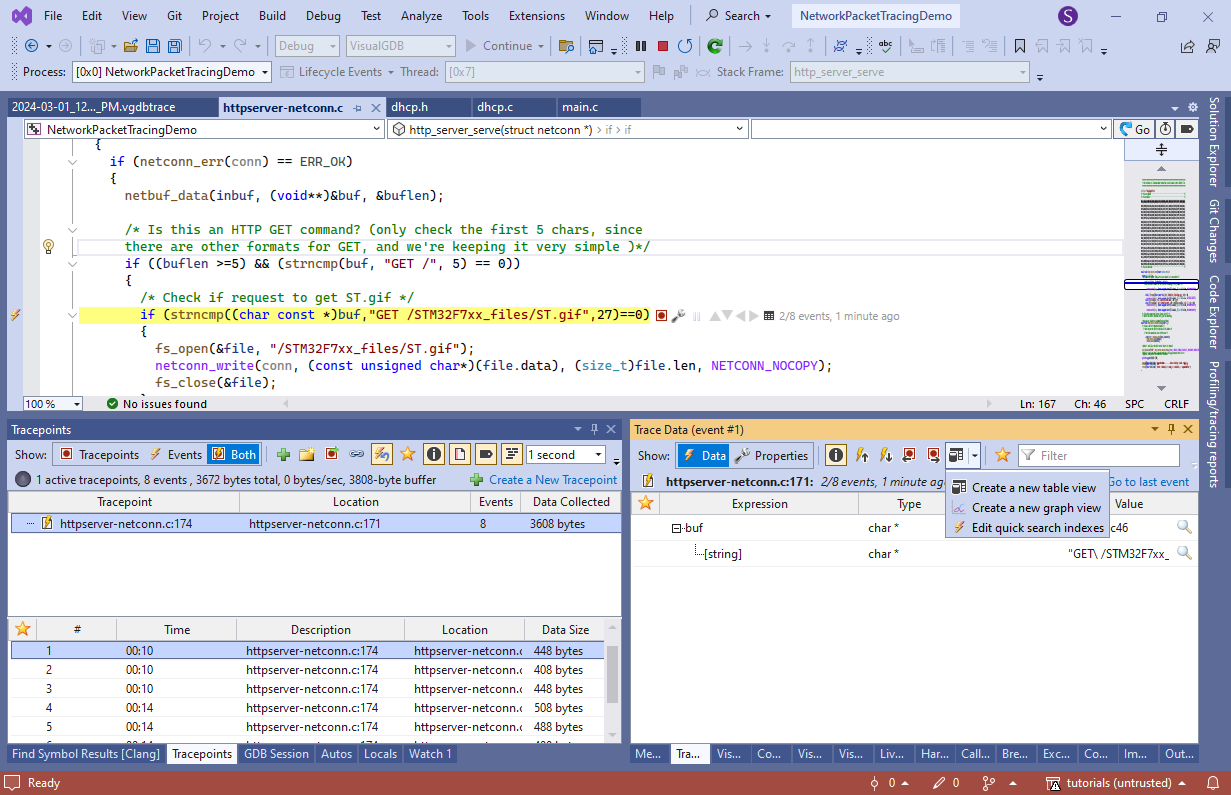
- Drag the [string] value from one of the events into the bottom part of the view and VisualGDB will display a table containing all requests recorded by the tracing logic:
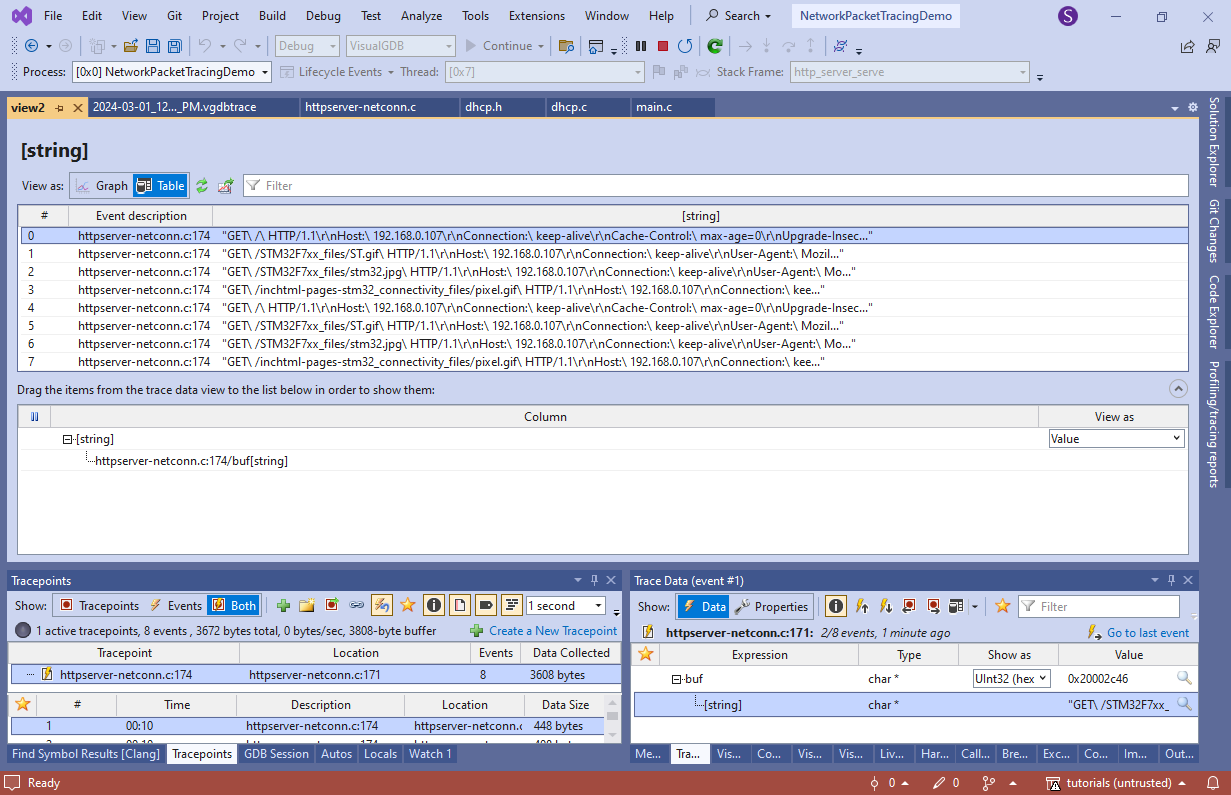 You can record any other information together with the request as well (e.g. remote IP address, exact timestamp, etc.) to get a detailed view of what the firmware is doing without ever having to stop it.