Optimizing STM32 USB High-Speed Performance with Tracing
This tutorial shows how to use several optimization techniques to get the maximum performance out of the high-speed USB interface on the STM32F7-Discovery board. We will show how raise the throughput in a single-direction mode more than twice the baseline, and how to use the linker-time optimization (LTO) to considerably drop the CPU utilization by the USB stack.
We will use VisualGDB’s software tracing to get the cycle-accurate timings between different parts of the USB communication and the Memory Explorer to understand the effects of the linker-time optimization on the generated code.
If you are just looking for the final numbers, scroll back to the end of the tutorial or click here.
Before you begin, install VisualGDB 6.0 or later.
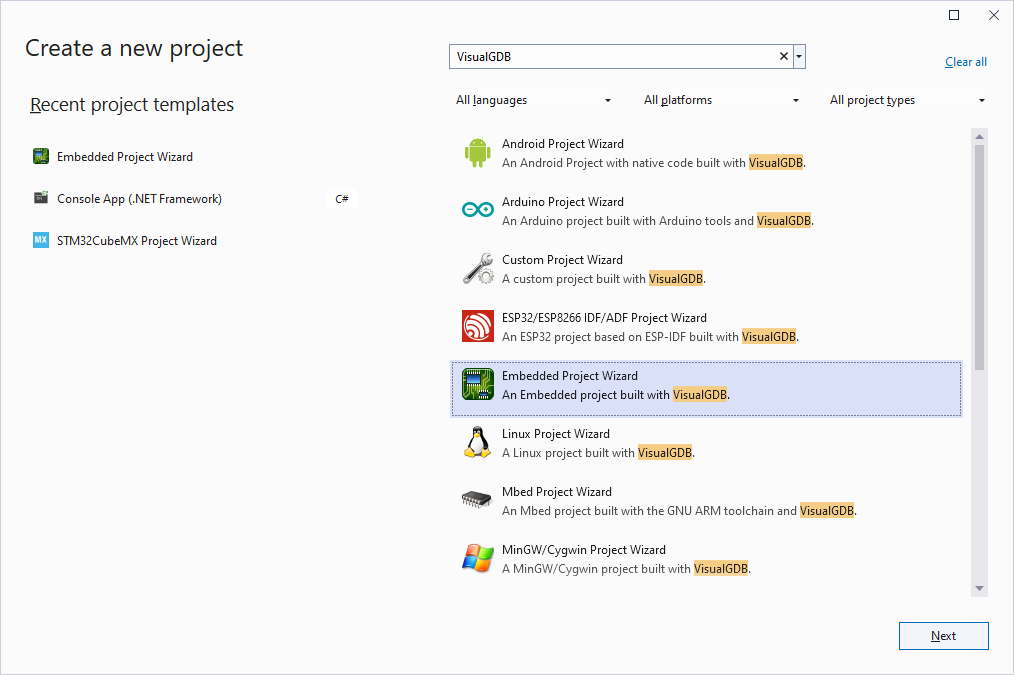
- Start Visual Studio and Open the VisualGDB Embedded Project Wizard:
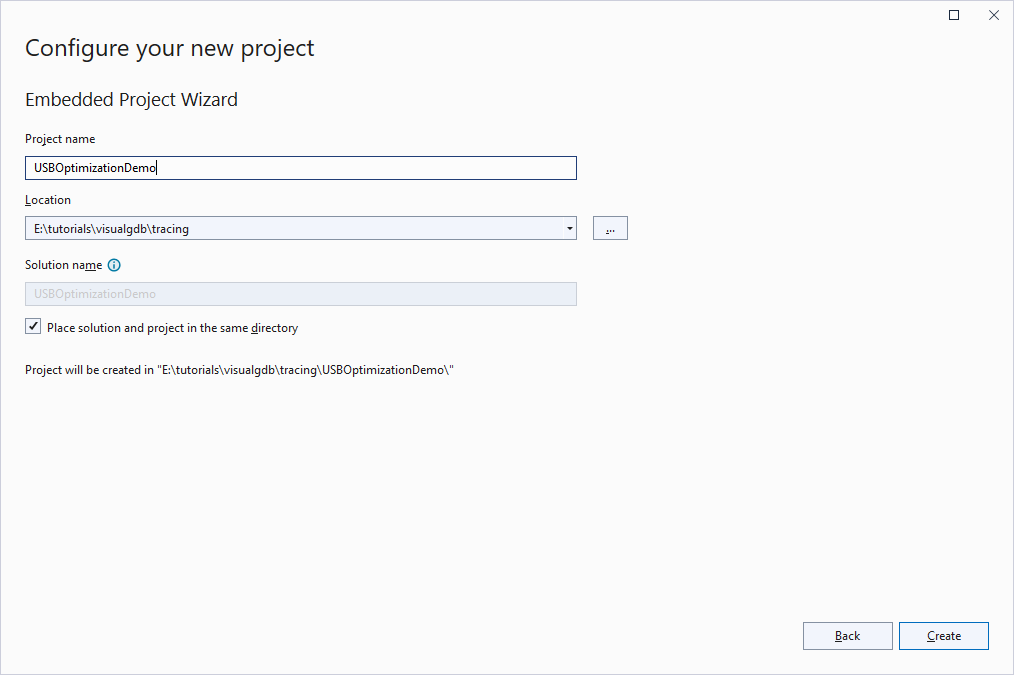
- Enter the name and location for your project:
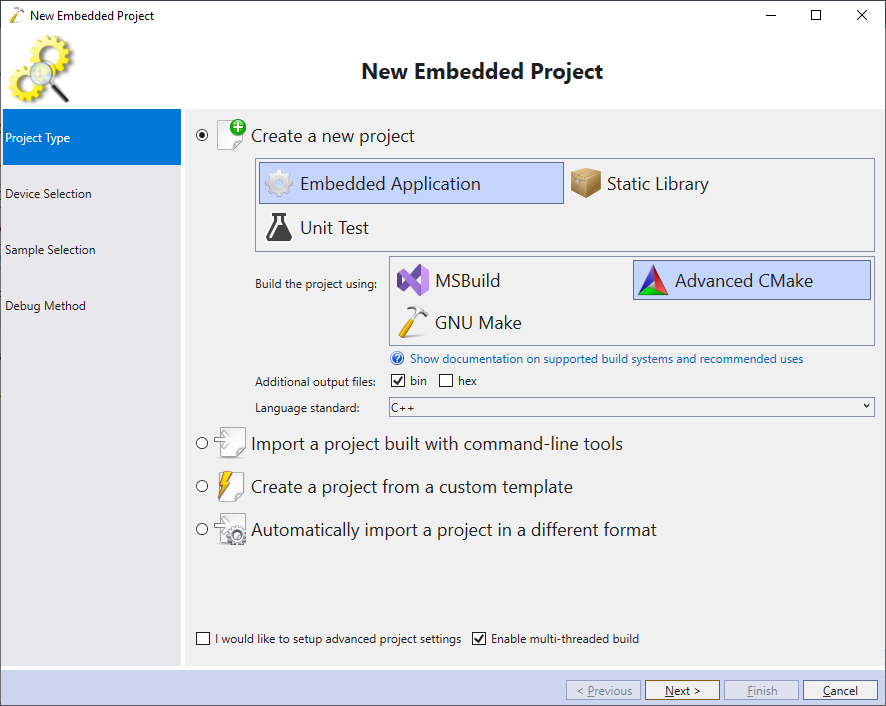
- Proceed with creating a new embedded application using Advanced CMake:
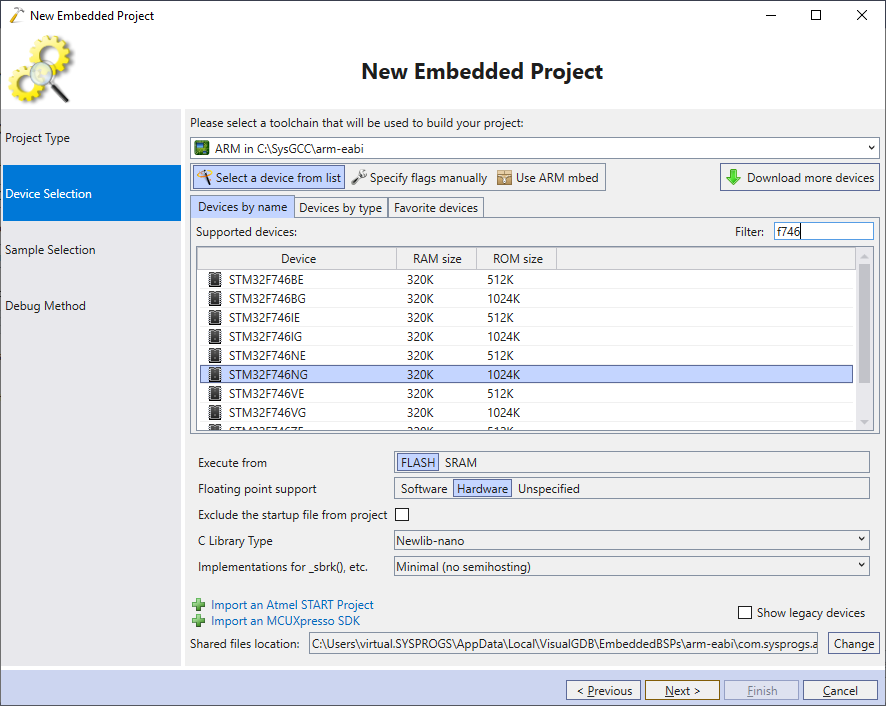
- Choose the latest ARM toolchain and select your device from the list. In this tutorial we will use the STM32F7-Discovery board that uses the STM32F746NG device:
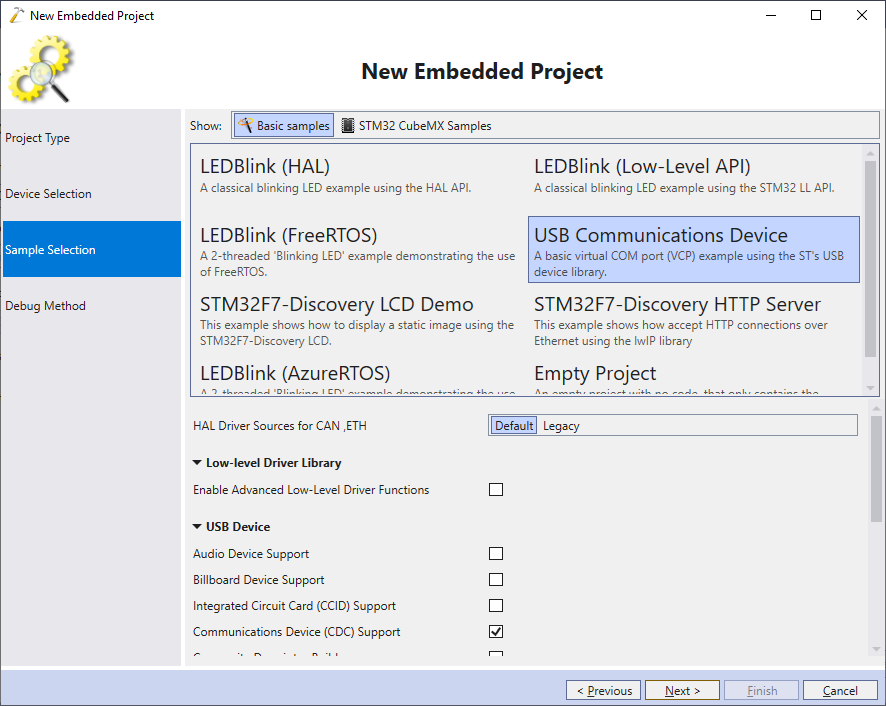
- Select the USB Communications Device sample on the next page and click “Next”:
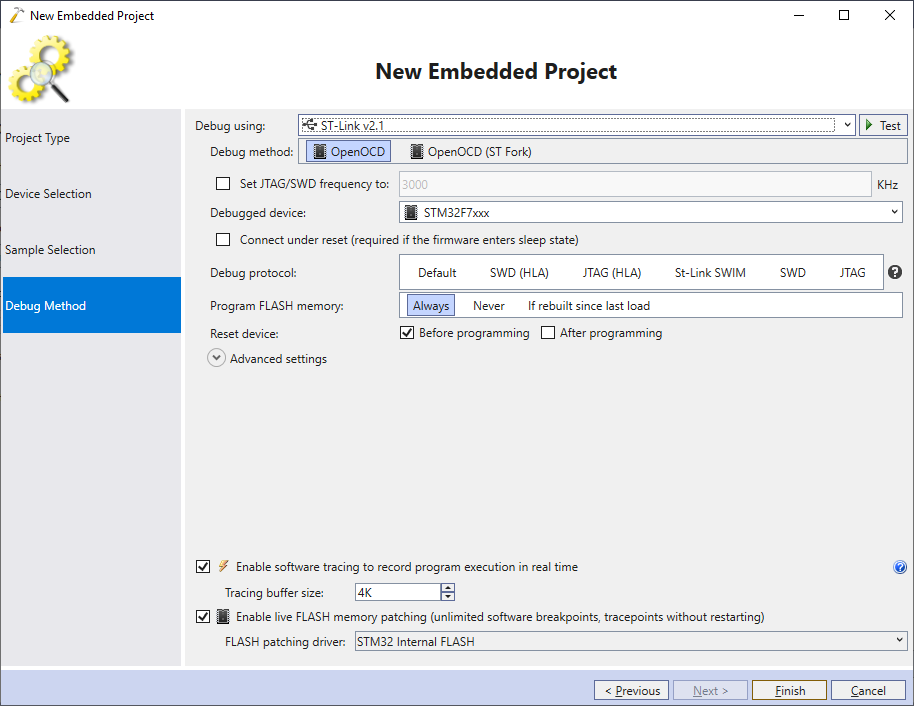
- Connect your on-board ST-Link debugger to the USB port and make sure VisualGDB recognizes it. Then ensure you have the software tracing and FLASH memory patching enabled and click “Finish” to generate the project:
- VisualGDB will create a sample project, however it will use the default clock settings that may not match your board, so the project may not run correctly:
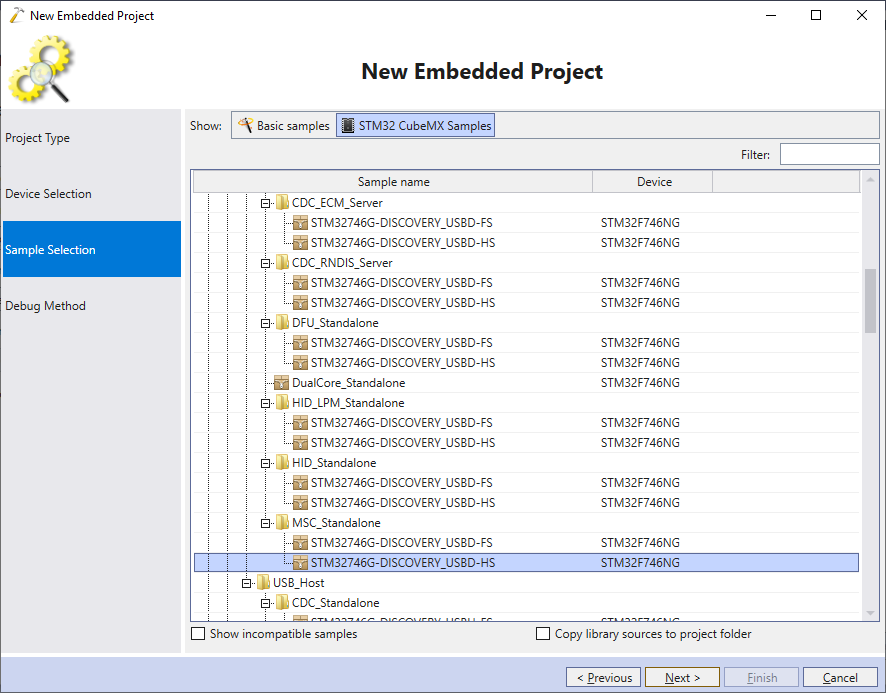
- To fix this, create another project based on the STM32CubeMX Samples -> USB_Device -> MSC_Standalone -> [board name]-HS:
- Then, copy the following from the cloned MSC sample into the main project:
Entity Functionality SystemClock_Config() function Configures PLL to match the on-board crystal Entire usbd_conf.c file
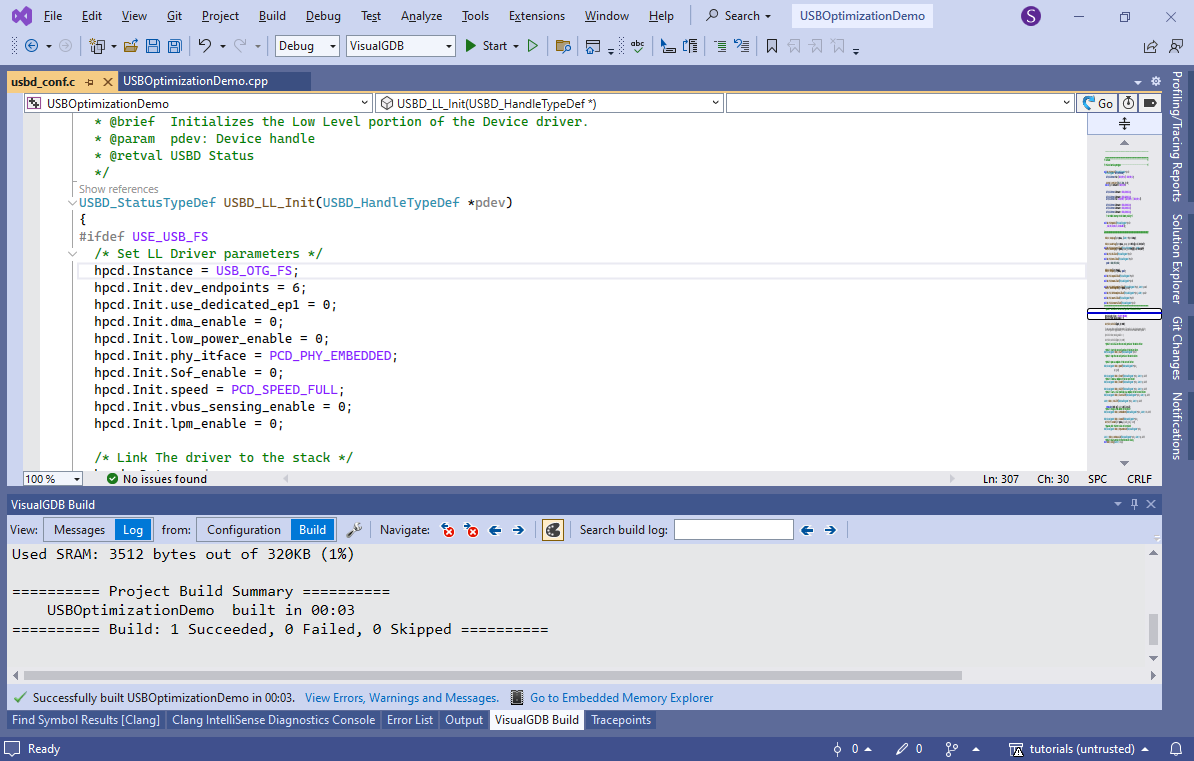
Handles low-level aspects of the USB configuration Entire system_stm32f7xx.c file Enables optimal FLASH and power settings Entire stm32f7xx_hal_conf.h file Specifies correct on-board crystal frequency and other settings If usbd_conf.c doesn’t build due to missing main.h, replace #include <main.h> with the following code:
#include <usbd_core.h>
#include <usbd_cdc.h>
You can see the exact changes needed for the STM32F7Discovery board in this commit.
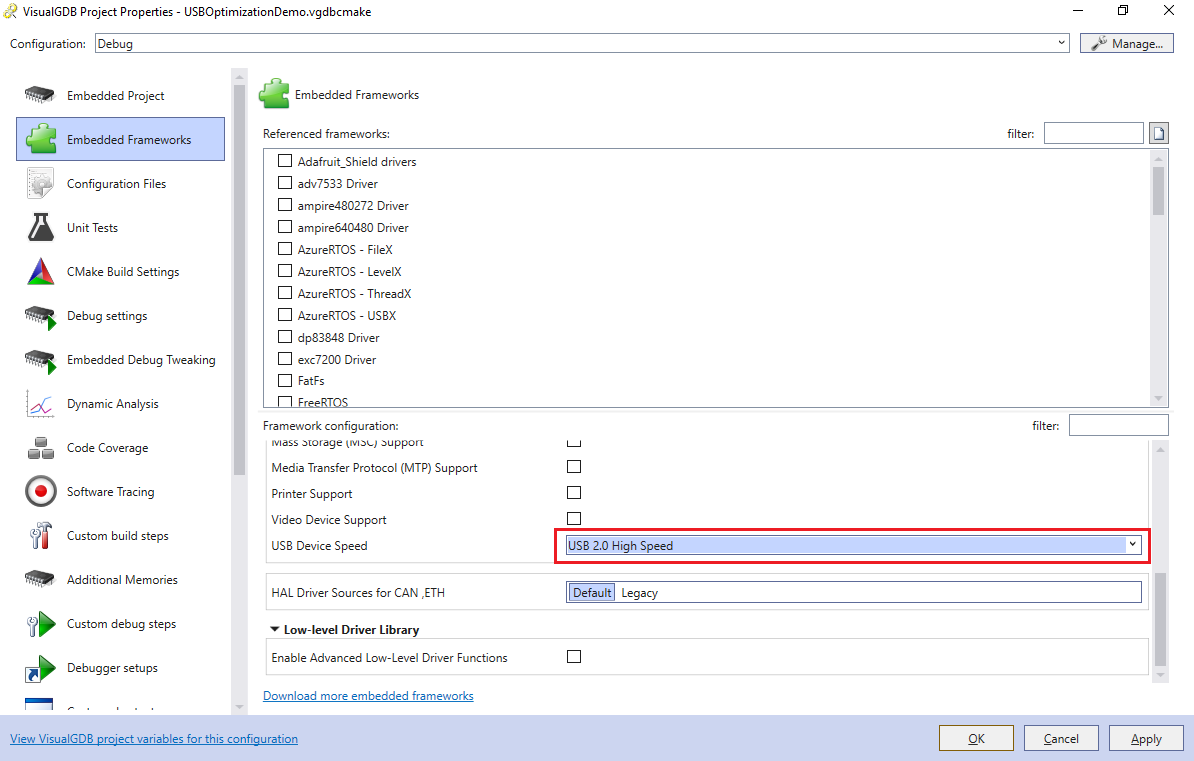
- Finally, ensure that the USB Device Speed is in VisualGDB Project Properties -> Embedded Frameworks is set to USB 2.0 High Speed:
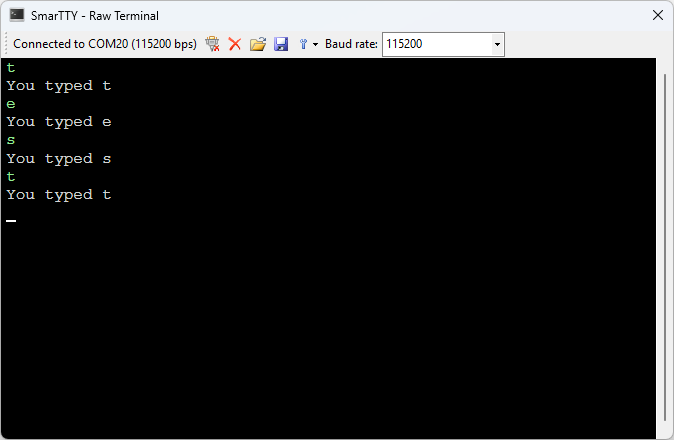
- Press F5 to start debugging and ensure the USB-HS port on the board is connected to your computer. A new USB-based COM port will appear, echoing any characters typed into it:
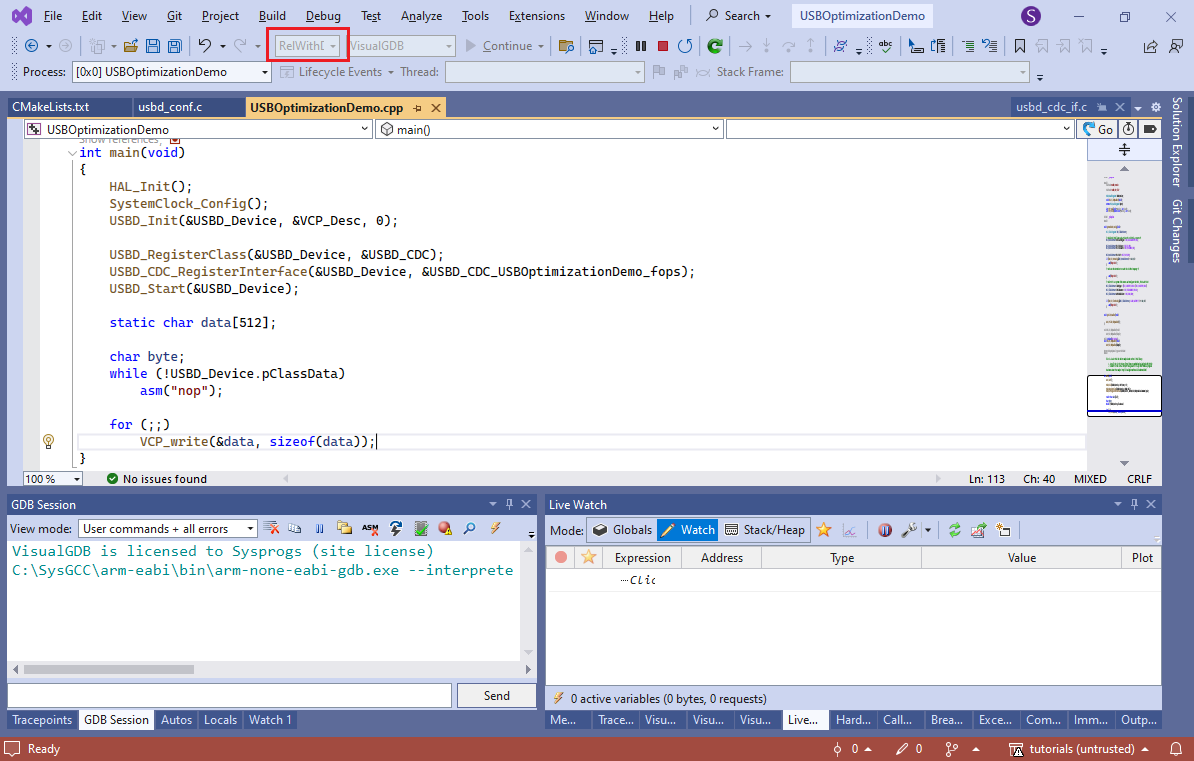
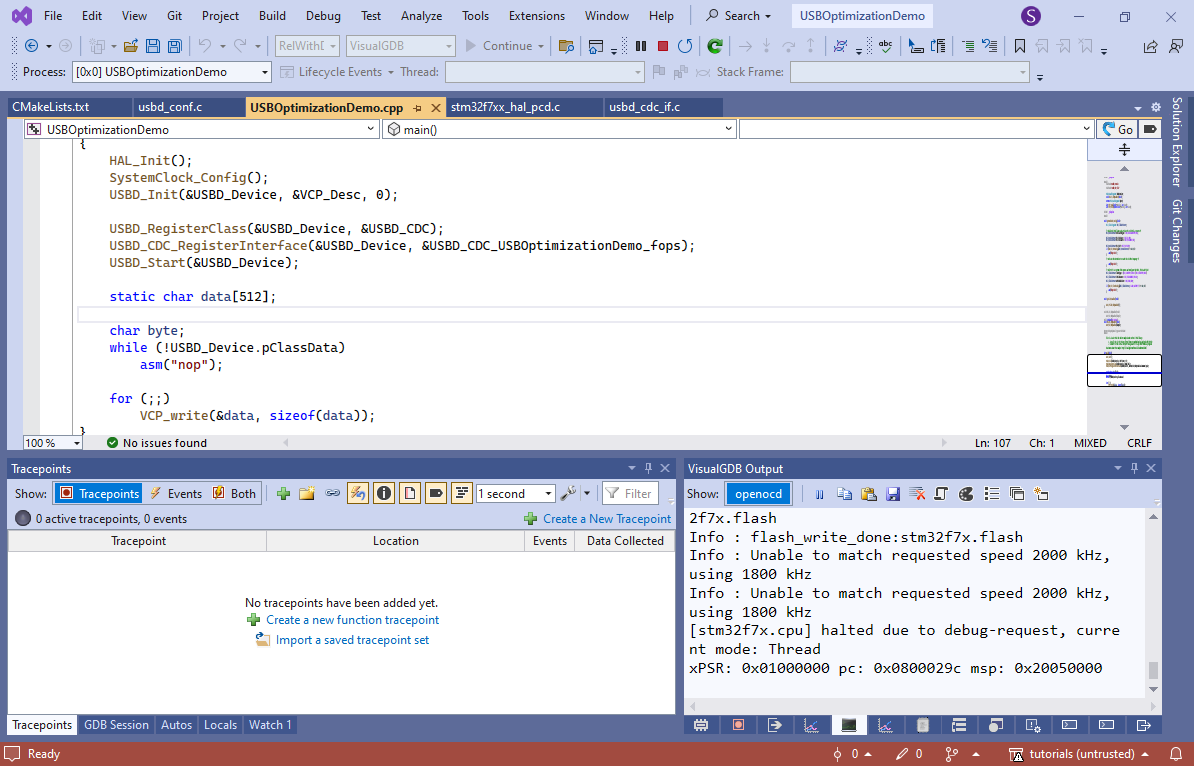
- Now we will modify the main() function to unconditionally send a stream of data via the USB port. Replace the code after the call to USBD_Start() with this:
static char data[512];
char byte;
while (!USBD_Device.pClassData)
    asm("nop");
for (;;)
    VCP_write(&data, sizeof(data));
Then, create a basic C# program that will continuously read the data and show the throughput:
static void Main(string[] args) { SerialPort port = new SerialPort("COM20"); port.Open(); var buf = new byte[65536]; for (int i = 0; i < buf.Length; i++) buf[i] = (byte)i; long bytesRead = 0; DateTime start = DateTime.Now; for (; ; ) { int done = port.Read(buf, 0, buf.Length); bytesRead += done; double msec = (DateTime.Now - start).TotalMilliseconds; double bytesPerSecond = (bytesRead * 1000) / msec; double kbPerSecond = bytesPerSecond / 1024; Console.Write($"\rRead: {bytesRead / 1024}KB; " + $"Average speed: {kbPerSecond:f0} KB/sec"); } } - Replace COM20 with the COM port number on your machine and run the benchmark program to measure the speed:
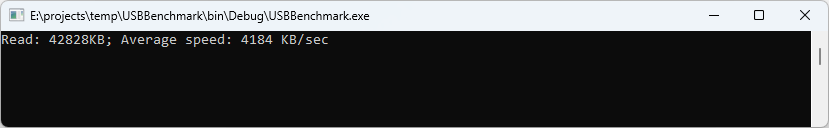 In our experiments, the unoptimized (Debug) build yielded about 4 MB/sec.
 - Switch the solution configuration to RelWithDebInfo and try measuring the speed again:
 In our experiments, this raised the USB throughput to about 7.7 MB/sec.
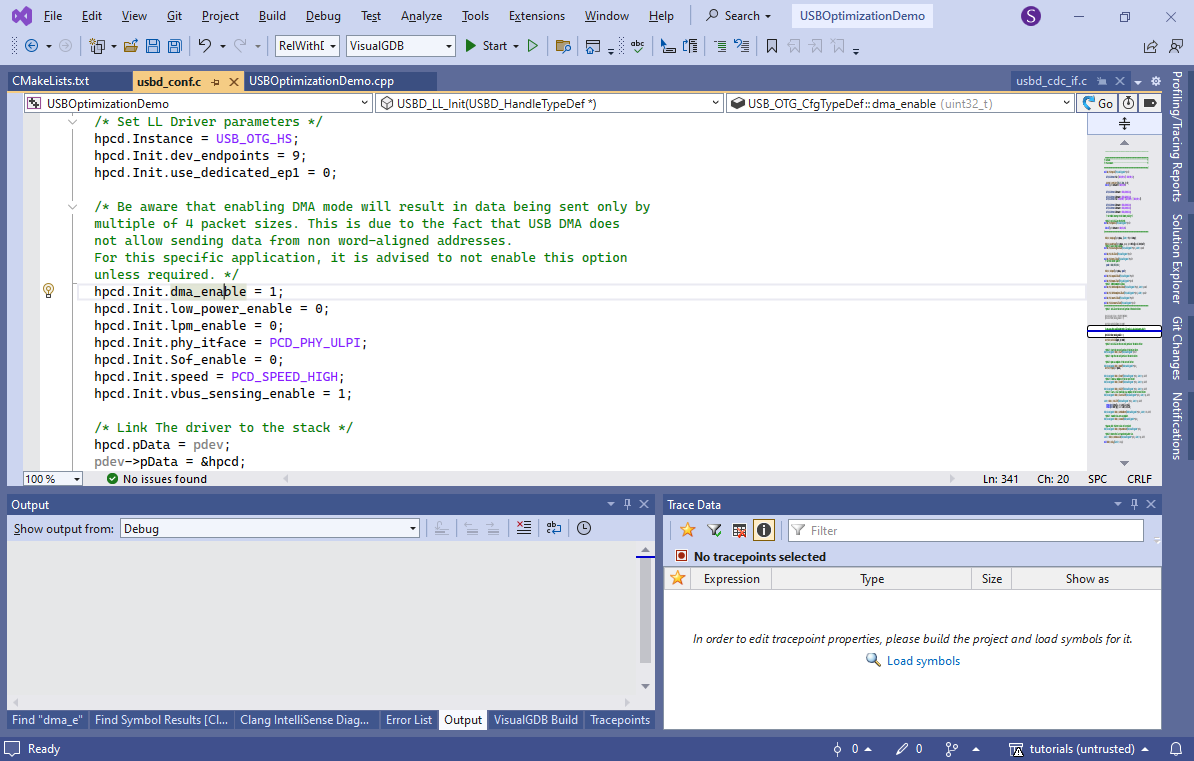
 - Note that the default STM32 USB configuration does not use DMA for the USB high-speed endpoint. You can override by setting dma_enable to 1 in the USBD_LL_Init() function in usbd_conf.c:
 This brings the throughput up to 9.1 MB/s.
 - Now we will use the VisualGDB’s Software Tracing to understand the exact timing of the USB communication and find bottlenecks. Sending large amounts of data via the bulk endpoint would normally involve a loop like this:
- Main code calls VCP_write() that starts waiting for the USB endpoint to become ready
- VCP_write() asks the STM32 HAL library to send the packet, which computes various headers, and ultimately starts a DMA transaction
- Once the transfer is complete, the USB hardware raises an interrupt
- The USB interrupt handler checks various conditions, marks the USB endpoint as ready, and the cycle repeats
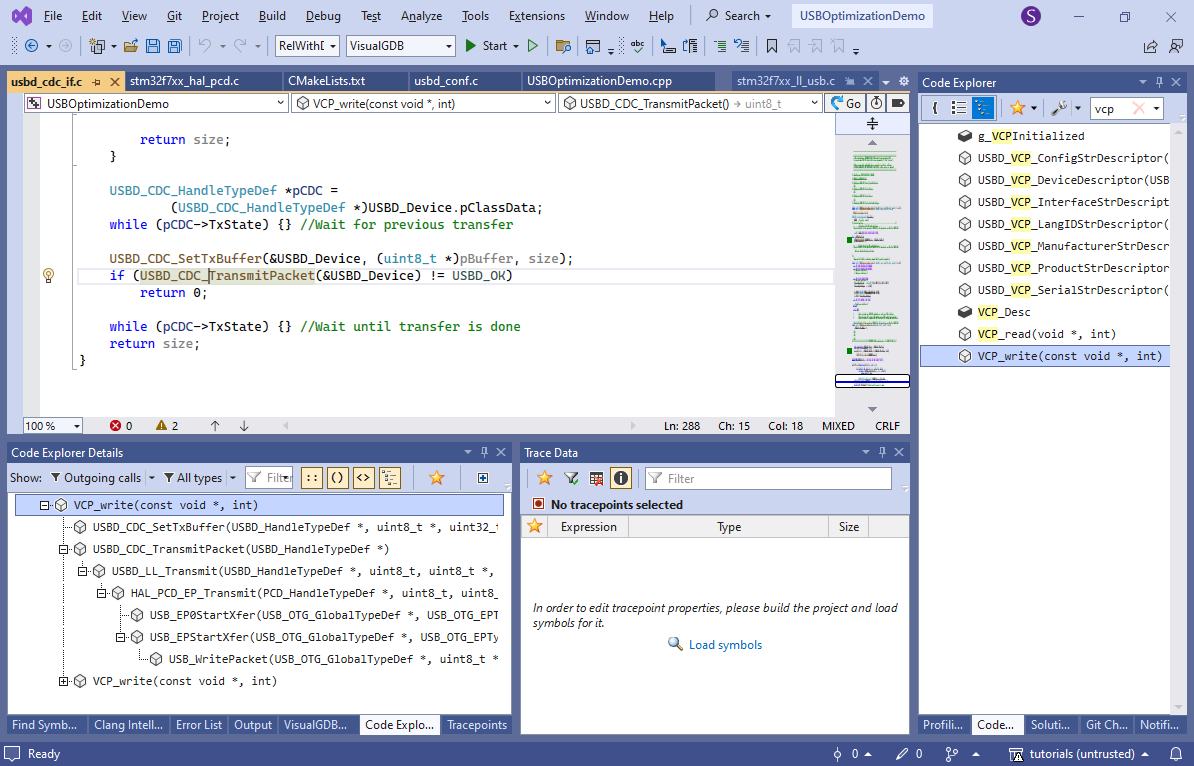
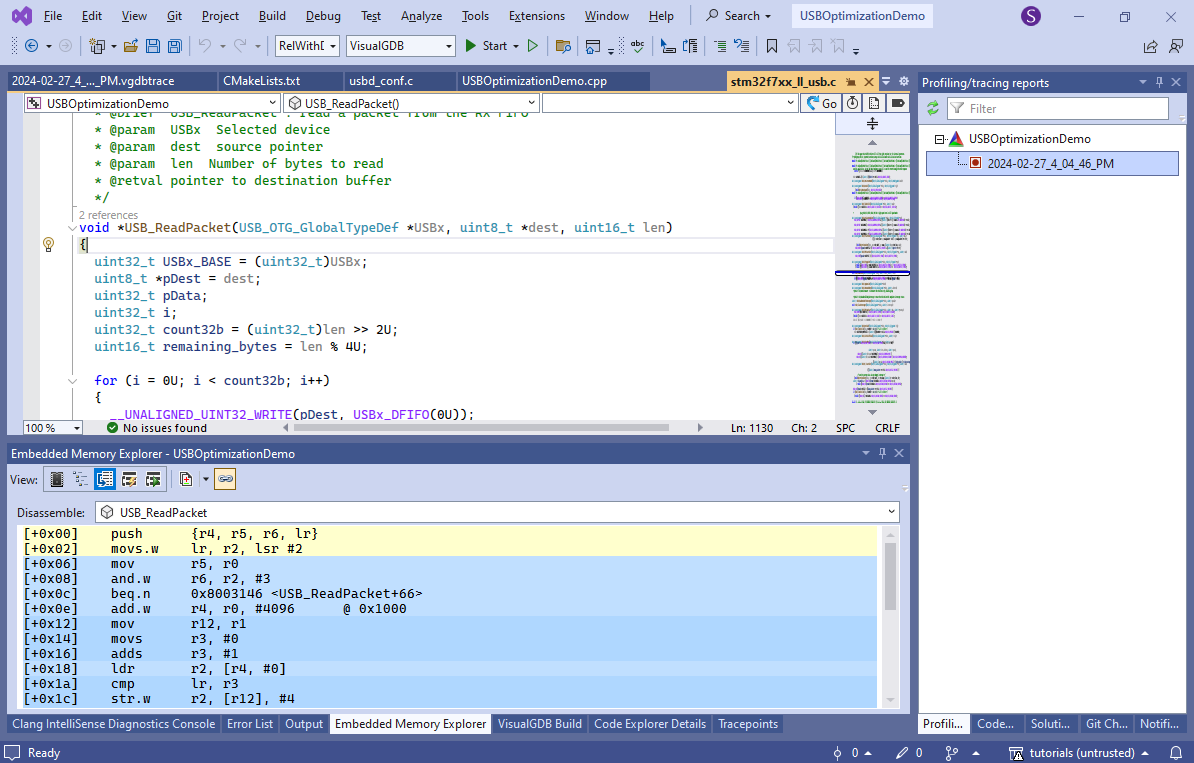
With tracepoints we can measure the exact time between different parts of this loop, and see how much optimization potential there is. Use Code Explorer in the Outgoing Calls view to see all functions called from VCP_write():
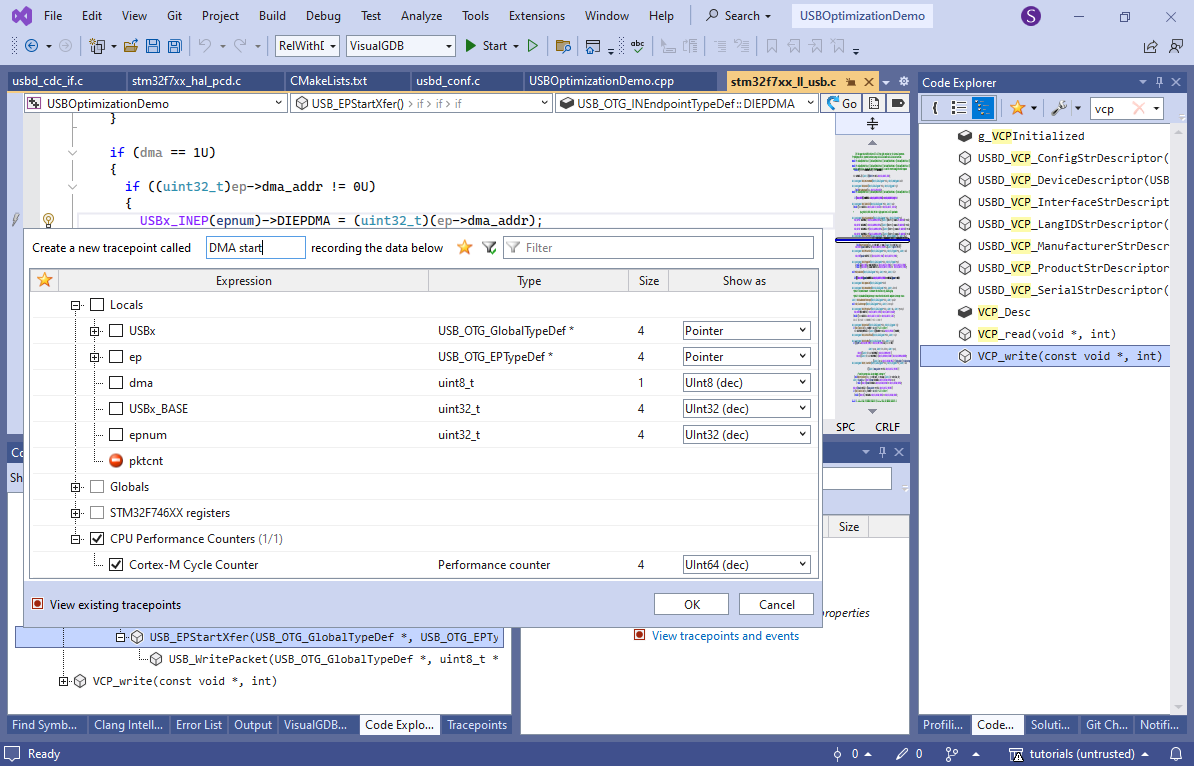
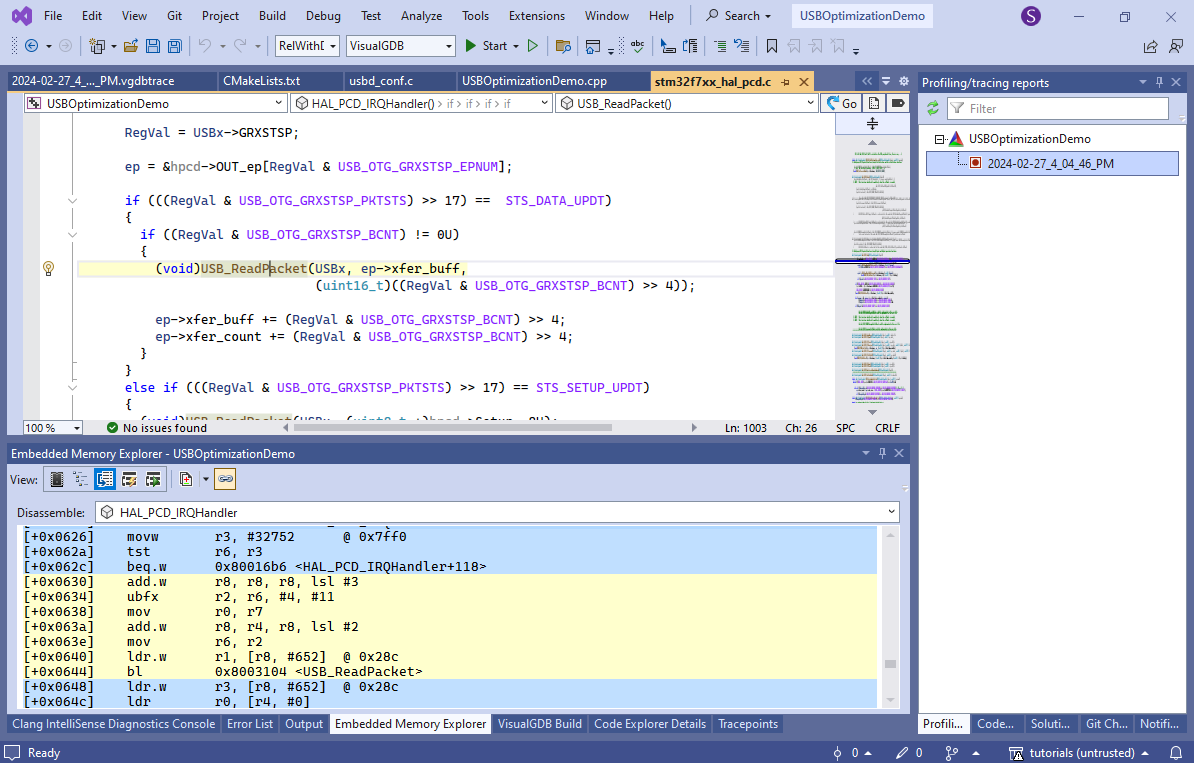
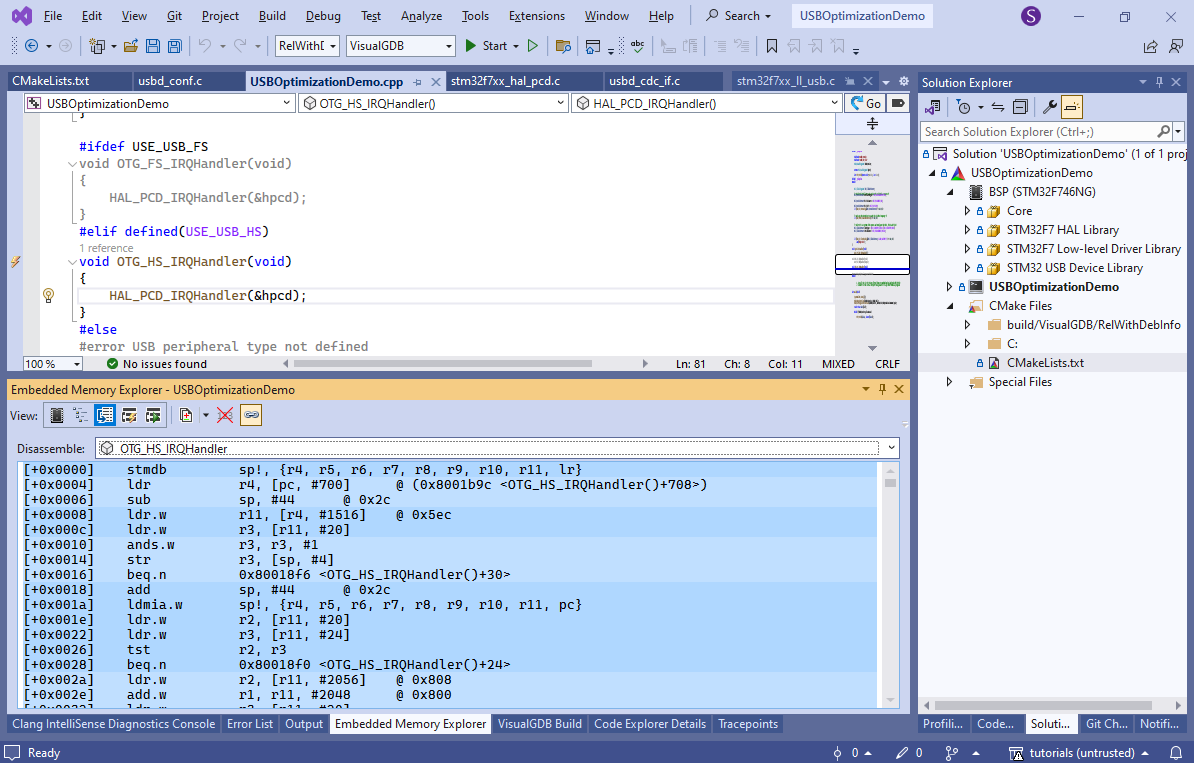
- USB_EPStartXfer() looks like the one that would actually start the transfer. Go to it, locate the line writing USBx_INEP(epnum)->DIEPDMA and set a tracepoint there recording the Cortex-M cycle counter:
- Add another tracepoint in the beginning of the OTG_HS_IRQHandler() function. You can use the “new tracepoint” button in the Tracepoints window to quickly locate it by name:
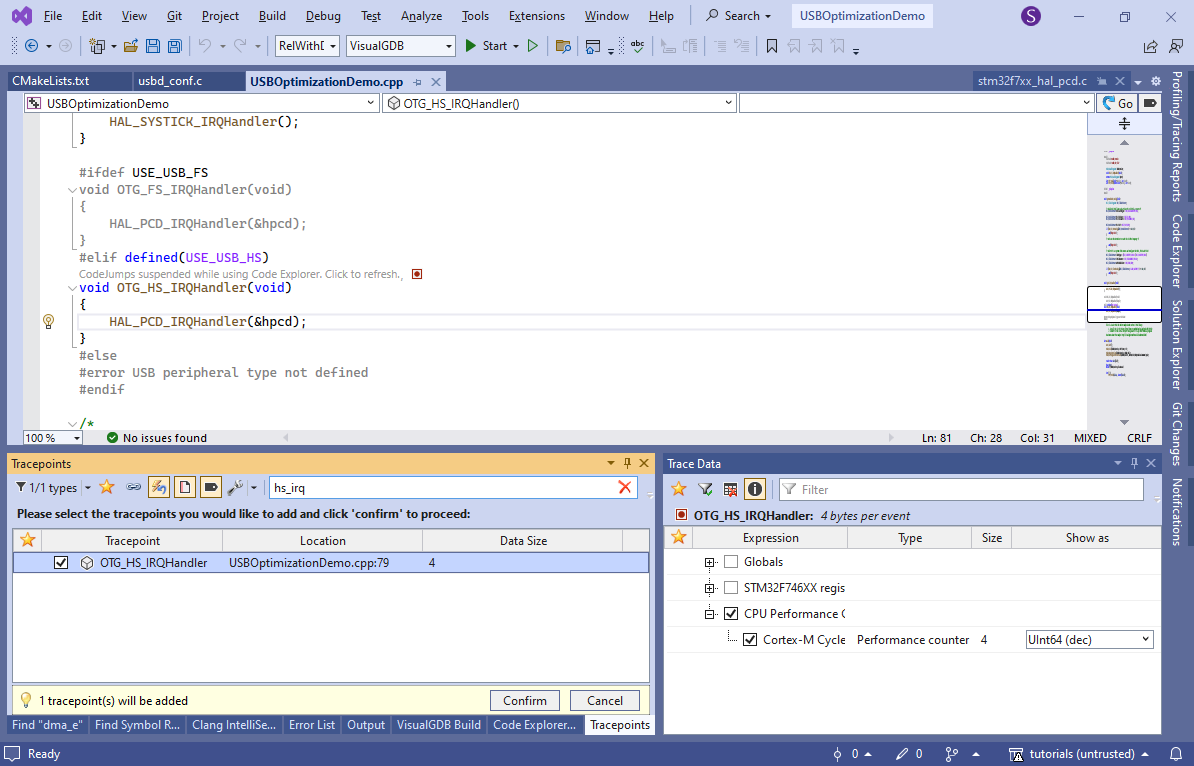
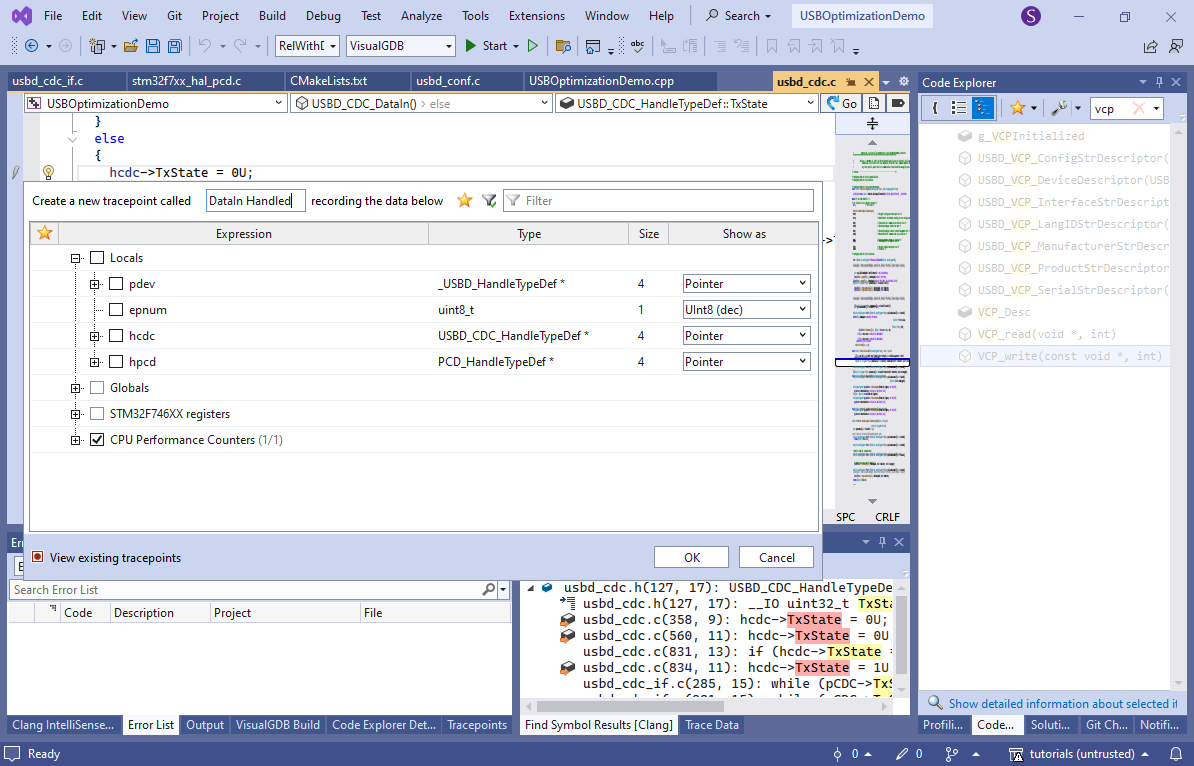
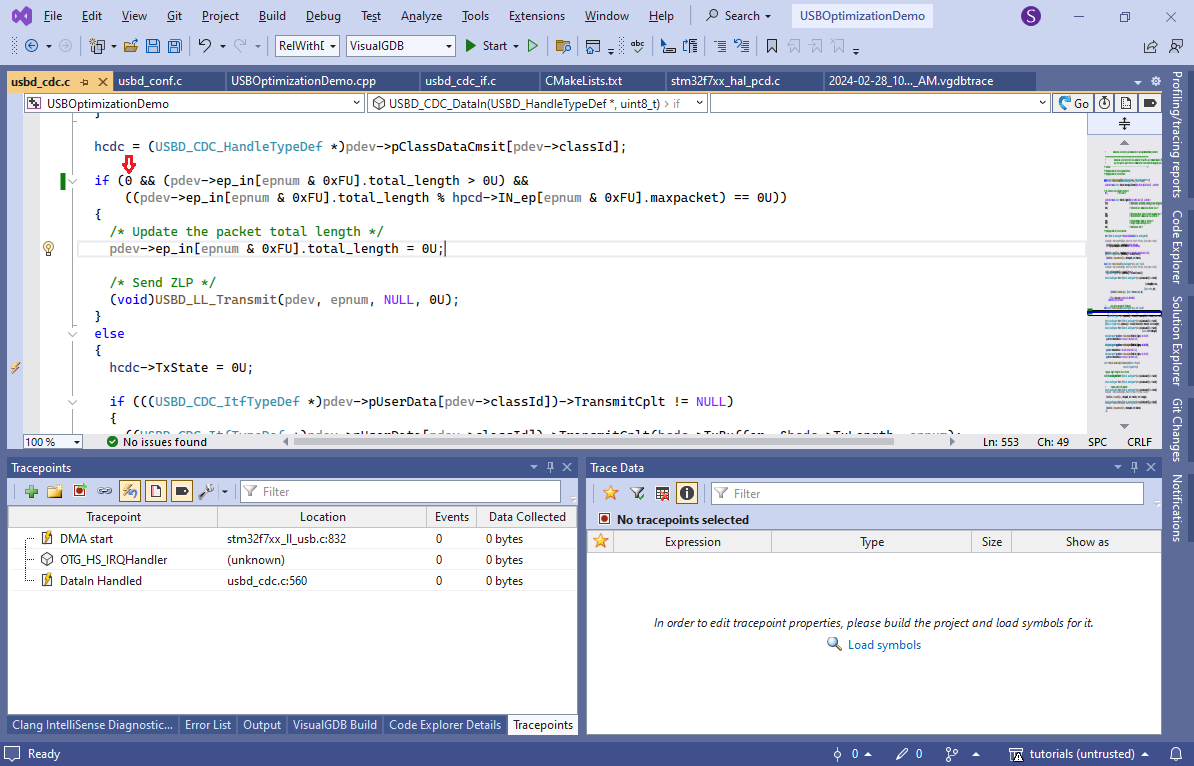
- Note how VCP_write() waits for TxState to be cleared before sending the next packet. Use the Find All References command to find the code in USBD_CDC_DataIn() that clears it, and set another tracepoint there:
- Now you can start debugging, run the benchmark tool and see how the tracepoints are generating events:
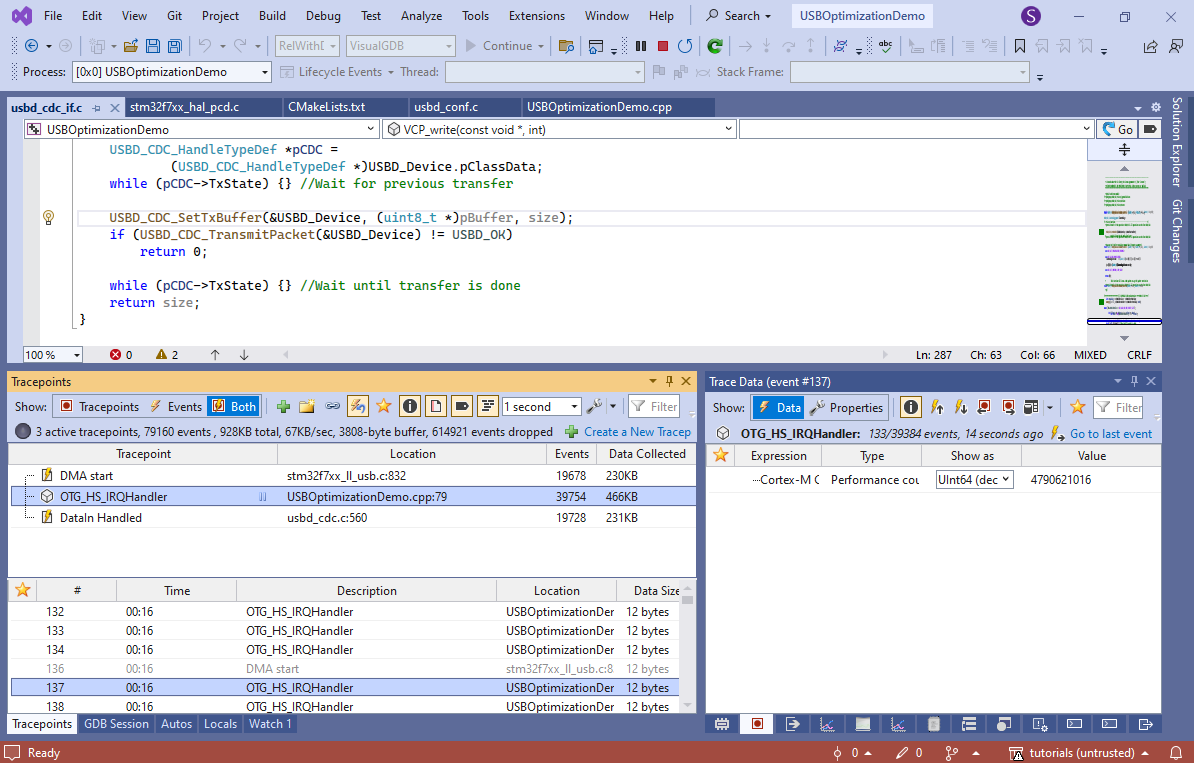 As the USB HS packets are very fast, it will produce trace events faster than the debugger can read, so most events will be dropped. In this example it is not a problem, since we only need a small sample of events to check the timing, but you could change this behavior via VisualGDB Project Properties -> Software Tracing to capture all events at the expense of slowing down the program.
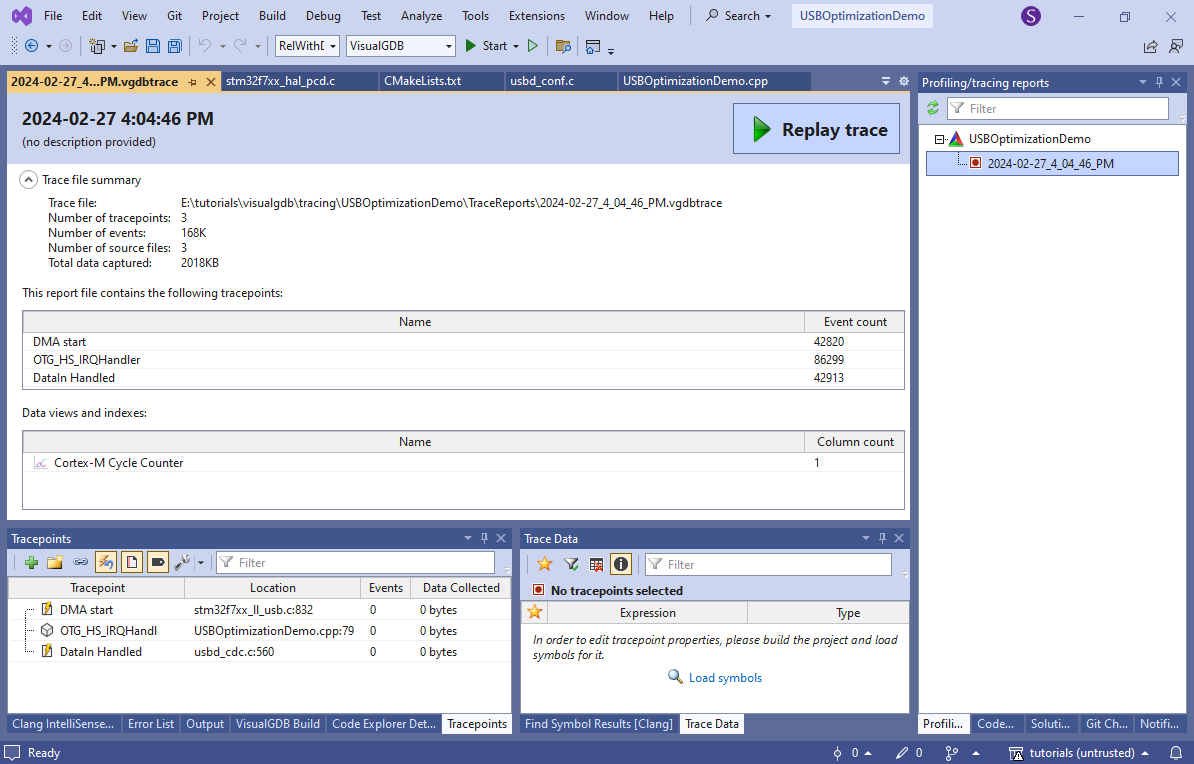
 - Stop the debugging session. VisualGDB will create a trace report file containing all recorded events. Click “Replay trace” to start viewing it:
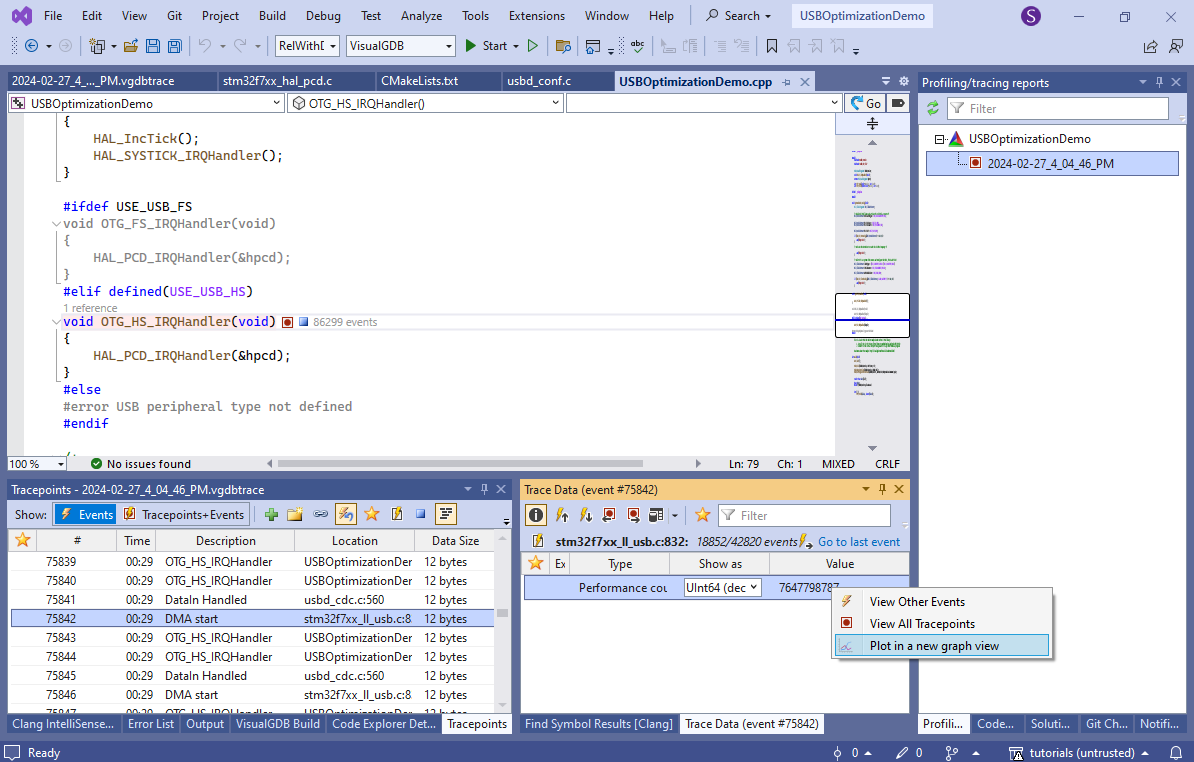
- Locate any of the events in the Tracepoints view, right-click on the performance counter in the Trace Data view and select “Plot in a new graph view”:
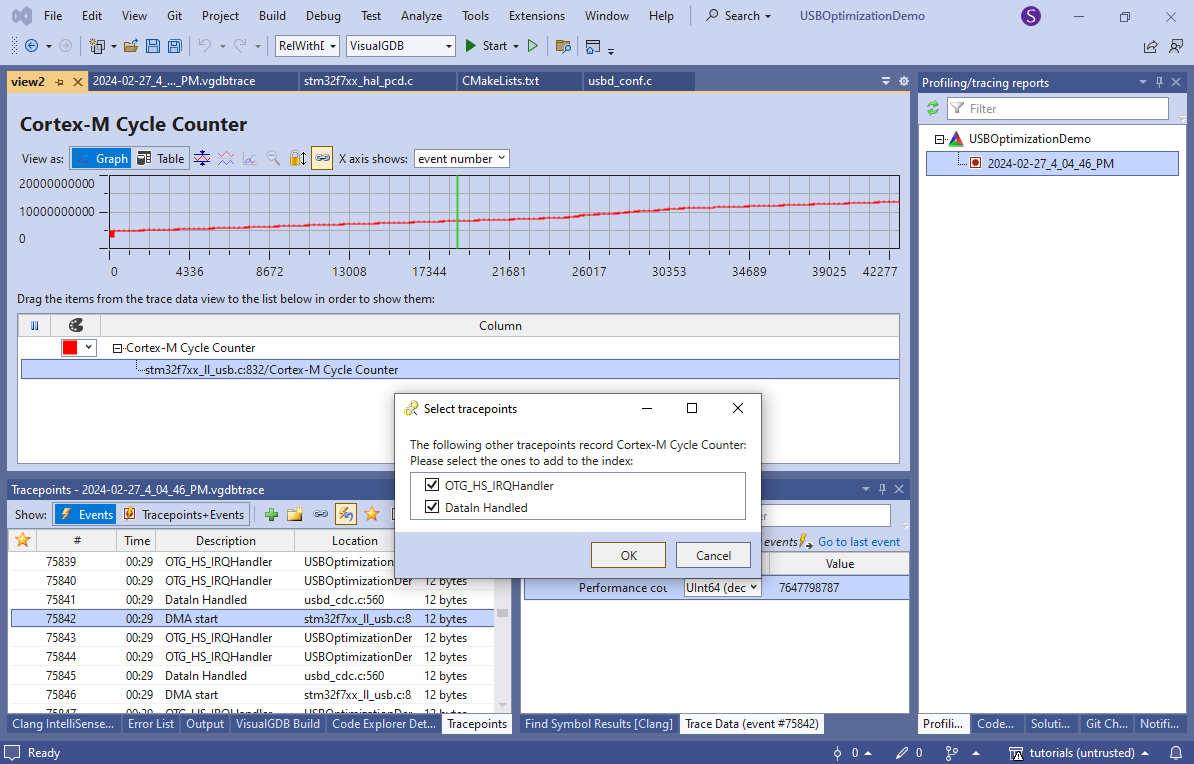
 You could also manually create a new graph, or table view and just drag the event there to begin plotting it.
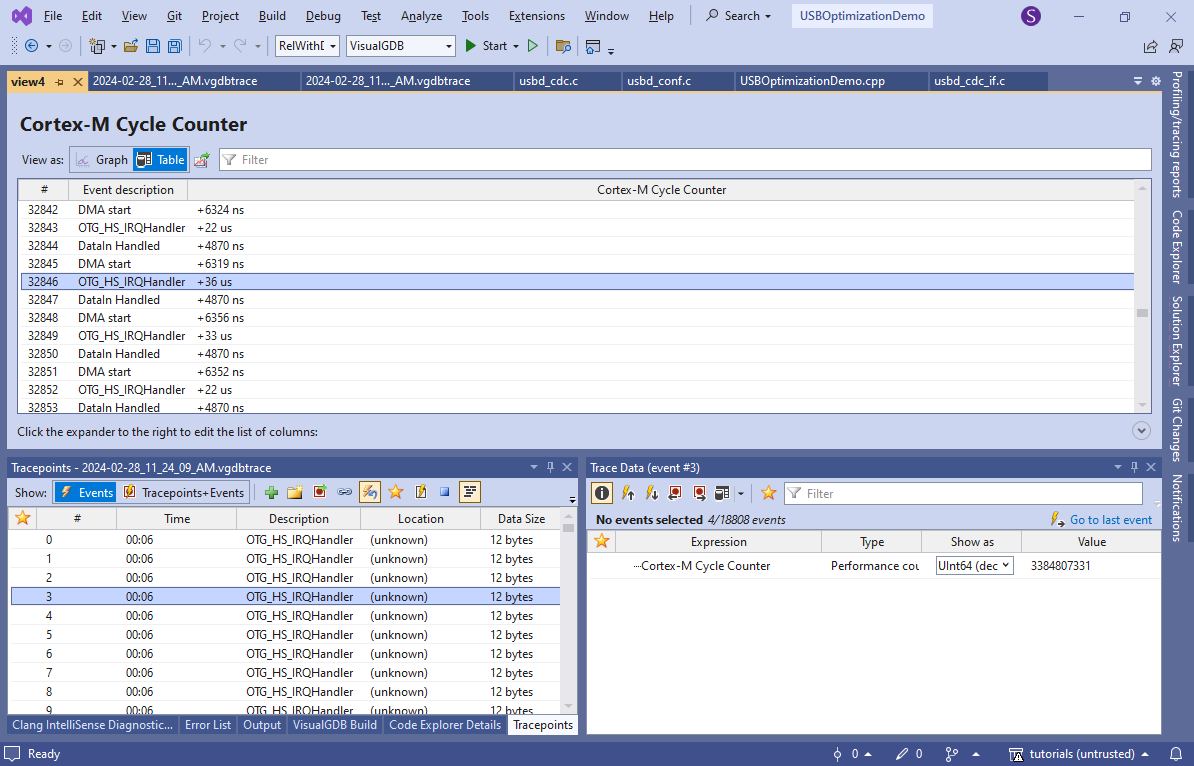
 - Right-click on the “Cortex-M Cycle Counter” line and select “add events from similar tracepoints”. VisualGDB will show all other tracepoints that capture the cycle counter:
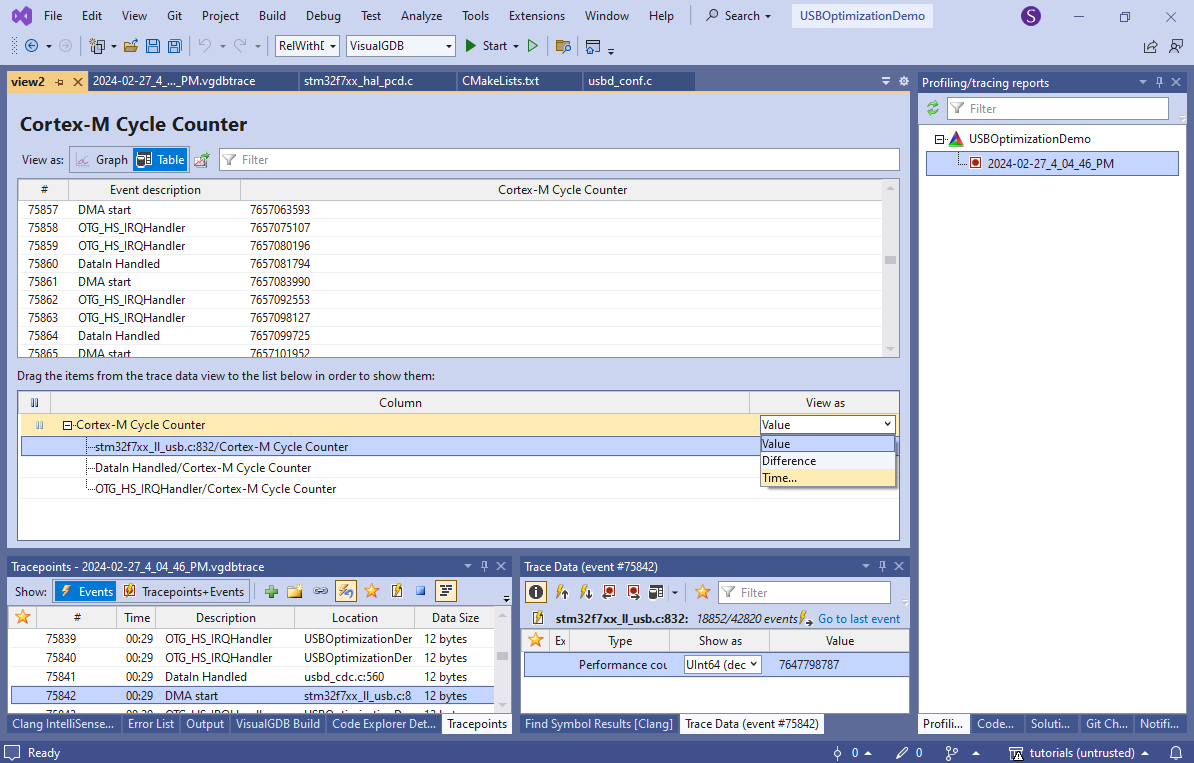
- Switch the view from Graph to Table and then convert the cycle counter column to “time”:
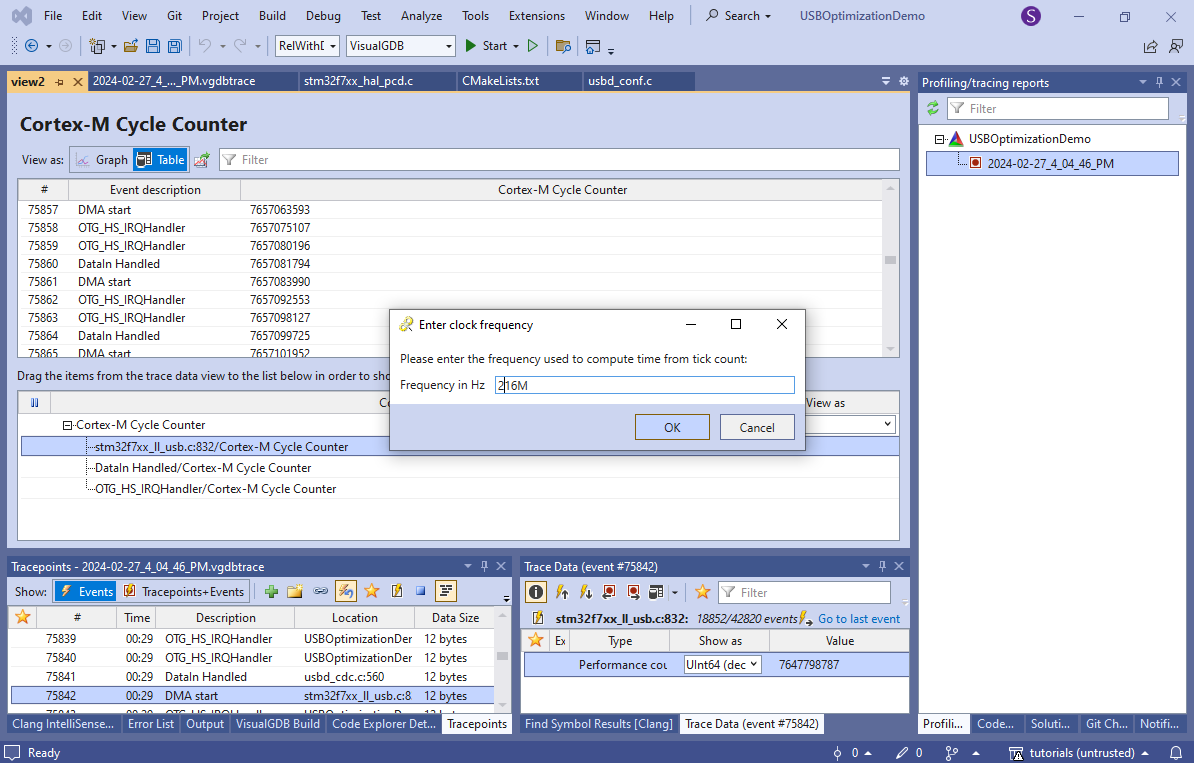
- Enter the frequency of the system clock so that VisualGDB could translate the cycle counts to real time (you can find it out by checking the SystemCoreClock variable):
- Now you will see the exact timing of various parts of the USB loop:
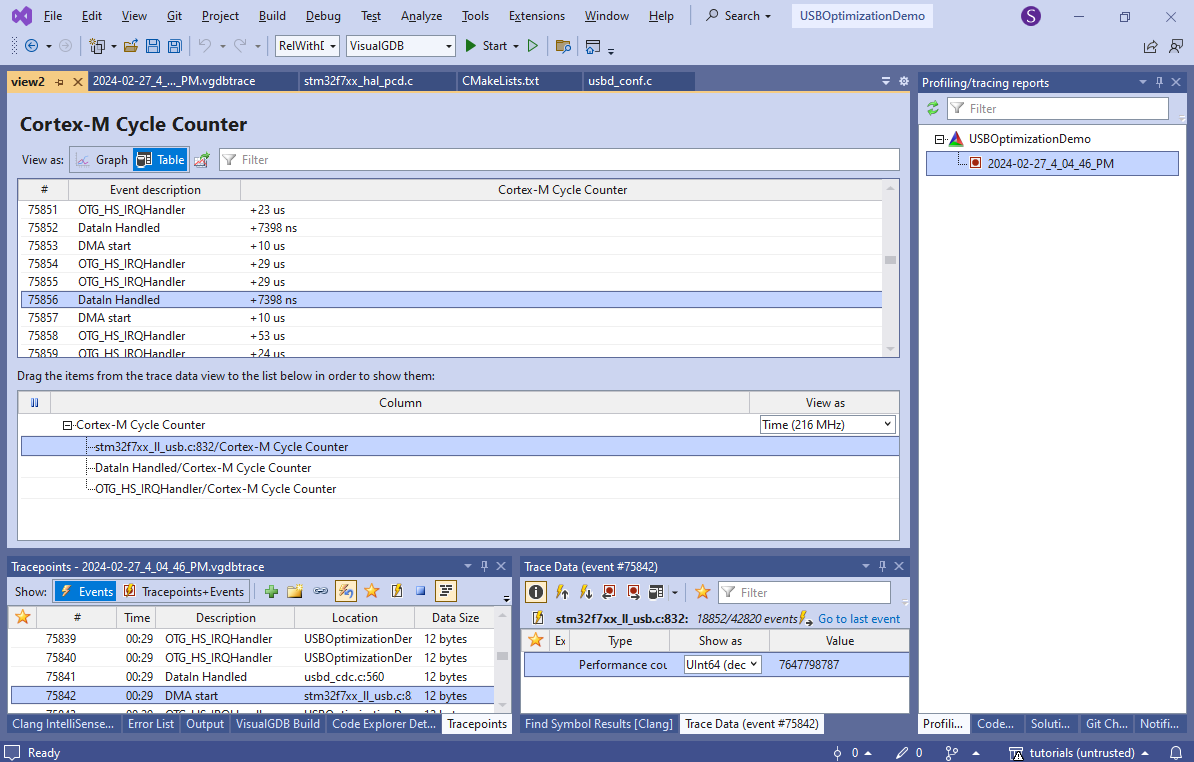
- Note that we are getting two OTG_HS_IRQHandler() calls per packet. This happens because the STM32 CDC implementation sends a zero-length packet after each 512-byte packet to indicate that no further packets are coming for now. We don’t need this while streaming a continuous data set, so we will temporarily disable it by patching the usbd_cdc.c file (note that this file is a part of the STM32 BSP and editing will affect all your STM32 projects. If you don’t want this, convert the project into a stand-alone one before):
- Now throughput increased to 15.2MB/s and the timing looks like this:
- The tracepoint itself takes about 512 clock cycles, or 2.4 uS (you can find it out by tracing a few sequential asm(“nop”) lines), so subtracting the tracepoint overhead, the timing looks like this:
Operation Time Fraction of total period (59.7 uS) Start of DMA -> interrupt 47.6 uS 80% Interrupt -> DataIn reset 4.6 uS 8% DataIn reset -> next DMA start 7.5 uS 12% Note that we are looking at just one sample. In this example (total period of 59.7 uS per 512-byte packet) the throughput would be 16750K * 512 = ~8.5MB/sec, which is way smaller than the recorded 15.2MB/s. In order to get really accurate timing between subsequent events, you would need to average the numbers between 100+ periods:
- Switch the column from Time to Value again
- Export the table to a CSV file
- Open it in Excel and add a formula for computing the difference between events of interest (e.g. compare every 3rd row to the one 3 rows above)
- Filter out too large values (when the events were truncated)
- Compute the average difference over a large enough span of rows
In this example, averaging the period over 126 rows gives 7281 cycles without overhead = 29666 packets/second = 15.19MB/s, that closely matches the measured throughput.
We can also compute the absolute maximum theoretical throughput if the software overhead was completely non-existent by measuring the average time between DMA Start event and the subsequent OTG_HS_IRQHandler(), which averages to about 4639 cycles, or 23.8MB/sec.
- Based on the timing from a single period, the device spends about 80% of the time sending the actual data, and the remaining 20% going through various functions in the USB framework to update various states and decide to send another packet. On average, the software delay builds up to about 37% of the time (1000+1671 out of 7281 clock cycles per period). If you open the Embedded Memory Explorer in the Offline Disassembly mode, and look into any of the STM32 USB handler functions, you can clearly see why:
- A significant portion of the function code involves calls to other functions and saving/restoring various registers:
 Let’s look at an example how this could affect the performance:
- Assume a function called ComputeDistance() calls functions called subtract() and sqrt(). At the time ComputeDistance() is compiled, it doesn’t really know anything about the called functions, so it has to assume they follow the standard ARM calling convention. I.e. they can destroy the contents of the volatile registers (r0-r3) and must preserve the value of non-volatile registers.
- Even if subtract() is very simple and doesn’t actually touch most of the volatile registers, ComputeDistance() must copy them elsewhere before calling it, if it needs the values stored there.
- Similarly, sqrt() doesn’t know that ComputeDistance() doesn’t care about the volatile registers at the point it calls sqrt(), so it must save them into the memory.
If the functions were declared in the same source file, and the compiler chose to inline subtract() and sqrt(), this would not be a problem. However, the ST’s USB functions are split between multiple source files, and inlining doesn’t work for them.
- LTO (link-time optimization) fixes that limitation. It delays the actual code generation until the very last stage (linking) and lets the compiler inline functions between different source files. Add “-flto;-O3” to the additional CFLAGS of the BSP:
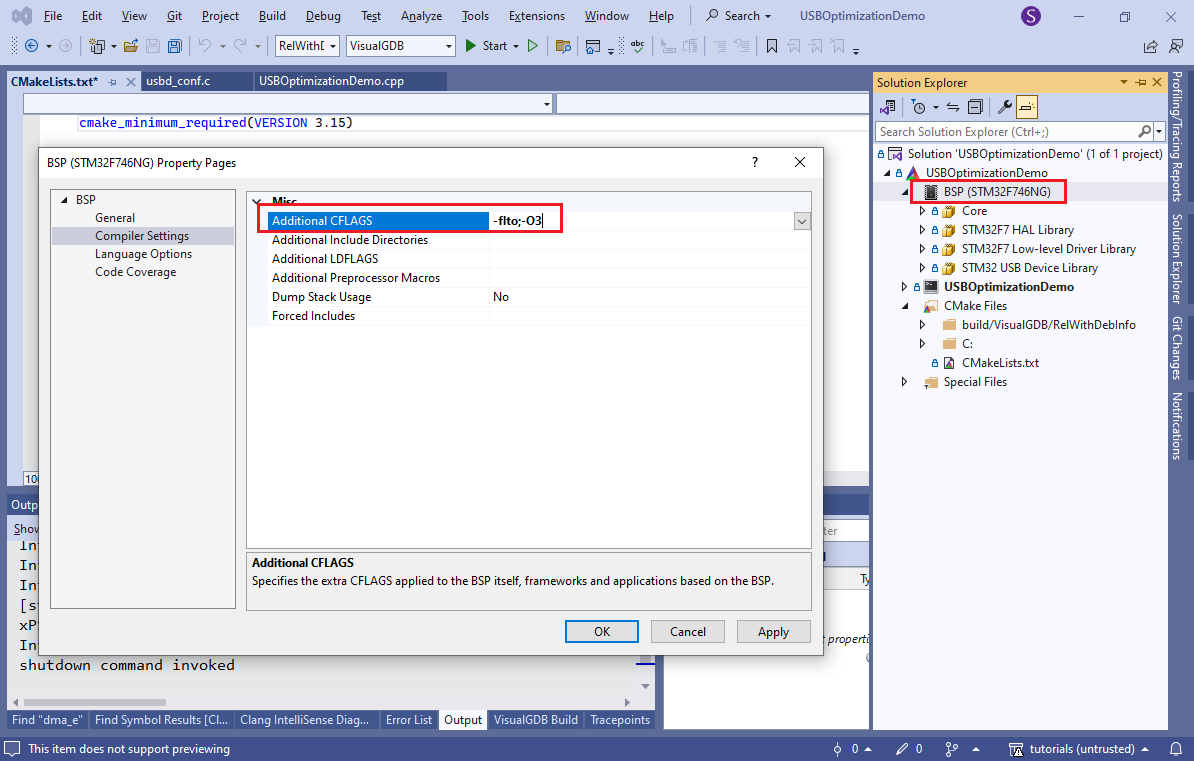 This will automatically inject a bsp_compile_flags() statement into CMakeLists.txt.
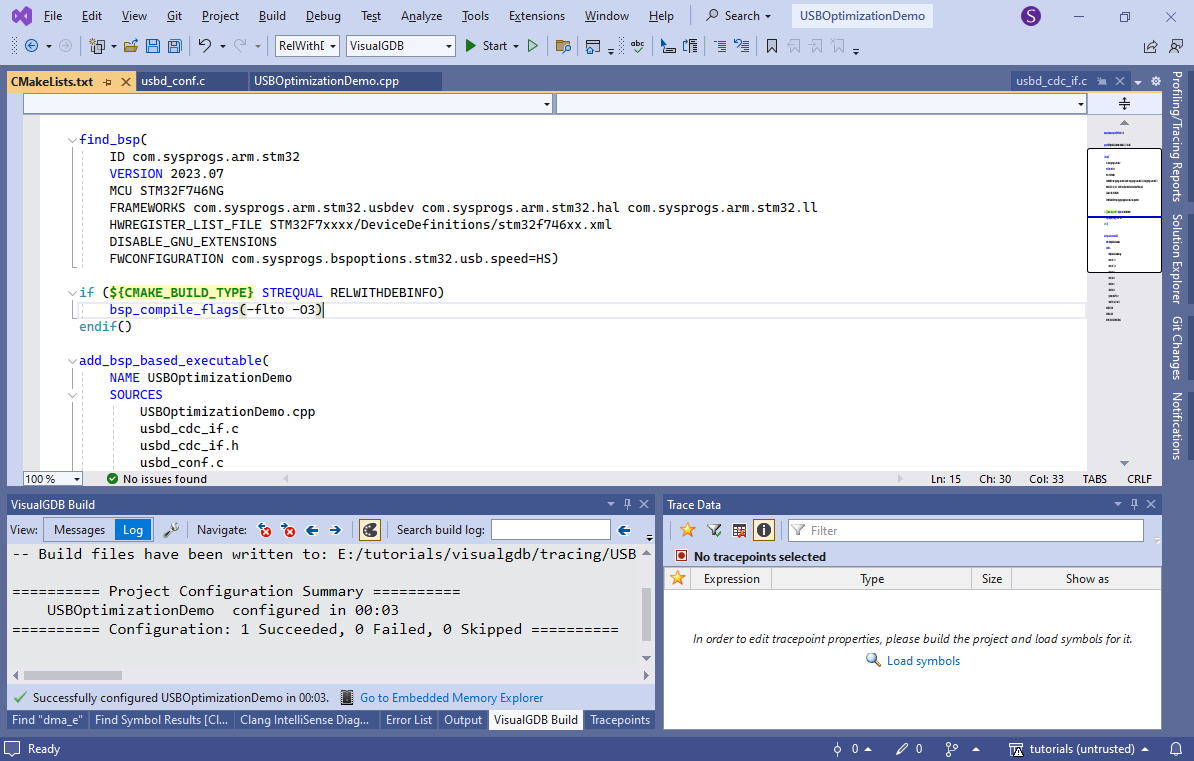
 - LTO will reduce the debuggability of the code (many functions won’t be steppable anymore), so it’s wise to only enable it on release builds. You can do it by adding a condition to CMakeLists.txt as shown below:
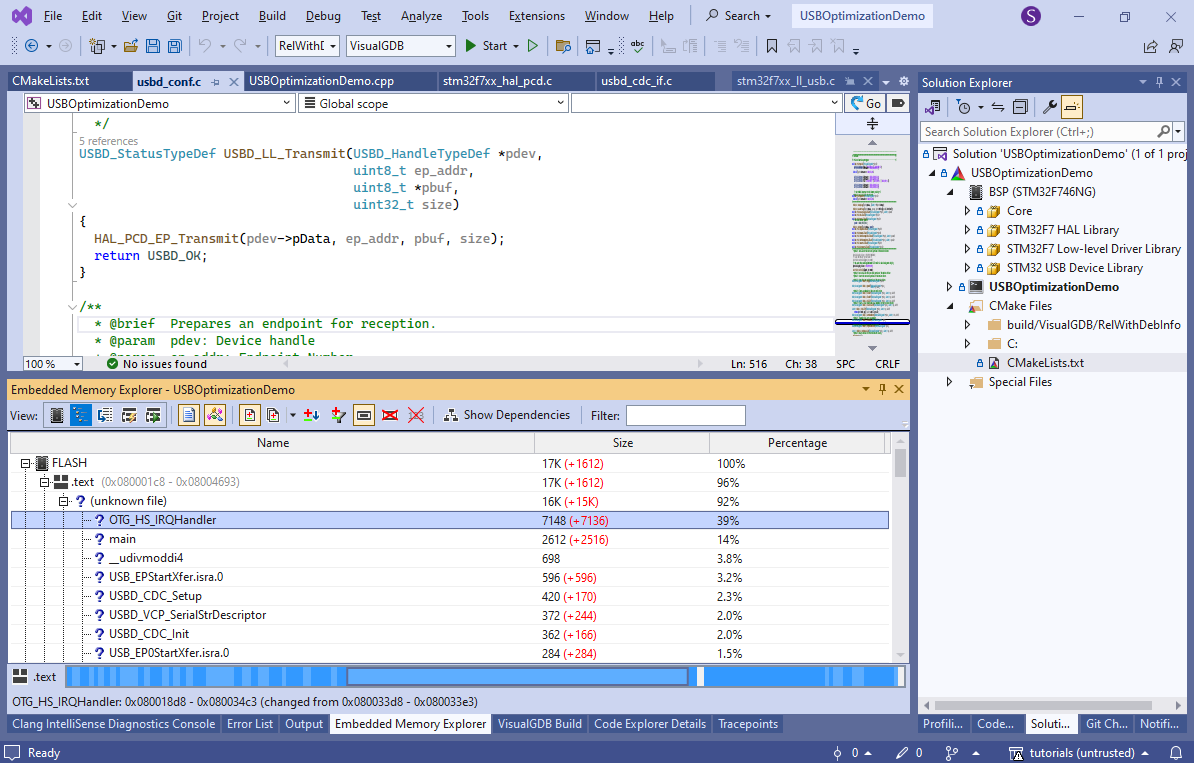
- Build the project and look into the Embedded Memory Explorer. See how most of the interrupt-handling logic got inlined into OTG_HS_IRQHandler(), massively increasing its size:
- If you look at the disassembly, you will see much fewer (if any) calls to other functions:
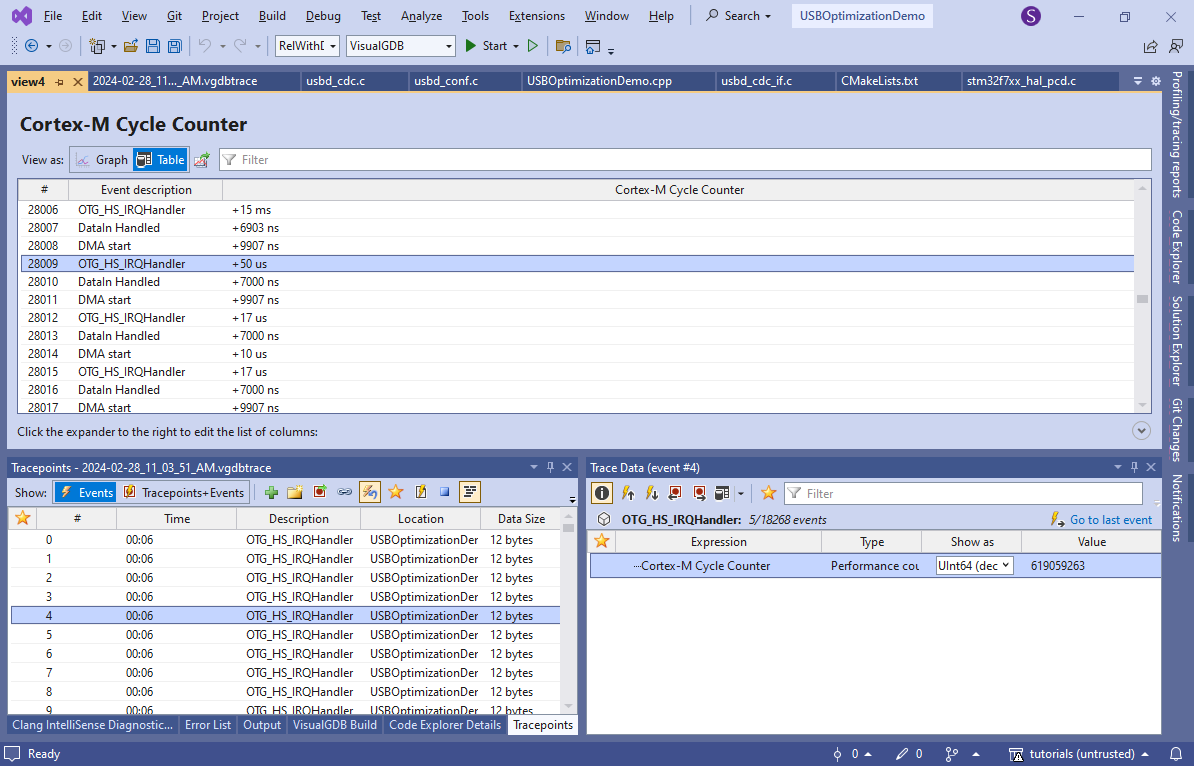
- Run another tracing session to measure the performance:
 Note how the time between the IRQ handler and DataIn Handled reduced considerably, as well as the time between DataIn Handler and DMA Start. The average time of the operations in clock cycles, excluding the tracepoint overhead, are shown below:
Operation Without LTO With LTO IRQ handler to DataIn processing 1001 540 (-46%) DataIn processing to start of DMA transfer 1650 856(-48%) Inlining the USB interrupt handling logic reduced the overall software overhead almost twice.
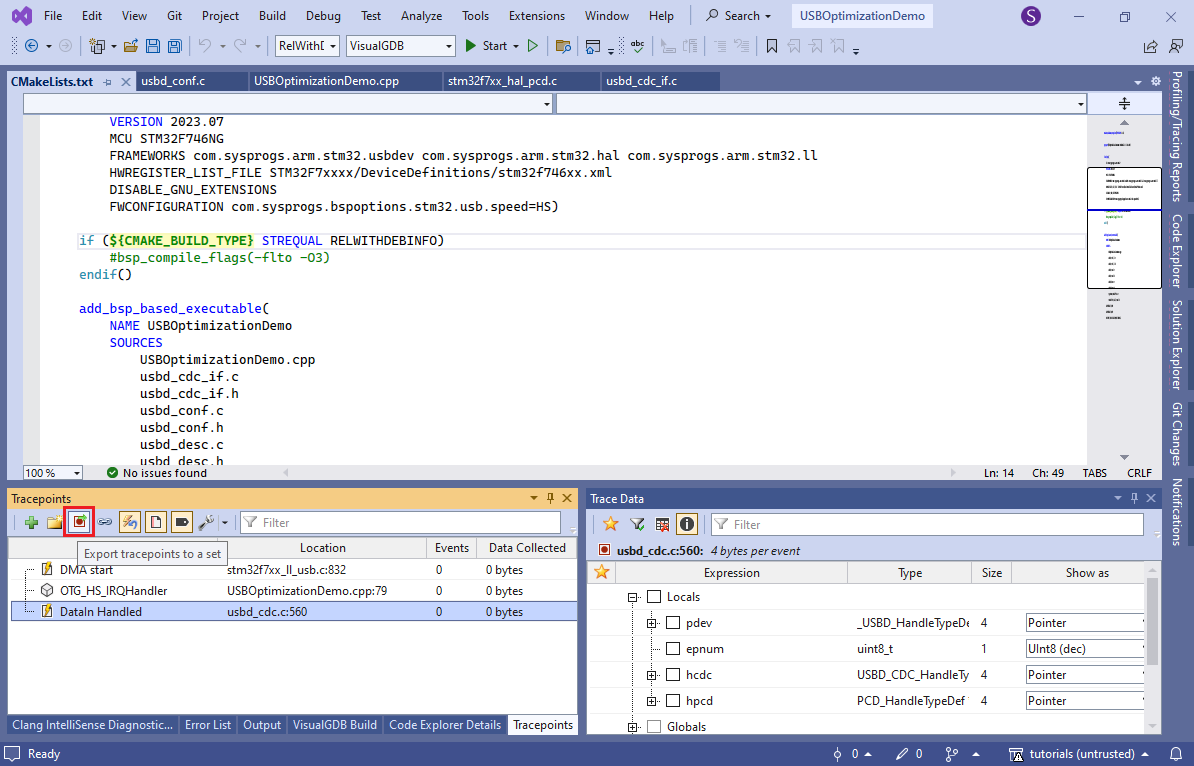
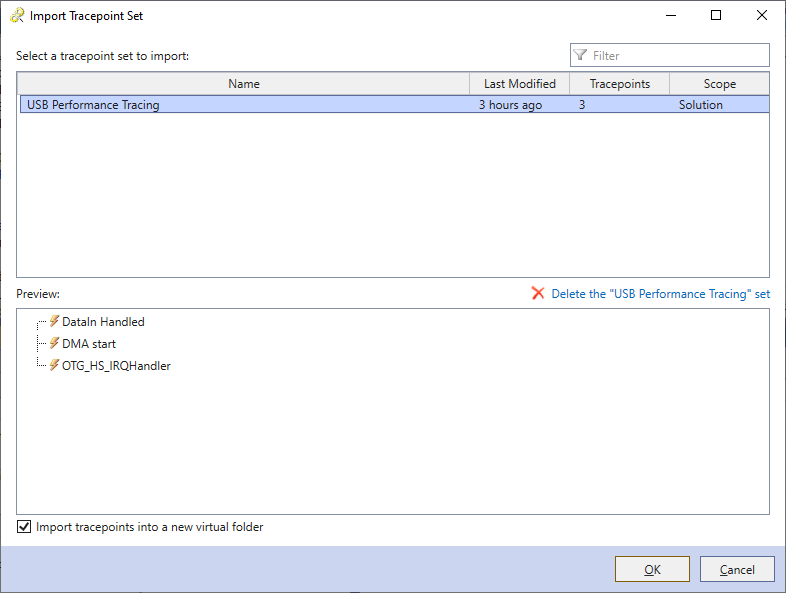
- Once you have done gathering the tracing data, you can export the tracepoints to a reusable set using a context menu command or a button the toolbar:
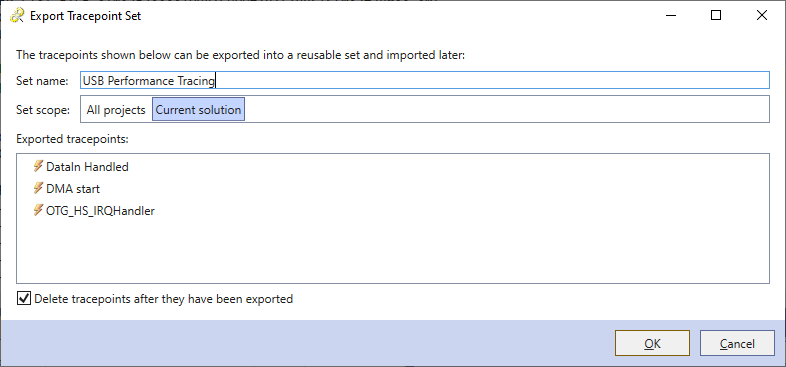
- Enter the name of the set, save it on the solution scope, and ensure the “delete tracepoints” checkbox is checked:
- Now the tracepoint list is empty again, so you won’t lose any performance trying to record every single event:
- You can re-apply previously saved tracepoints via the “import a saved tracepoint set” button to easily re-run the same experiments on a different version of the code:
 Note that although using the LTO reduced the interrupt handling overhead almost twice, it only increased the throughput by about 3% (15.2MB/s to 15.7 MB/s), suggesting that the USB hardware has an internal packet queue, so reducing interrupt handling delays further will not bring much performance increase. The good news is that it has considerably reduced the CPU utilization by the USB stack, as we will now demonstrate.
 - Add the following code to the usb_cdc_if.c file:
static volatile long g_IdleCounter;

void __attribute__((noinline)) benchmark()
{
    g_IdleCounter++;
}
Then, modify the wait loop in VCP_write() to repeatedly call benchmark() while it is waiting for the USB interface to become ready.
while (pCDC->TxState) { benchmark(); } - You can now start another debugging session (without tracepoints), use Live Watch to plot the value of g_IdleCounter and see how fast it changes by selecting a subrange of it:
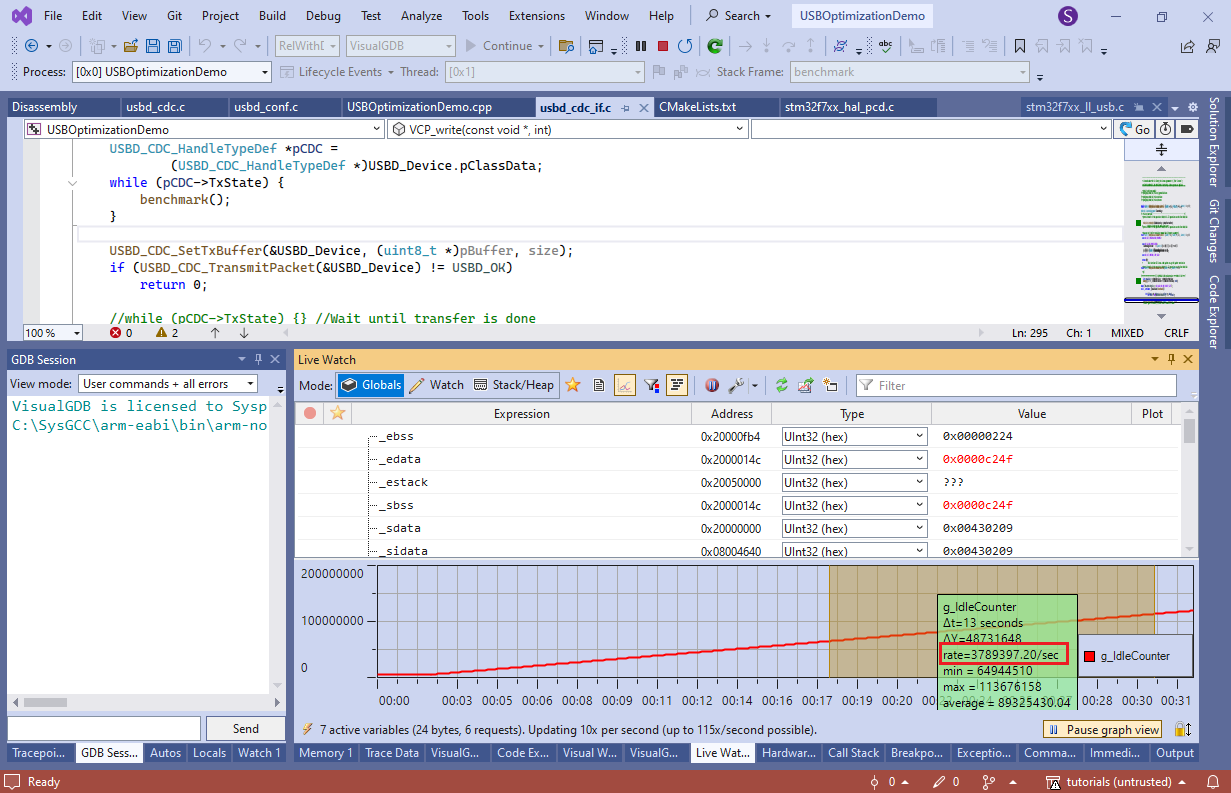 Live Watch works by sampling the memory in the background and does not introduce any overhead, so the number of times benchmark() got called is proportional to the amount of meaningful work the CPU could otherwise do. Marking benchmark() with __attribute__((noinline)) ensures that it won’t get affected by LTO.
In our experiments, the rate without any USB load was 3.7M iterations/second, the rate without LTO was 2.46M/sec (CPU utilization of 35%), and enabling LTO raised the rate to 3.1M/second (17% utilization).
Conclusion
The table below summarizes different optimization techniques applied to the STM32 USB driver on STM32F7-Discovery and their effect on the throughput and CPU utilization with 512-byte packets:
| Variant | Throughput | CPU utilization |
| Debug build | 4.2 MB/s | Not measured |
| Release build | 7.7 MB/s | 60% |
| Enabled DMA | 9.1 MB/s (+18%) | 47% |
| Disabled ZLPs | 15.2 MB/s (+67%) | 35% |
| Enabled LTO | 15.7 MB/s (+3%) | 17% |