Recording NRFConnect GATT operations with Software Tracing
This tutorial shows how to use the Software Tracing feature to record the Bluetooth LE attribute reads/writes processed by the nRFConnect SDK.
Due to the way the NRF52 chip works, stopping it on a classical breakpoint would make it stop handling the Bluetooth LE packets and would ultimately trigger a watchdog reset. Software Tracing on the other hand, is not affected by it: tracepoints run directly on the target with minimal overhead, store the captured data in a circular memory buffer, and let the NRF52 hardware continue working while the debugger is reading out and analyzing the stored trace events.
We will create a basic project using the Nordic LED and Button Service (LBS), will use the nRFConnect App to write the LED attribute and read the button attribute, and will then configure tracepoints to record these events without interrupting the program.
Before you begin, install VisualGDB 6.0 or later.
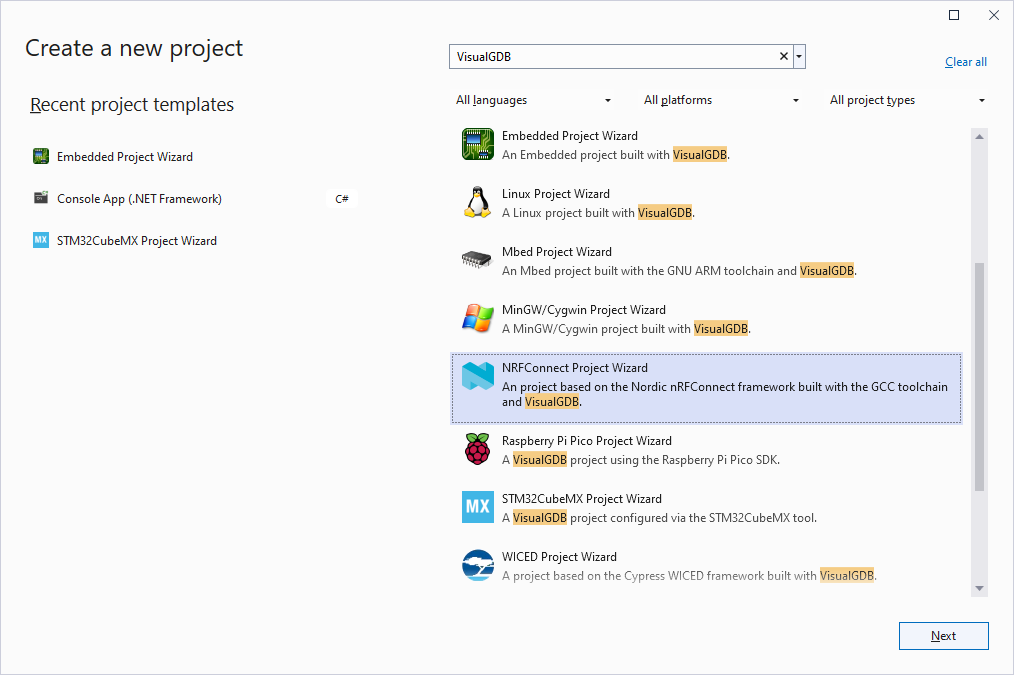
- Start Visual Studio and open the VisualGDB nRFConnect Project Wizard:
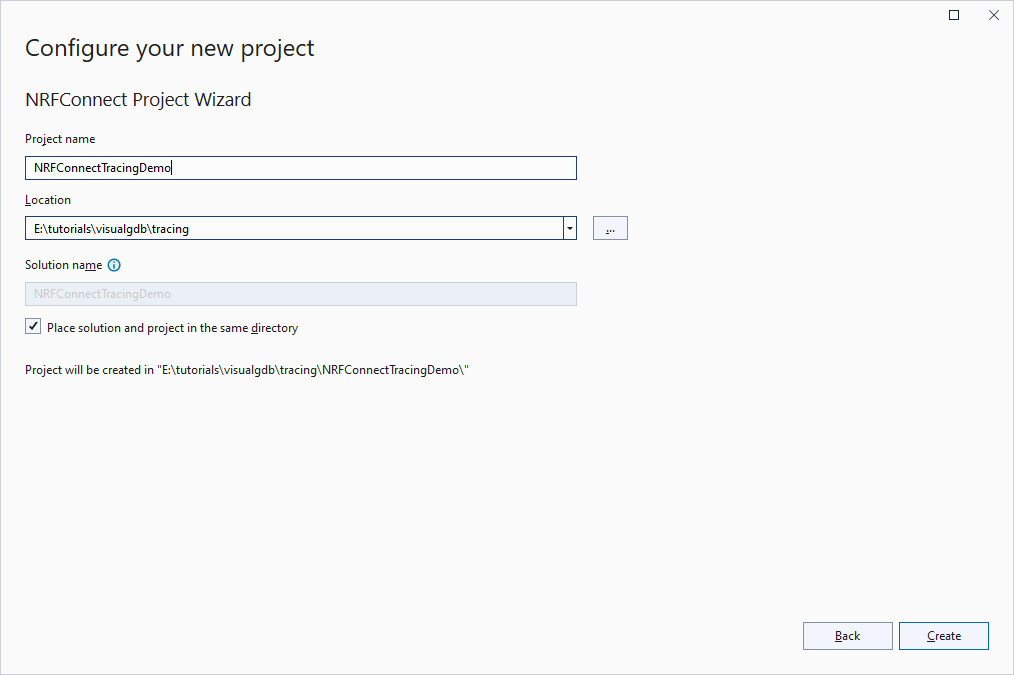
- Enter the name and location for your project:
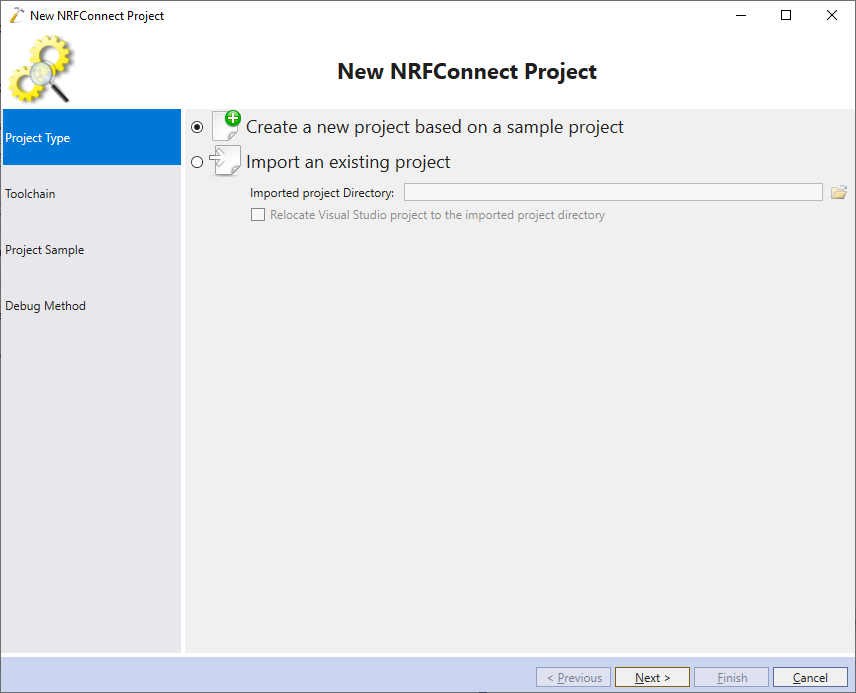
- Proceed with creating a new project based on one of the SDK samples:
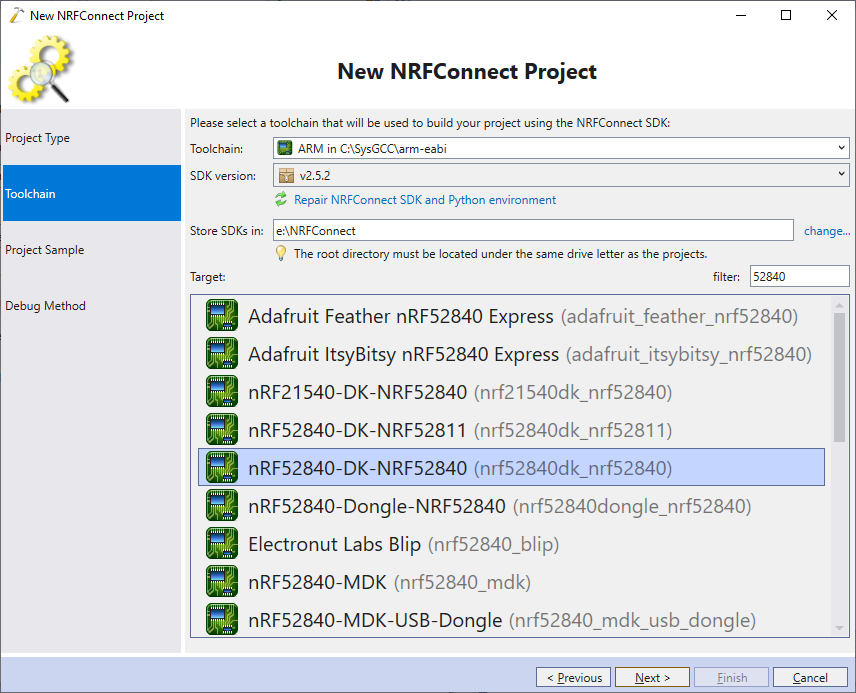
- Select the latest ARM toolchain, install the nRFConnect SDK if you have not done it already, and pick your board in the target list:
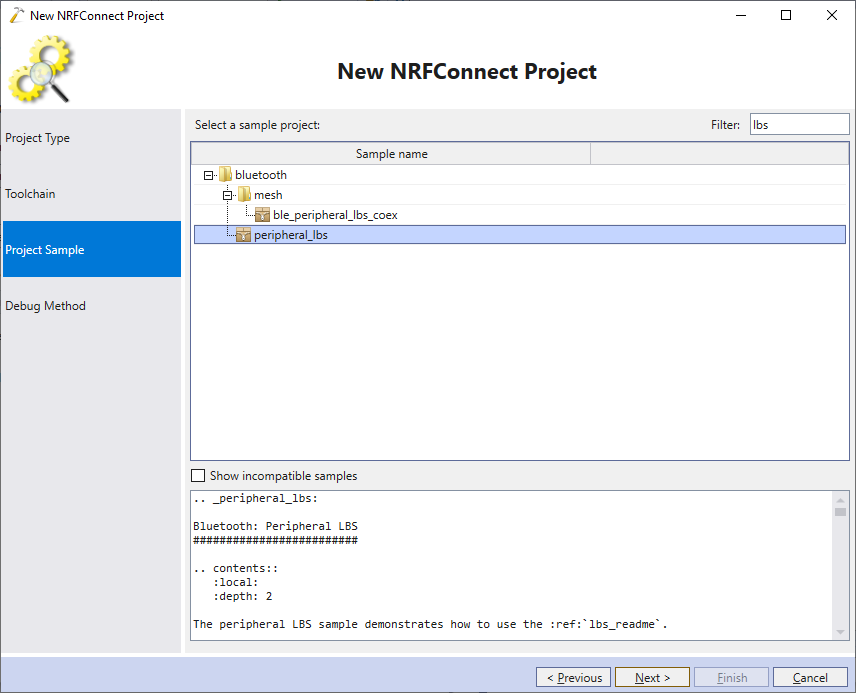
- Locate and select the peripheral_lbs example:
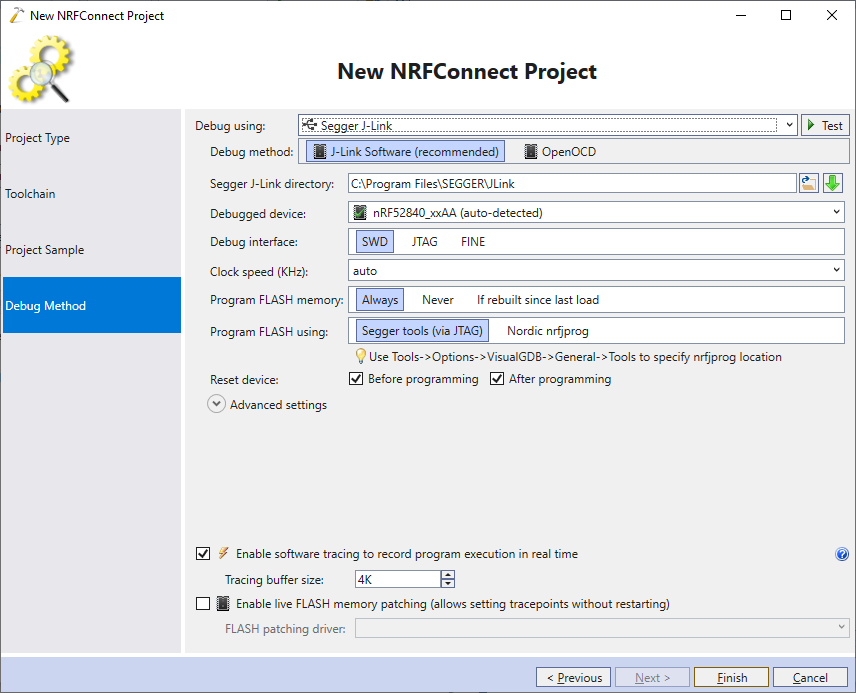
- Finally, connect your board to the USB port and let VisualGDB detect the debugger configuration:
- Press”Finish” to create the project. Once it is created, locate the callback function for the LED attribute (app_led_cb) and set a regular breakpoint in it:
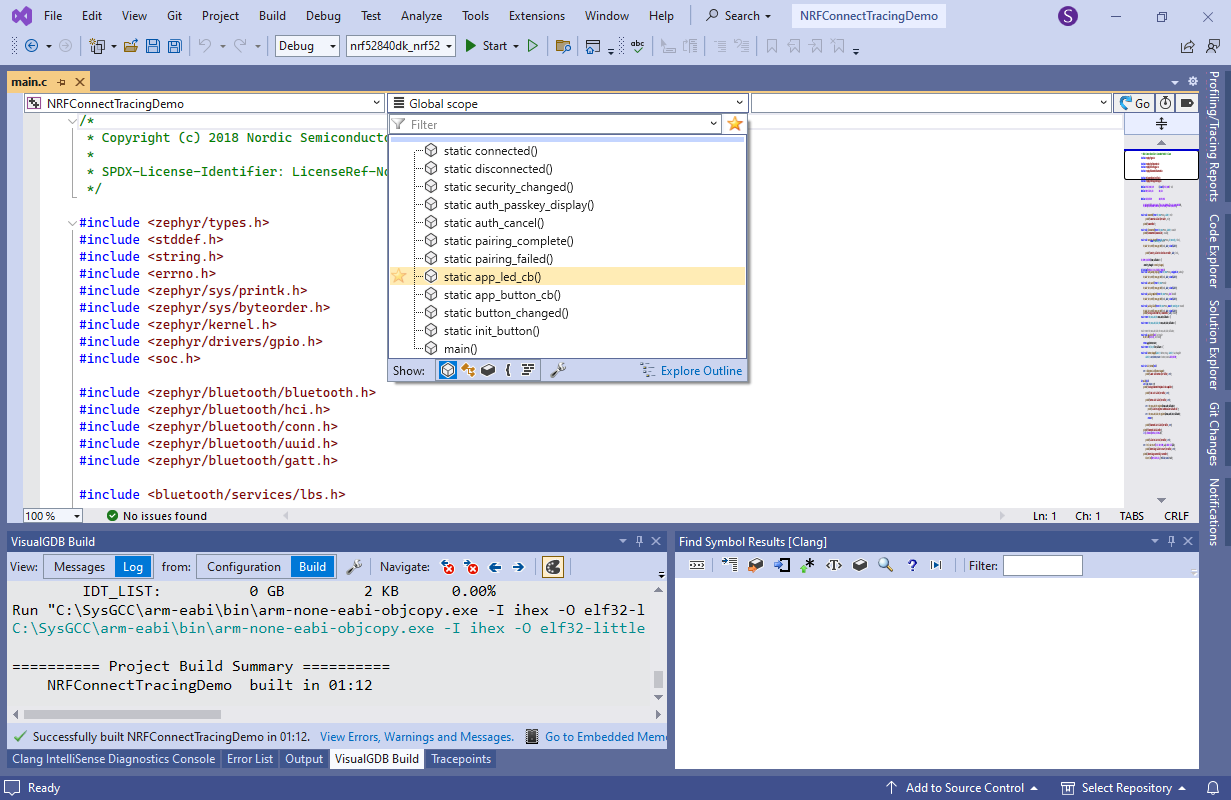 Note that the breakpoint will disrupt the program flow, so we only use it to find the place where to put a non-disruptive tracepoint.
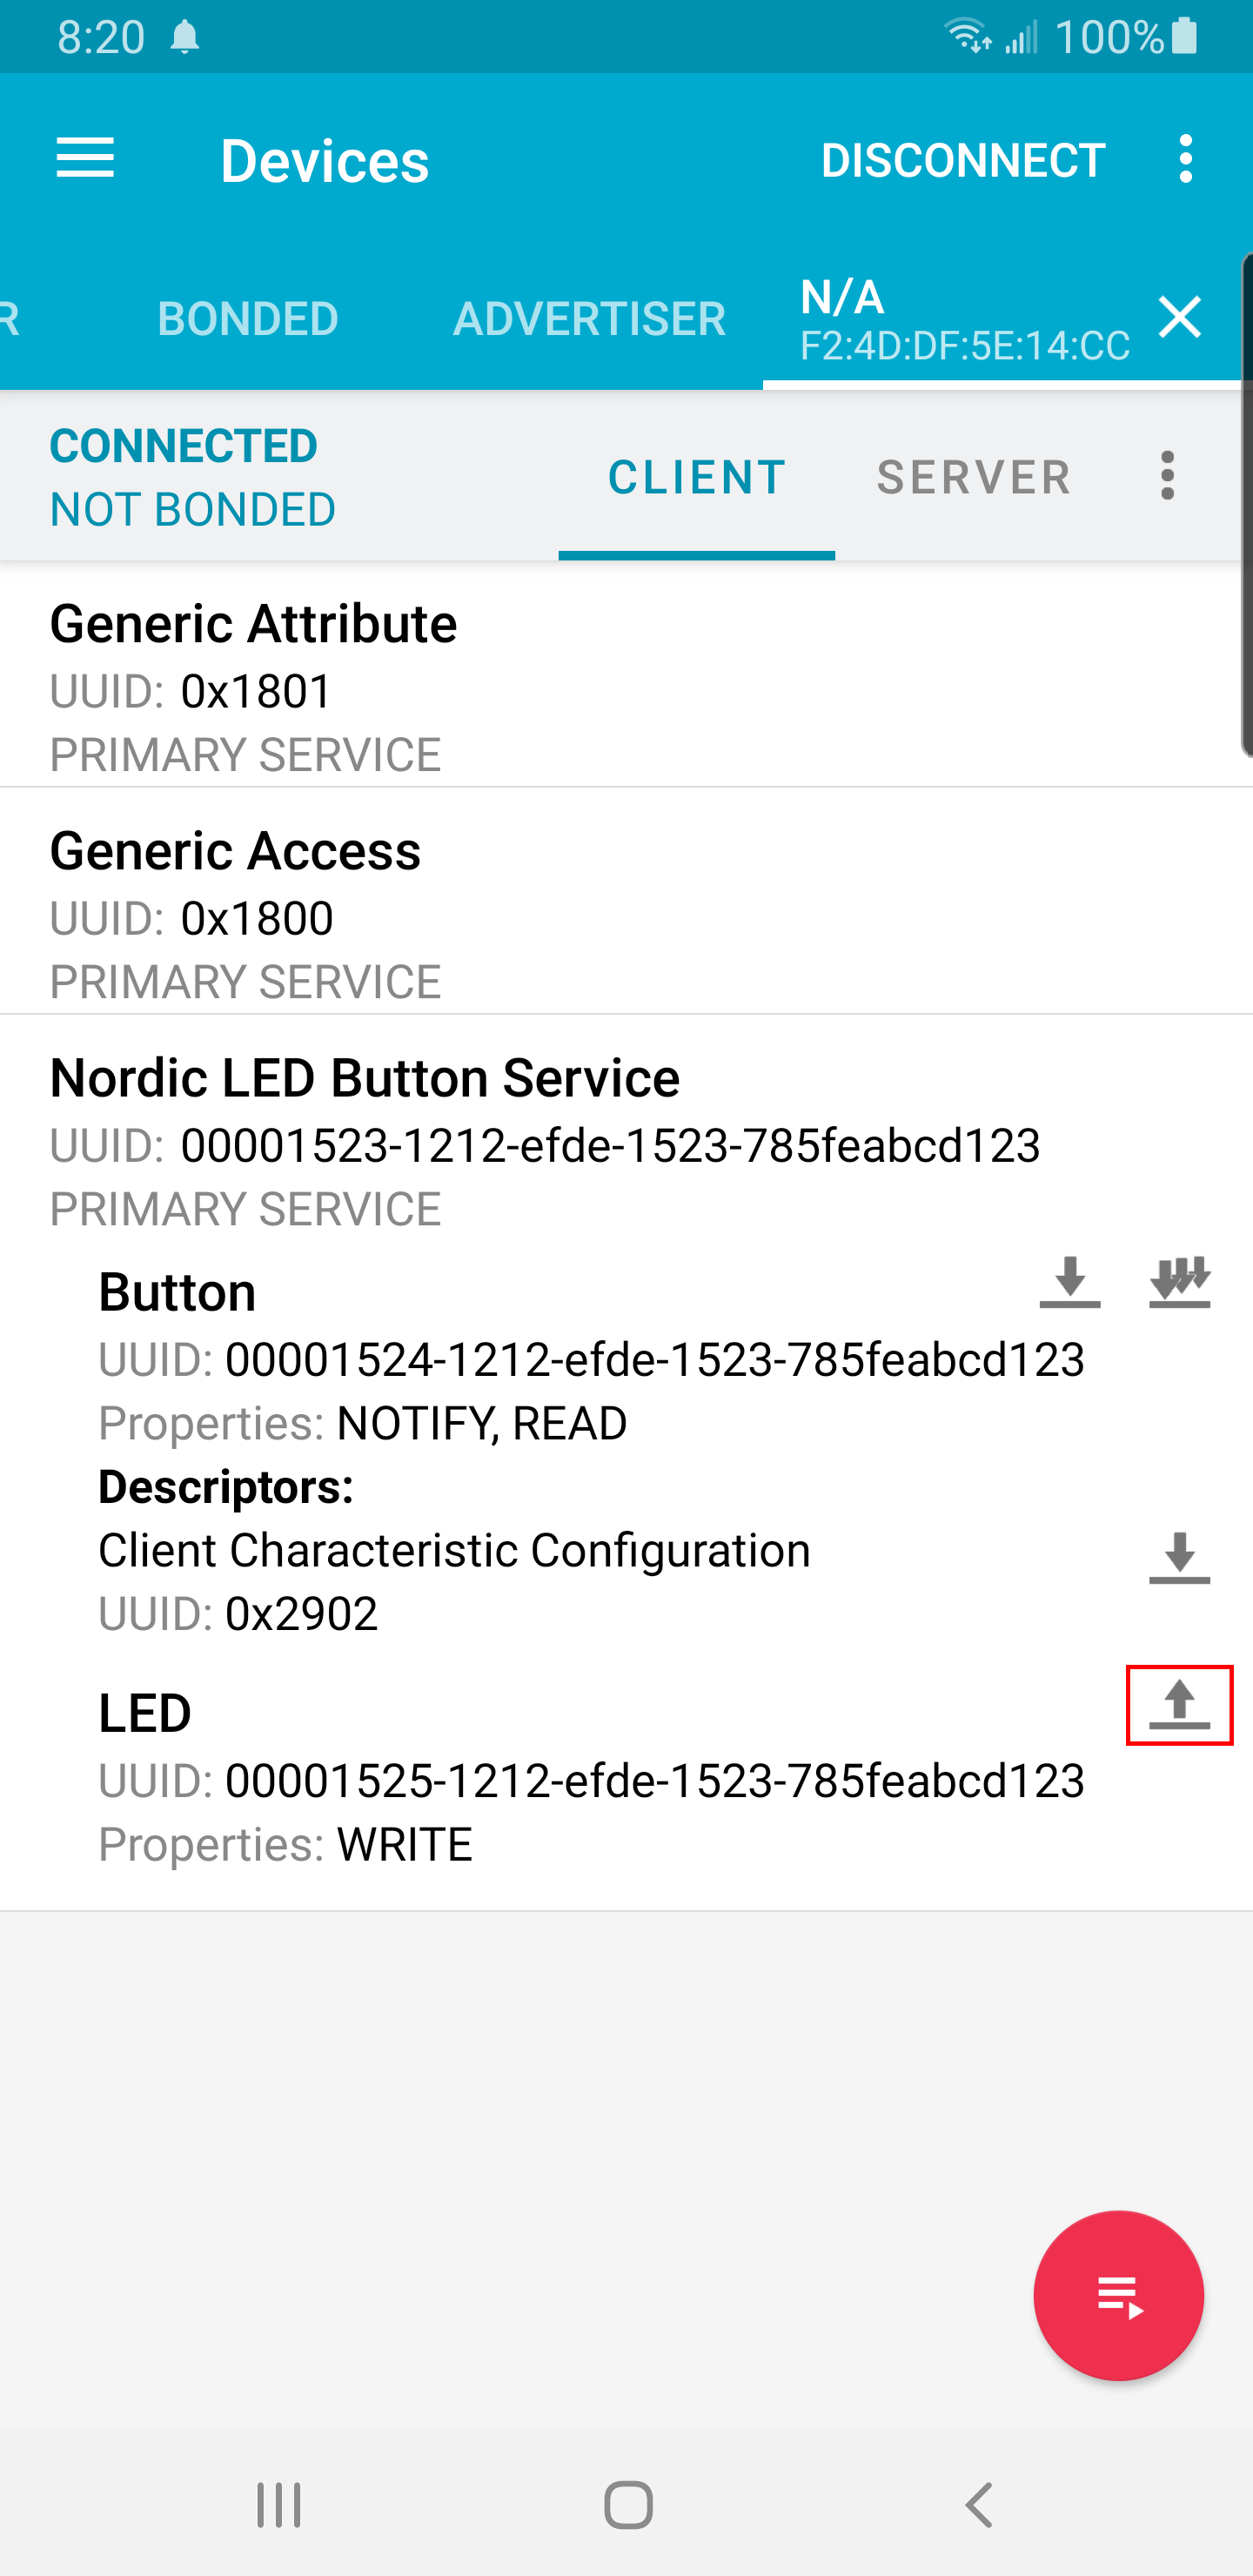
 - Build and run the project. Then, open the nRFConnect app on your phone, locate the board there and try writing the LED attribute:
- The breakpoint will trigger. Use the Call Stack window to see how the callback was invoked by the write_cb() function in attr.c:
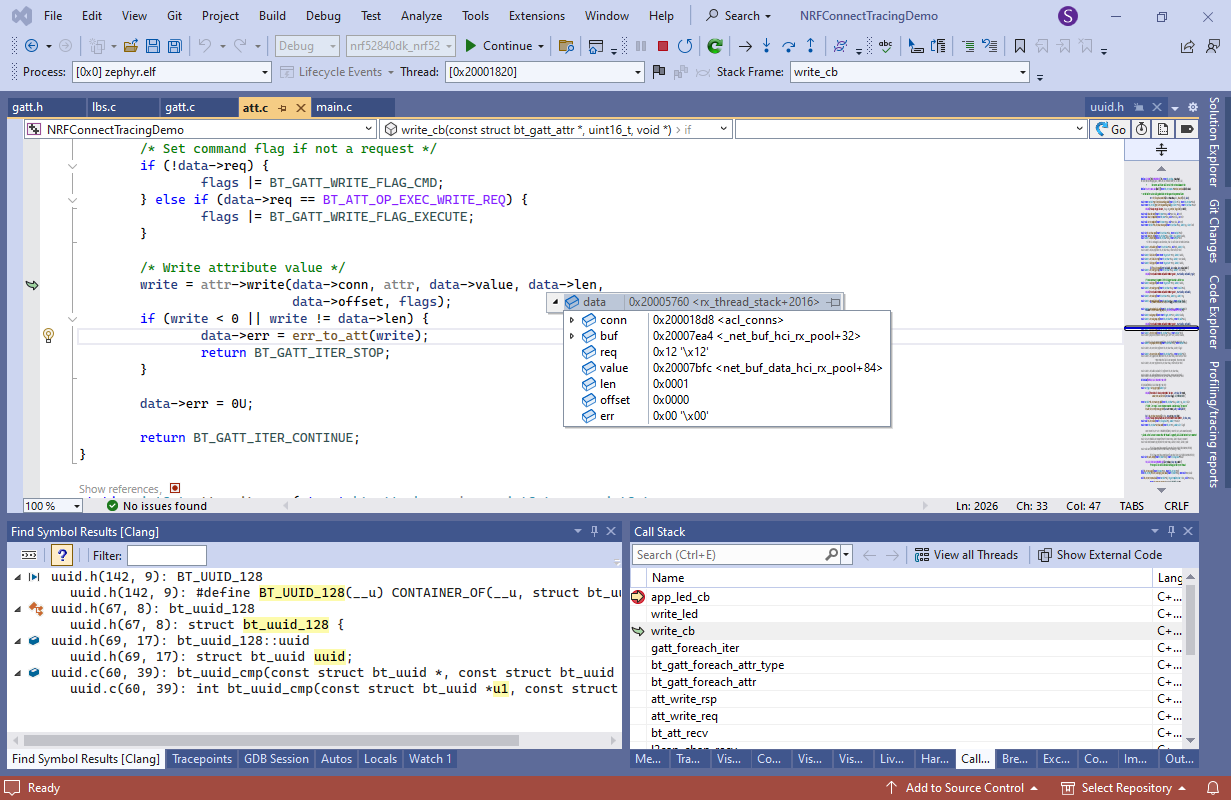 The line calling attr->write() is a perfect place to put a tracepoint recording all attribute writes.
 - Open VisualGDB Project Properties and go to the Software Tracing page. Ensure it is switched to the Advanced view and check the “do not attempt to patch any code once debugging has started” checkbox:
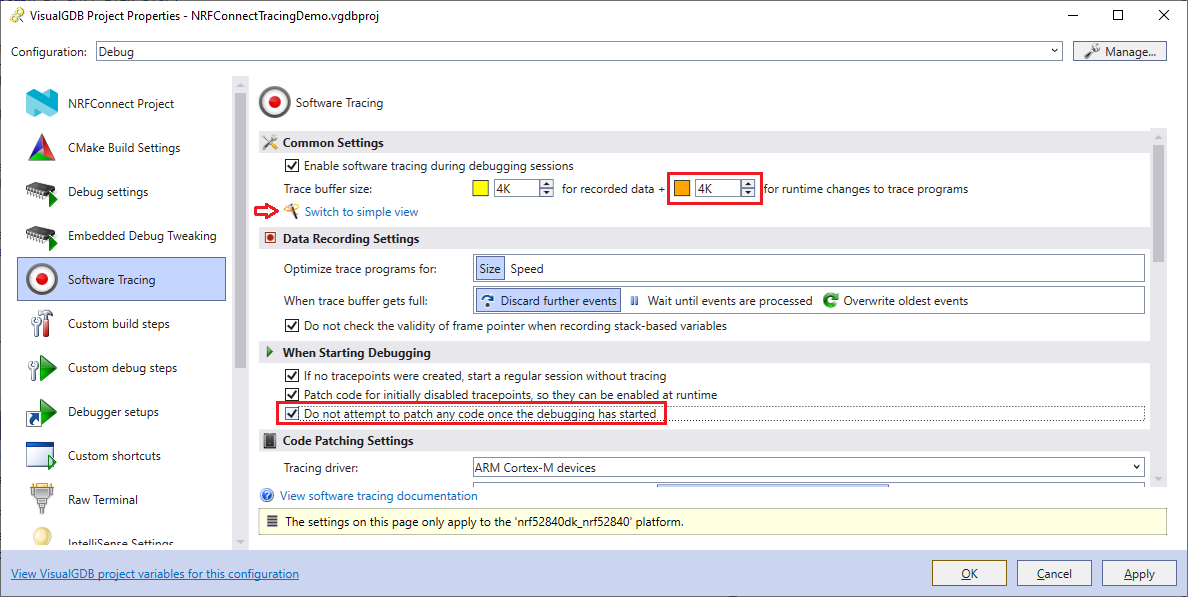 This allows enabling, disabling and editing the tracepoints without stopping the target (and causing a watchdog reset).
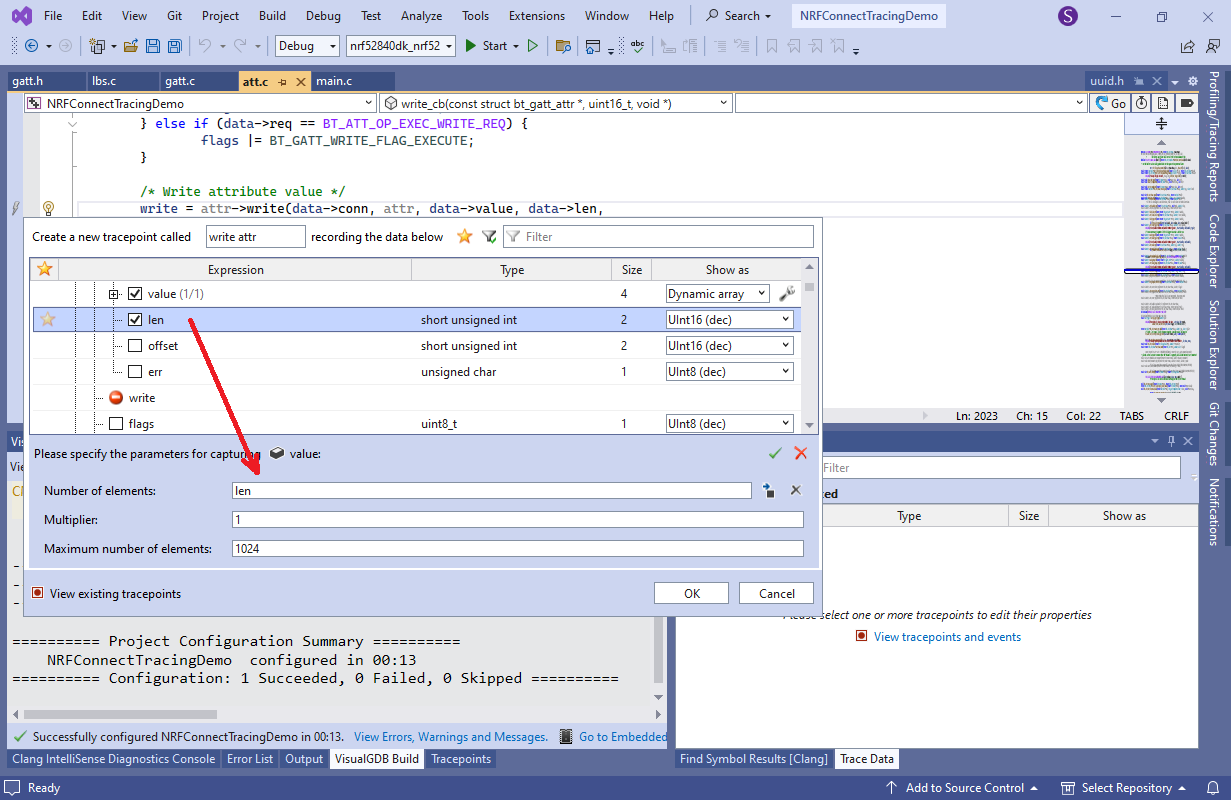
 - Click to the left from line calling attr->write() to create a new tracepoint. Then, configure it to trace data->value as a dynamic array and drag len into the “number of elements” field:
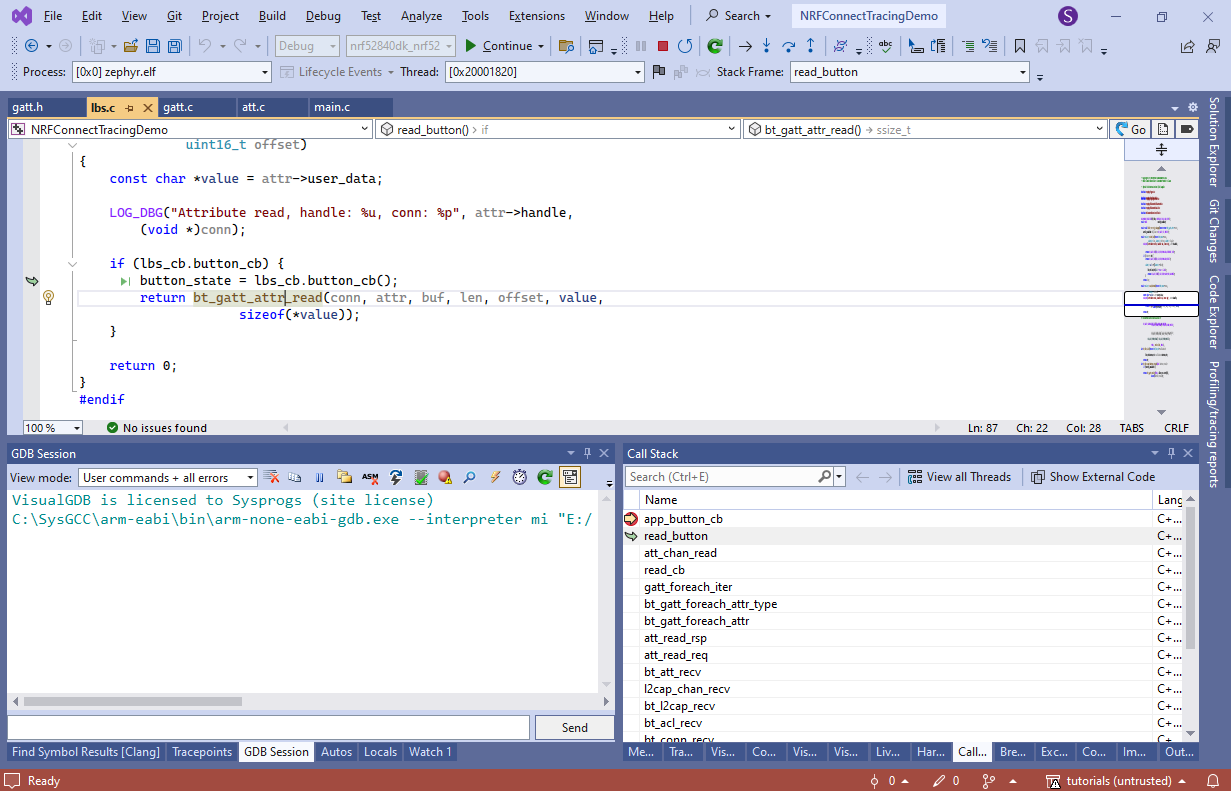
- If you set another breakpoint in the function reading the button value (app_button_cb()), you can see how it’s called by read_button() and then the value returned by it is passed to bt_gatt_attr_read():
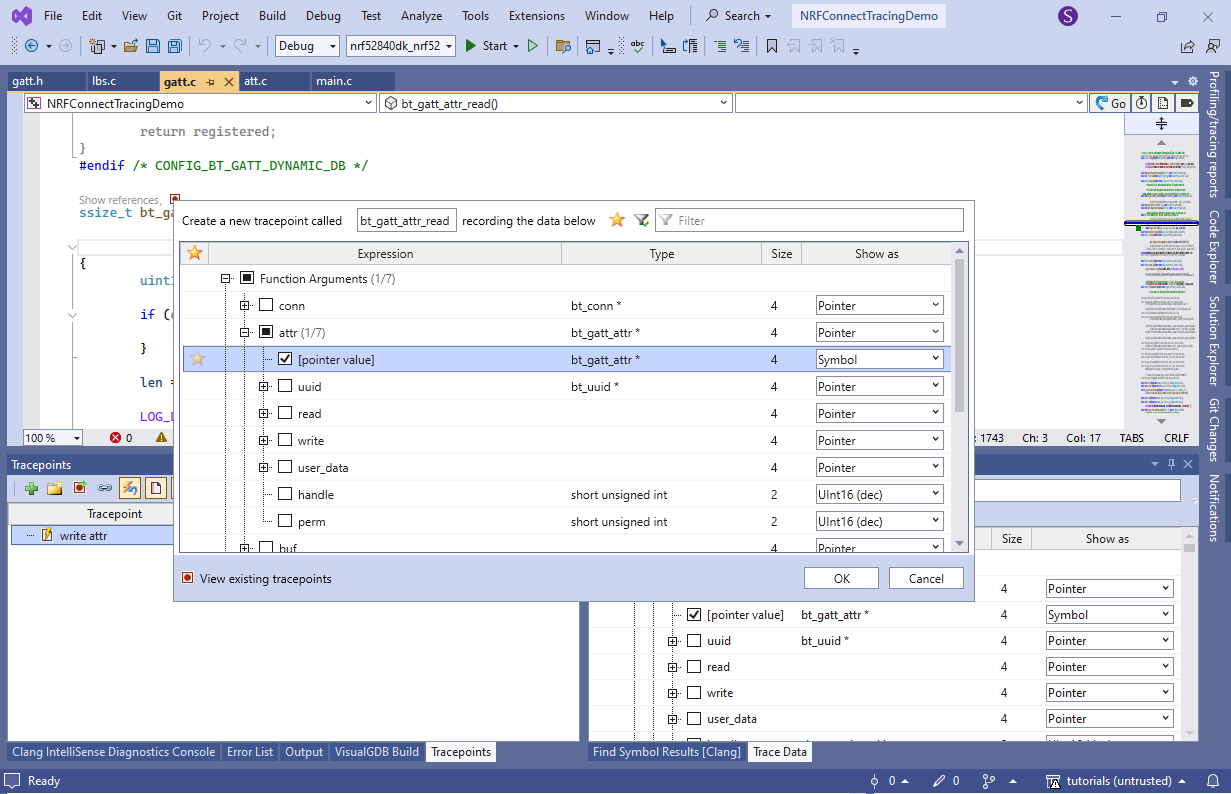
- Add another tracepoint in bt_gatt_attr_read(). Configure it to trace attr->pointer value as a symbol:
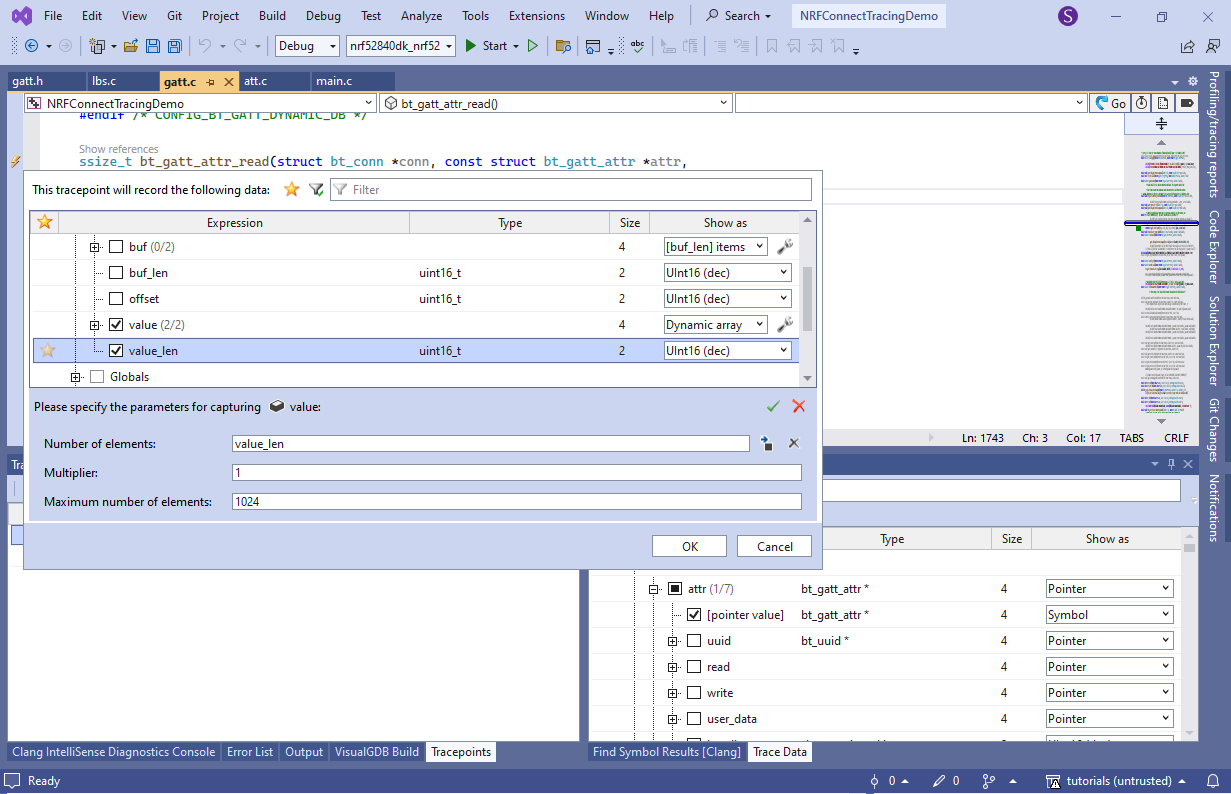
- Also enable tracing of value as a dynamic array of value_len elements:
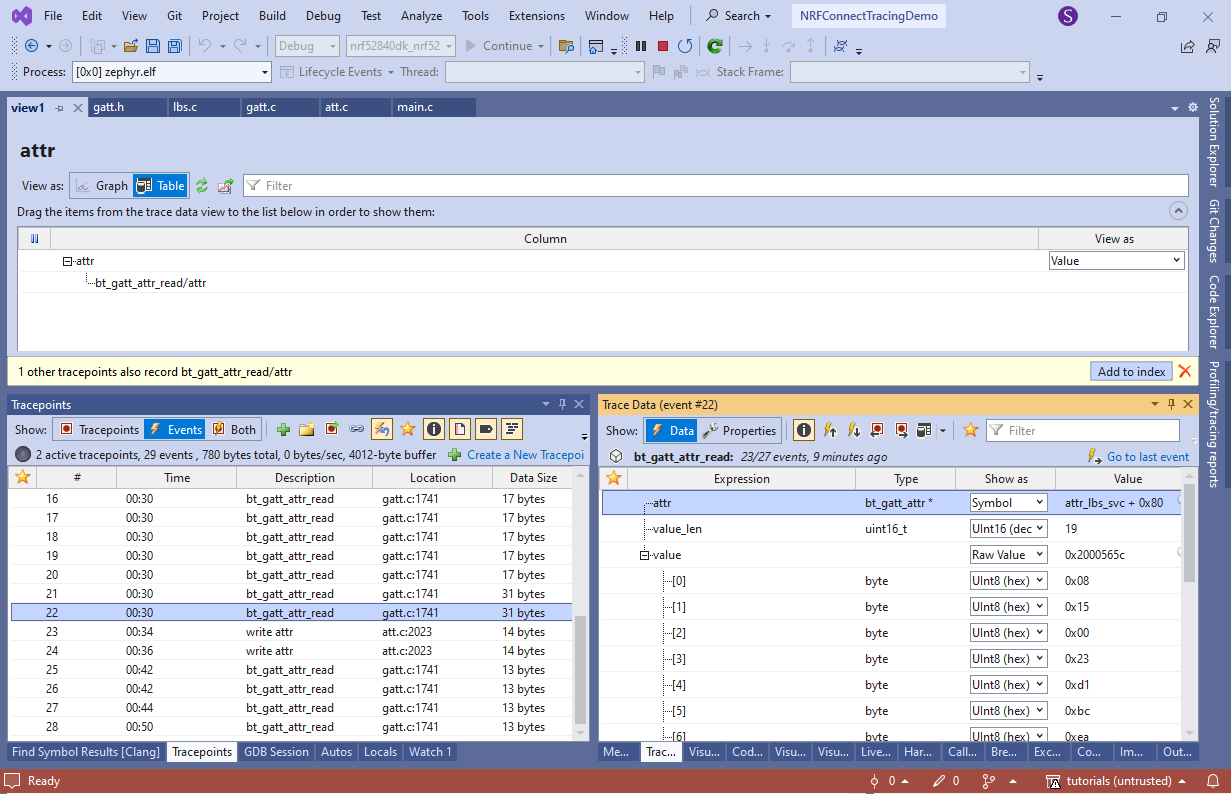
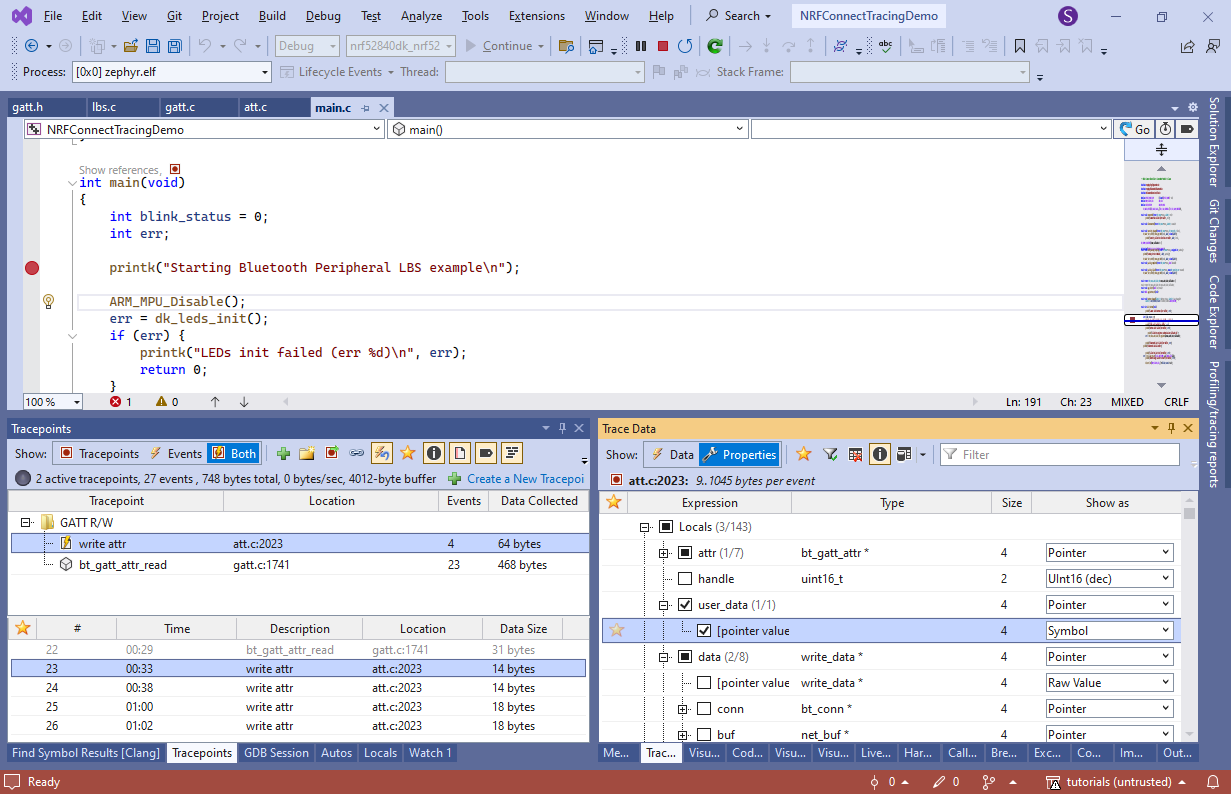
- Now you can remove the breakpoints and start another debug session. Every attribute read or written by the program will now generate an event in the Tracepoints window. You can walk through the events to see the captured data (attribute, data length, and the actual payload):
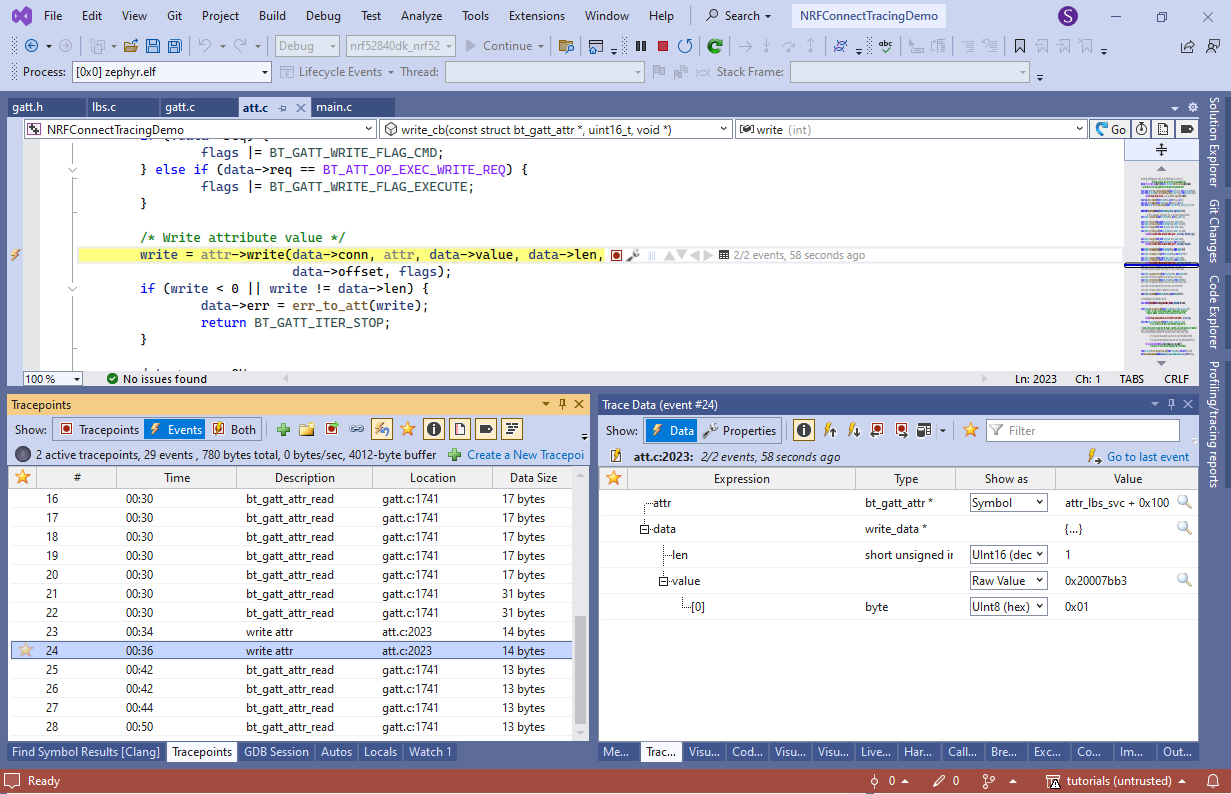 Capturing the address of attr and matching it to the offset inside the definition of the LBS service is faster than recording the GUID of each attribute. The variable addresses may change from version to version, however the offset of each attribute within attr_lbs_svc will remain constant, as long as its layout remains the same.
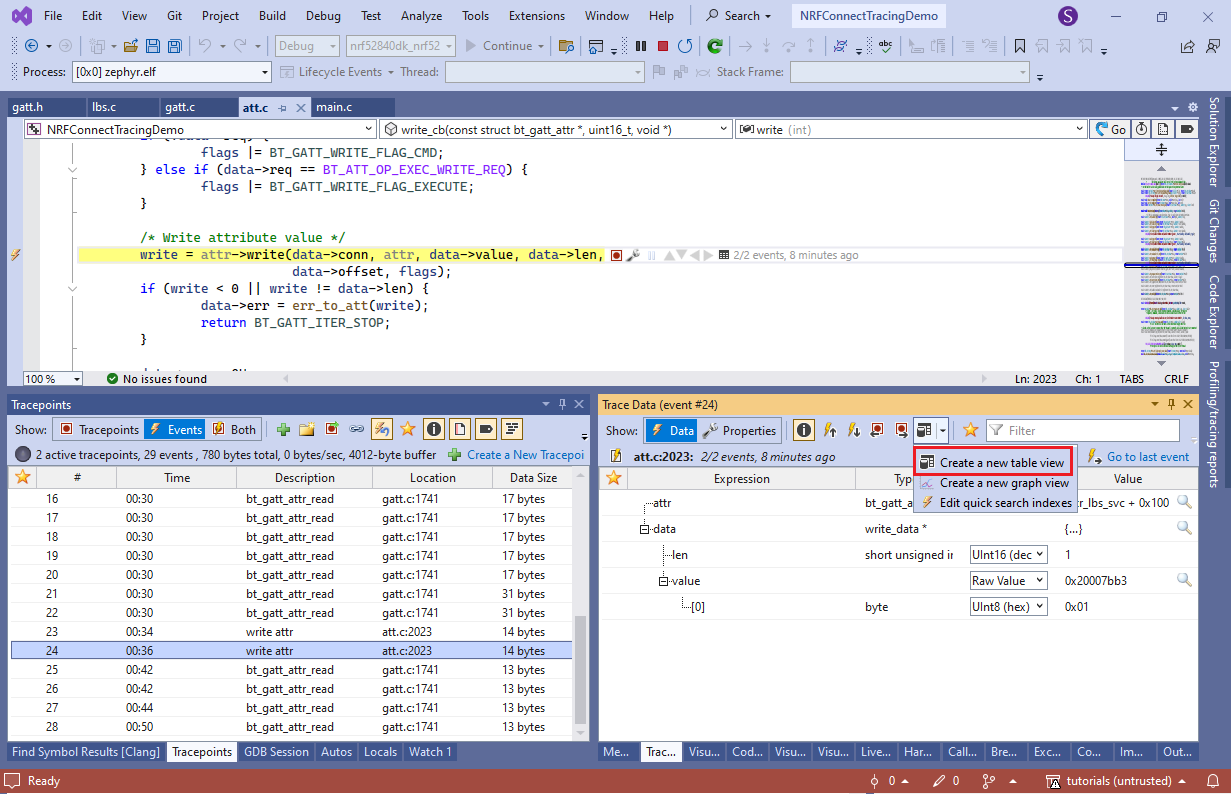
 - Create a new table view from the popup menu in the Trace Data window:
- Drag the attr and value[0] into separate columns:
- VisualGDB will show a table view summarizing the recorded read and write operations:
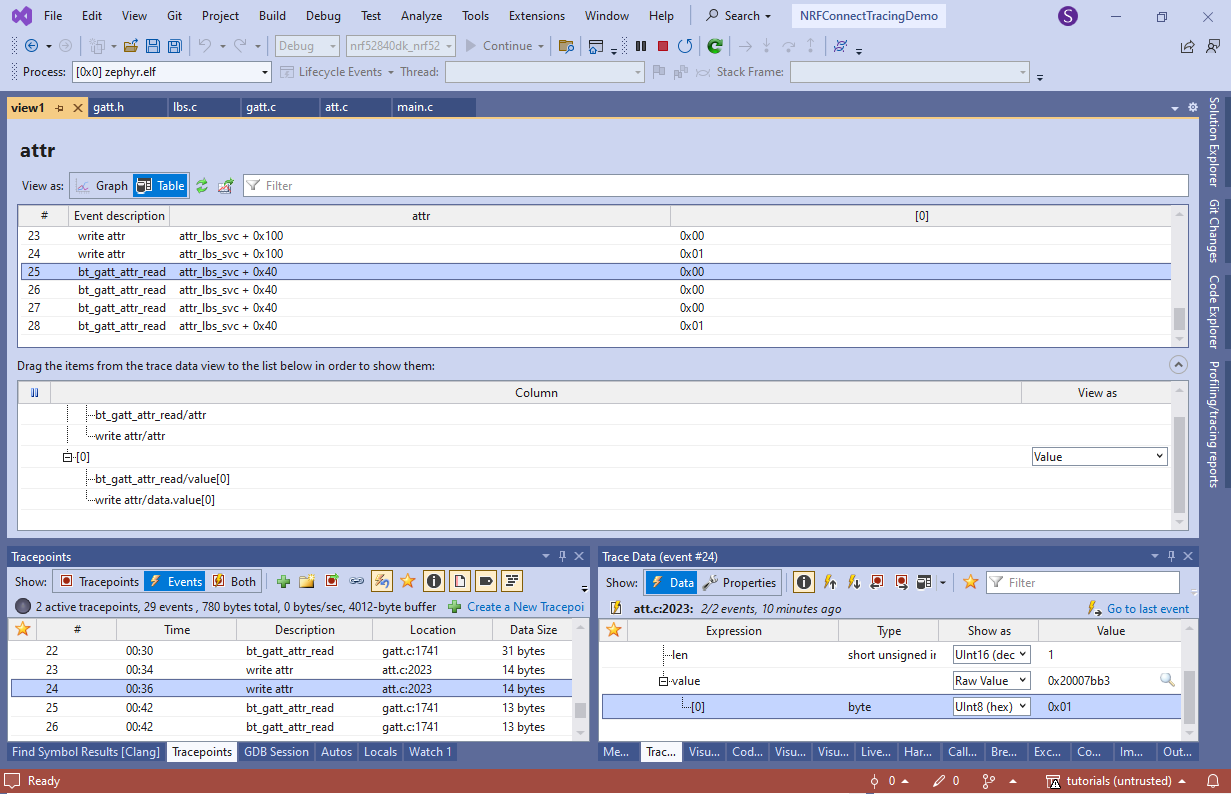 In this example, we wrote 0, then 1 into the LED, and then queried the button state 4 times, out of which the last one returned 1.
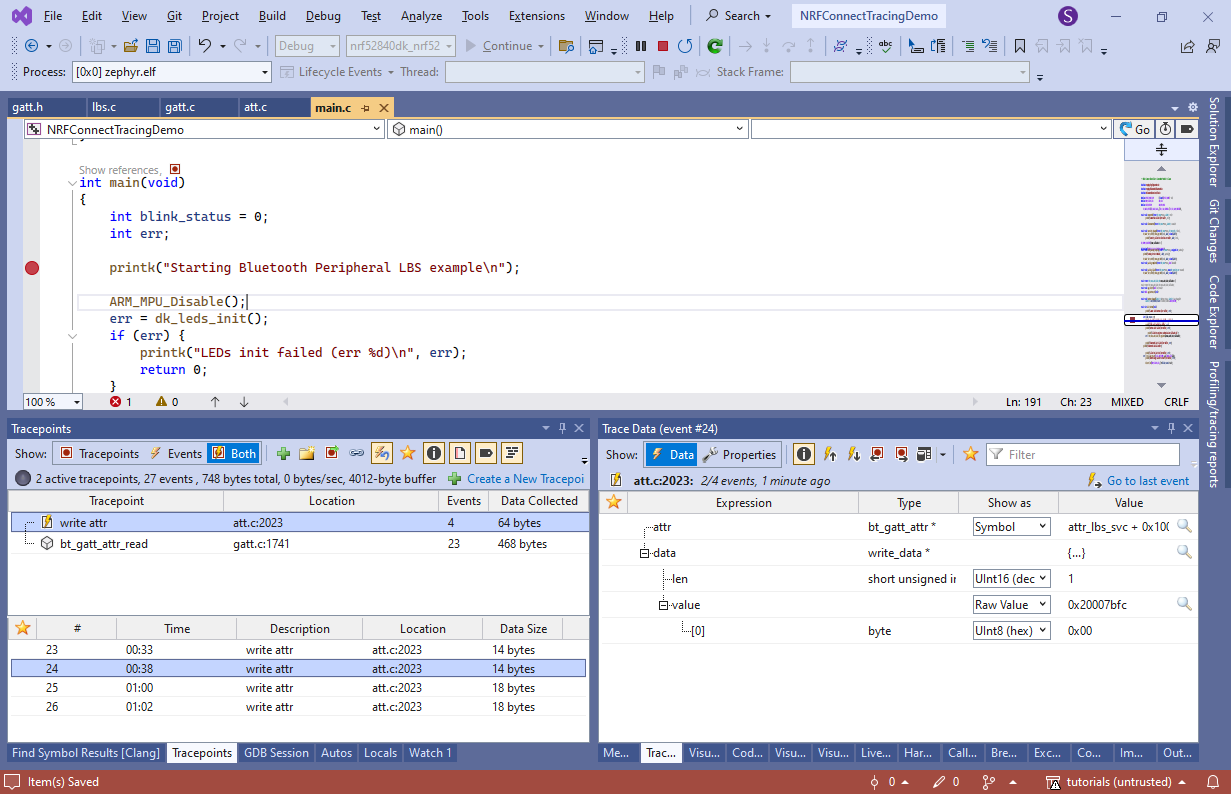
 - Although setting new tracepoints requires patching the code (and hence triggering the watchdog), you can enable/disable existing tracepoints, or change what they record, in a completely non-intrusive way. In order to do that, call the ARM_MPU_Disable() function from main() or change the MPU configuration to explicitly allow running code from RAM:
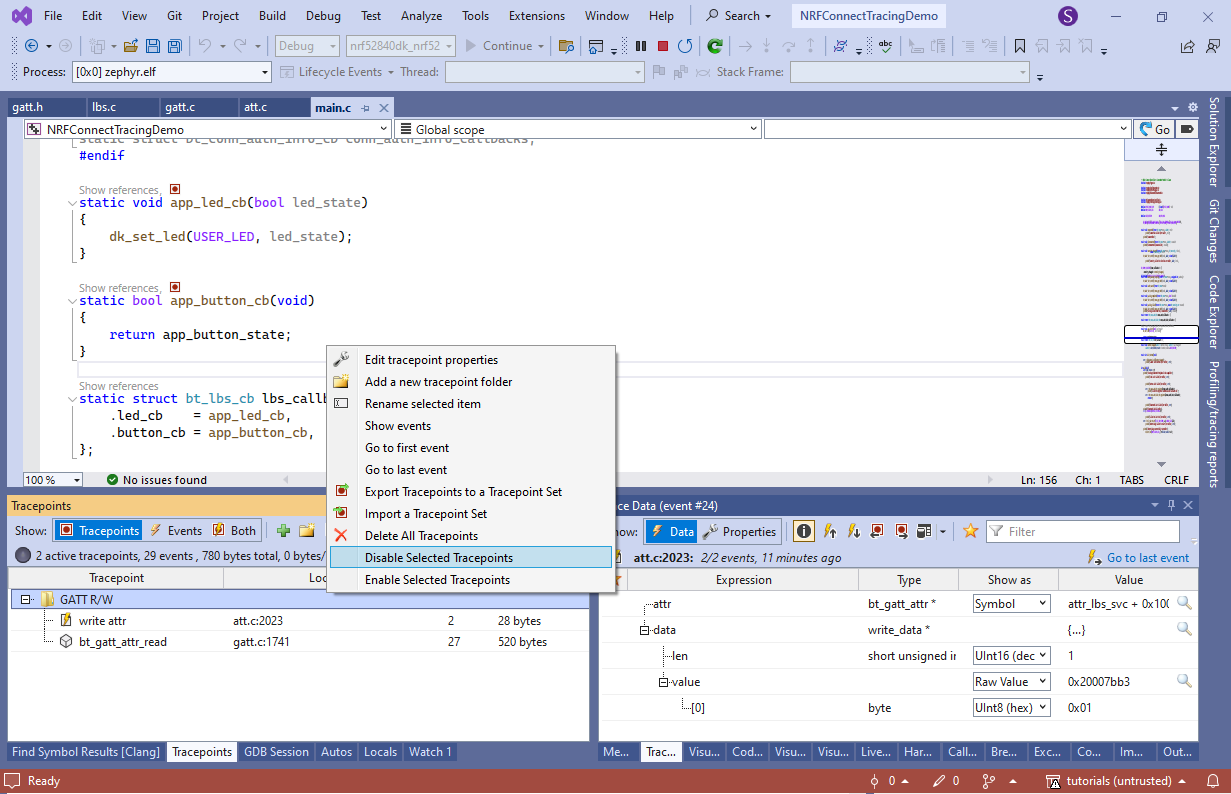
- Create a new tracepoint folder called “GATT R/W” and move the tracepoints there. Now you can enable/disable them both by right-clicking on the folder and selecting “Disable selected tracepoints”:
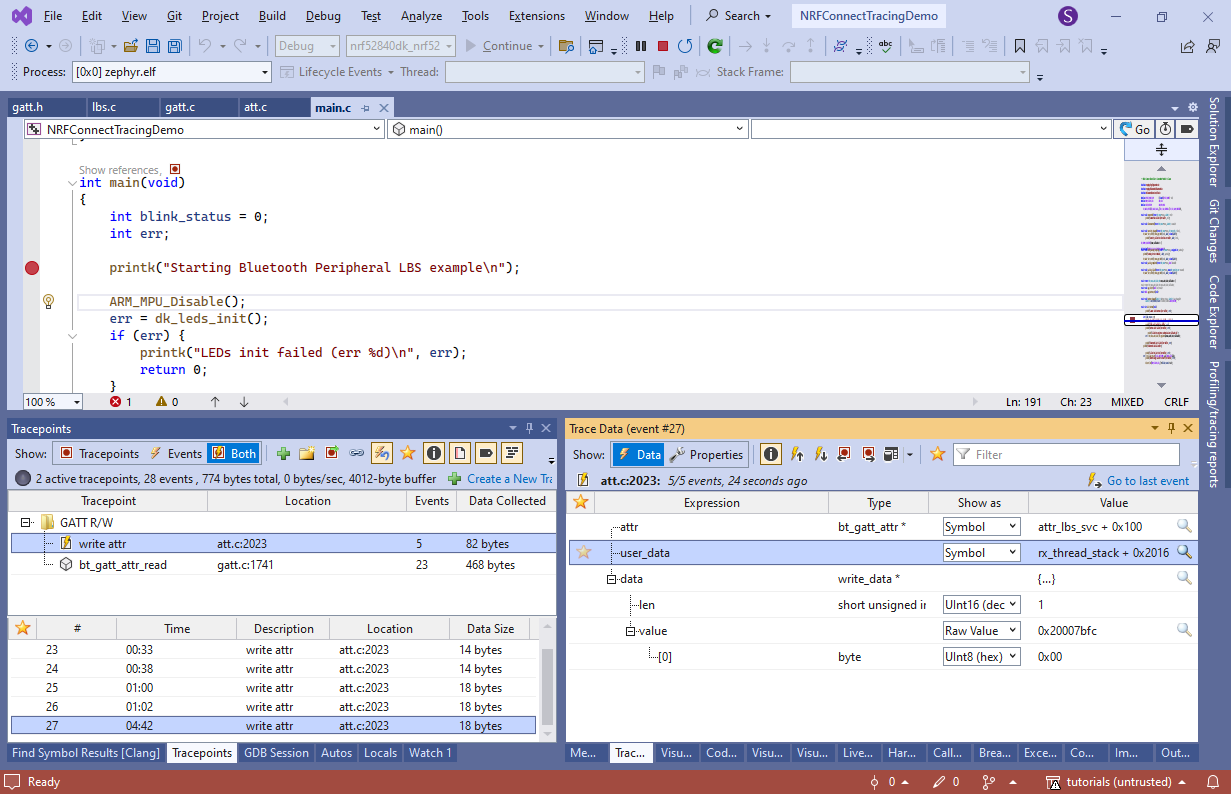
- Try changing the write() tracepoint to record user_data:
- Once you click “Commit”, VisualGDB will update the tracing program accordingly and redirect the old tracepoint to use it:
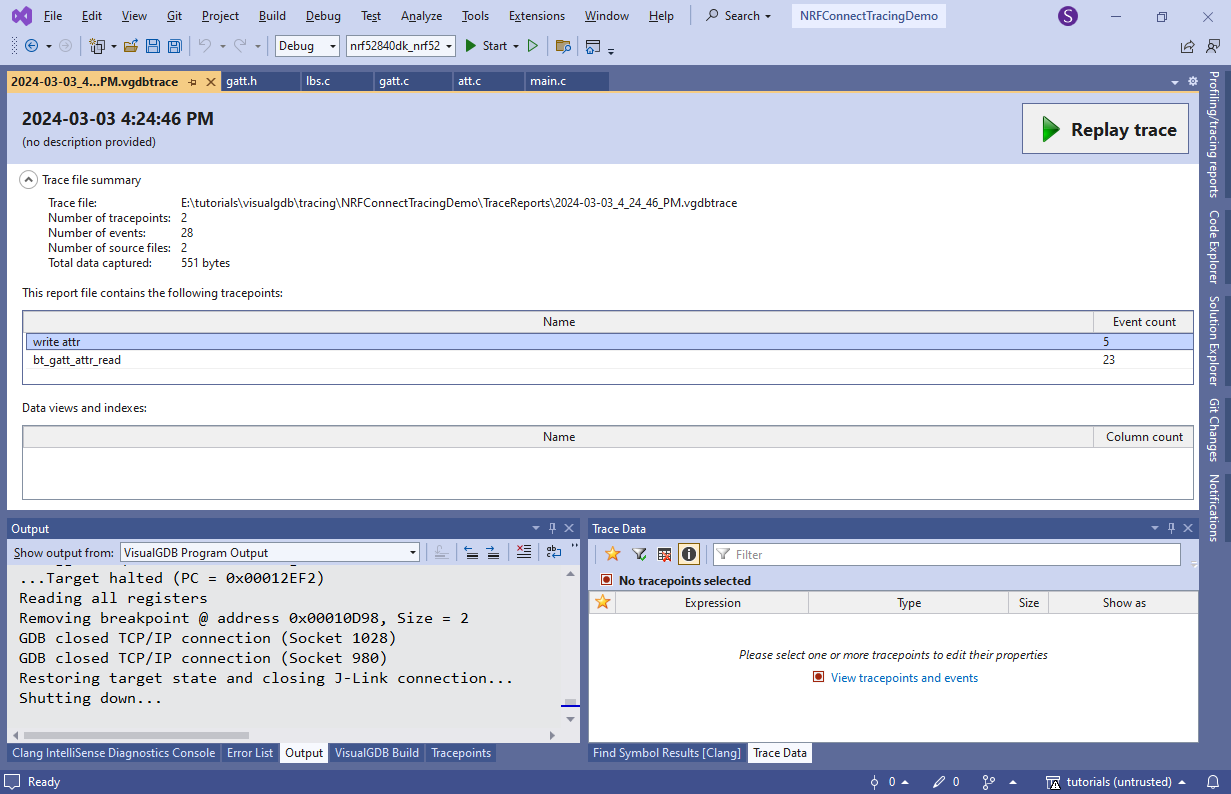
- Press Shift-F5 to stop debugging. VisualGDB will create trace report file containing all recorded data. You can use it later to step through the recorded events, view tables/graphs, or export everything into a machine-readable XML file:
- If you want to record the GATT requests at any time in the future, simply leave the tracepoints inserted but disabled. This will add a minor runtime overhead, but won’t trigger the watchdog when you enable them. Alternatively, you can export them to a tracepoint set and remove them from the list:
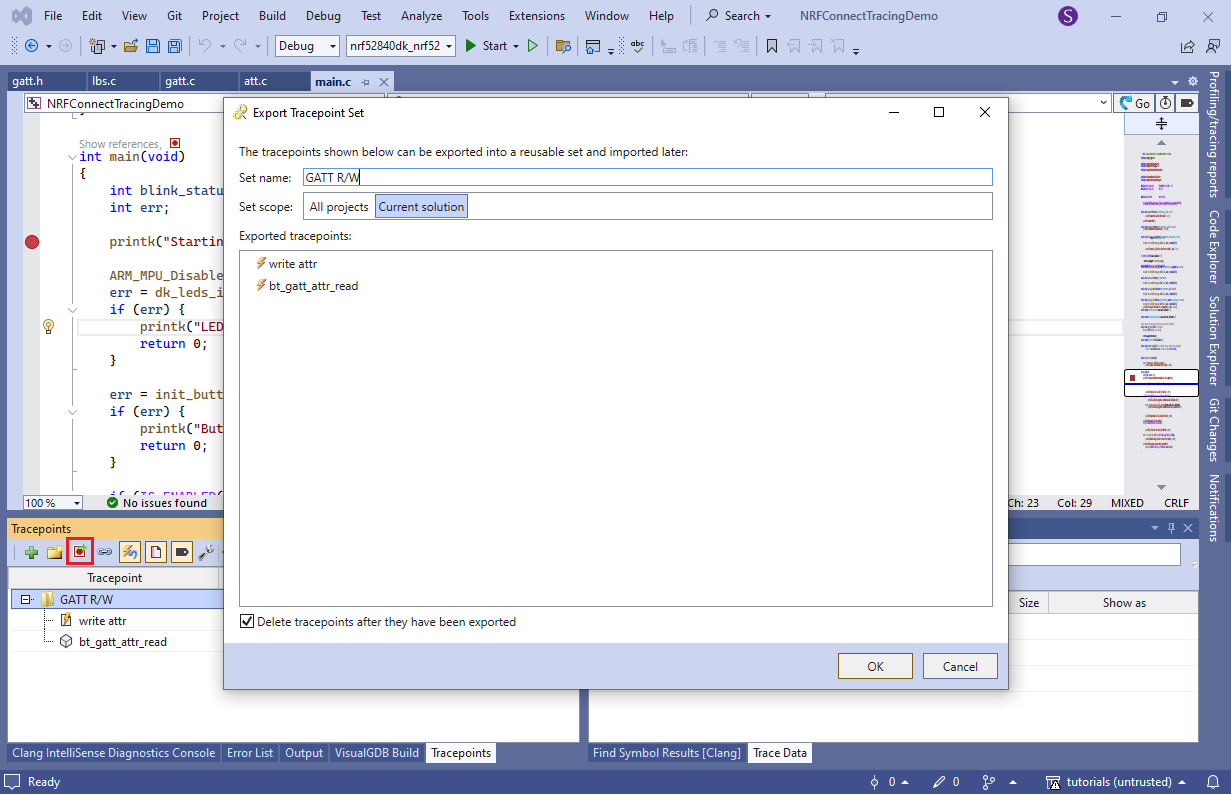 This will eliminate any overhead, and next time you need them, you can simply import the tracepoint set without having to re-create and re-configure them manually.