Using Software Tracing to Record USB Requests
This tutorial shows how to use Software Tracing to easily record all USB requests handled by a device, and to quickly find differences between broken and working firmware versions that handle some requests differently. We will demonstrate it based on the old STM32 CDC example that didn’t work with the regular Windows 10 CDC driver. We will record the requests and replies from both projects, will locate the critical difference, and patch the old project to work with the regular driver.
Before you begin, install VisualGDB 6.0 or later.
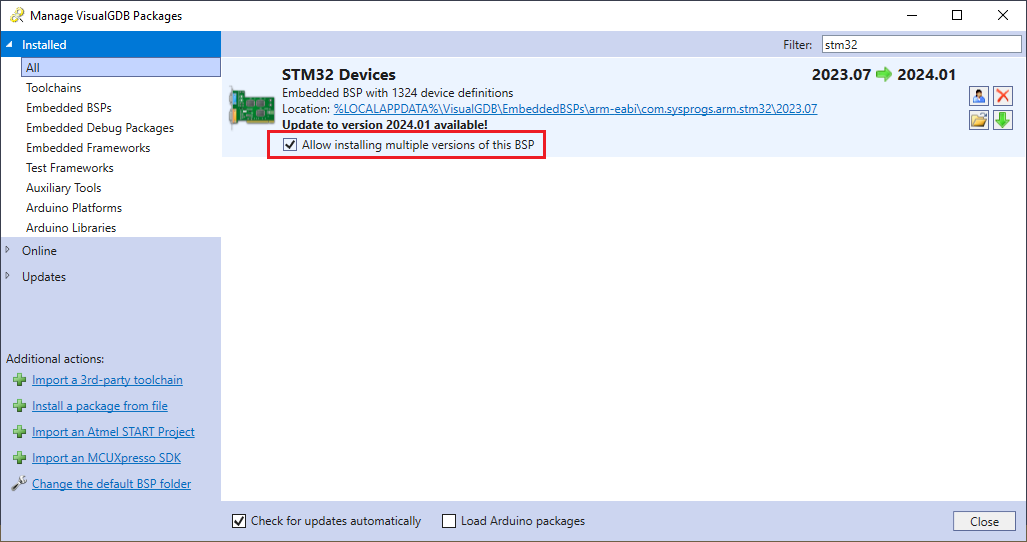
- Start Visual Studio and open Tools->VisualGDB->Manage VisualGDB Packages. Then, locate the STM32 BSP under the Installed section and check the “Allow installing multiple versions” checkbox:
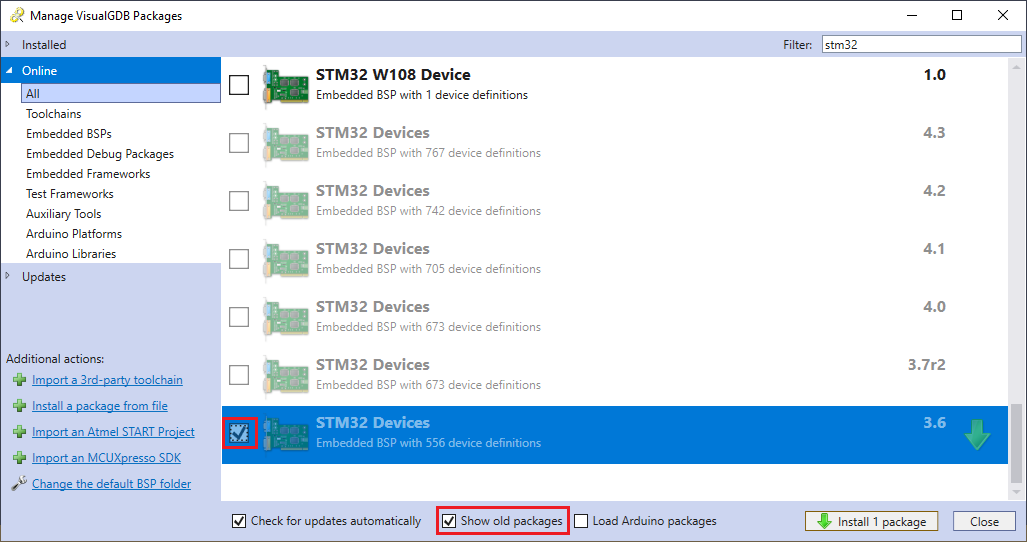
- Go to the Online section, check the “show old packages” checkbox, locate STM32 Devices v3.6 and install it:
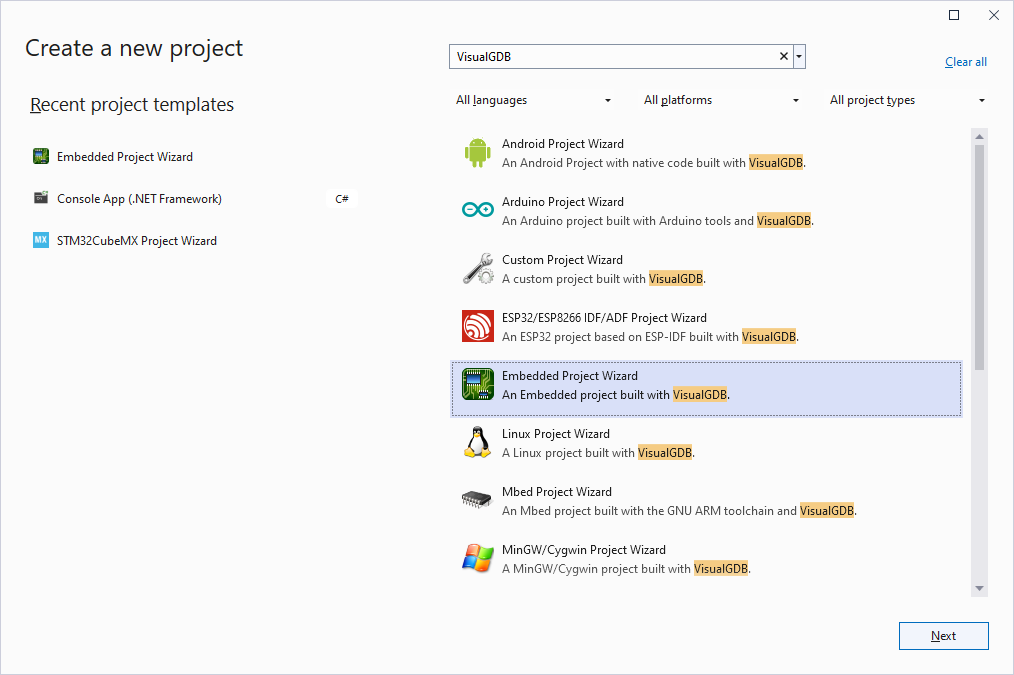
- Now you can start creating projects with both BSP versions. First, locate the VisualGDB Embedded Project Wizard:
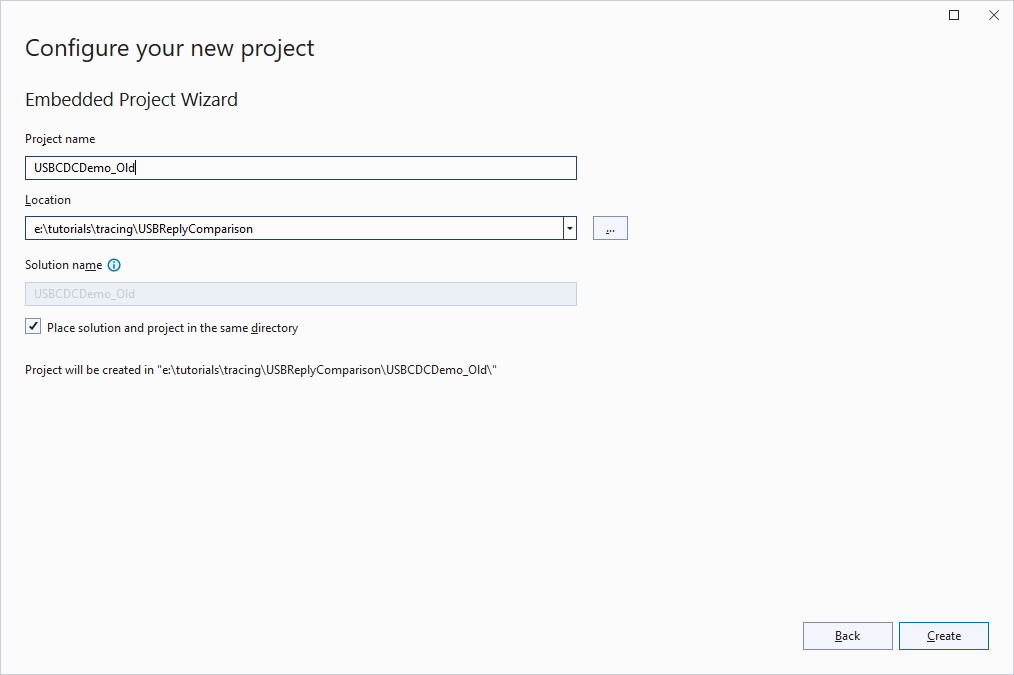
- Enter the name and location of the first project:
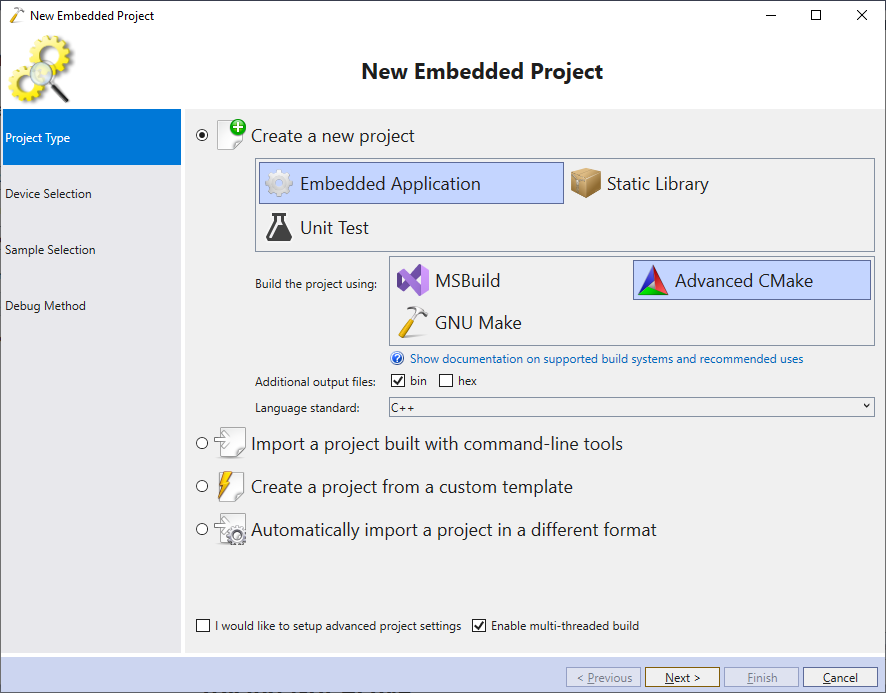
- Proceed with the default settings on the next page:
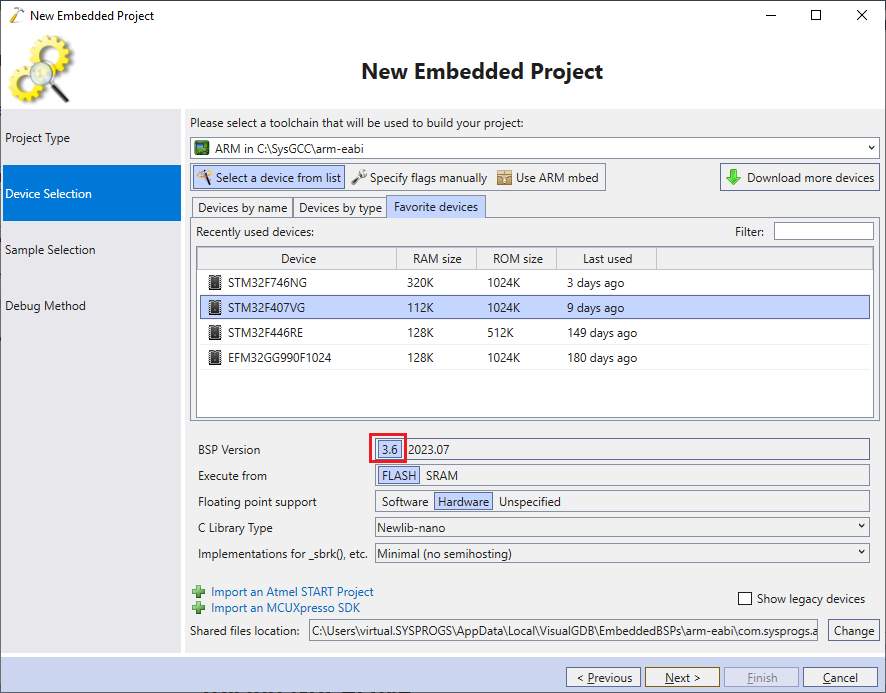
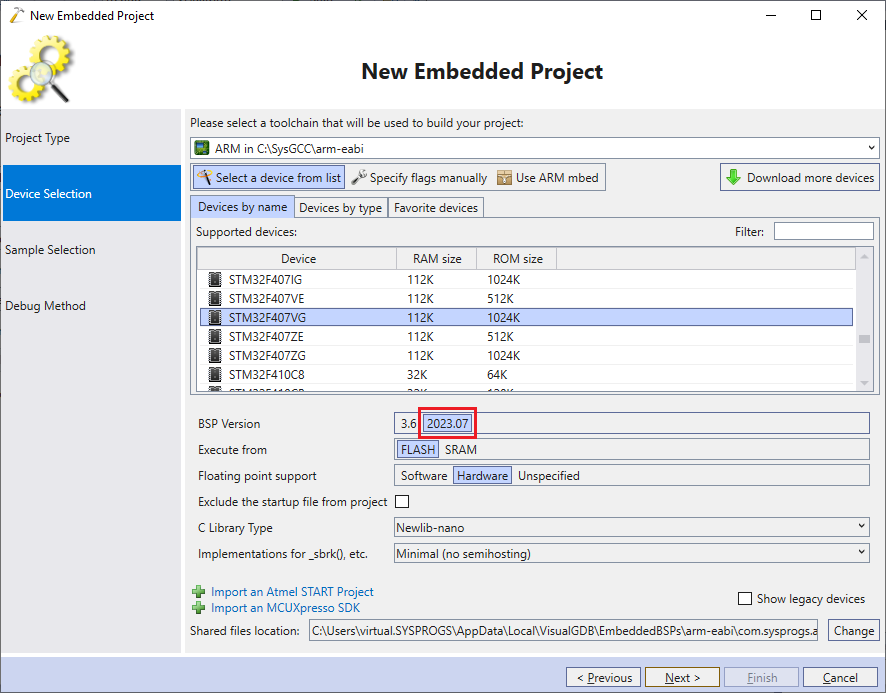
- Pick the ARM toolchain and select the device you are targeting. In this tutorial we will use the STM32F4Discovery board that uses STM32F407VG. Make sure you select the old BSP version first:
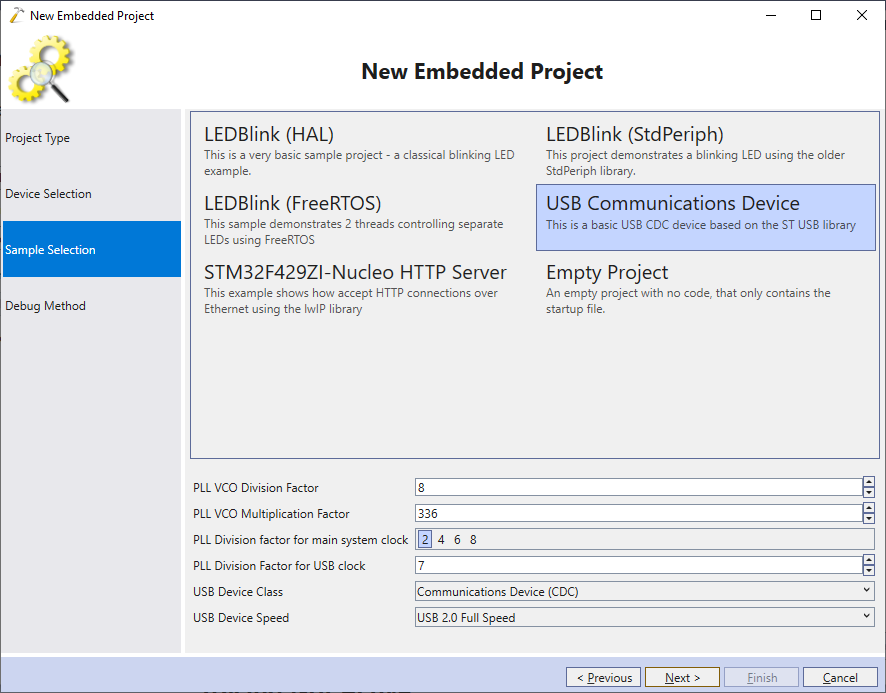
- On the next page choose the USB Communications Device and click “Next”:
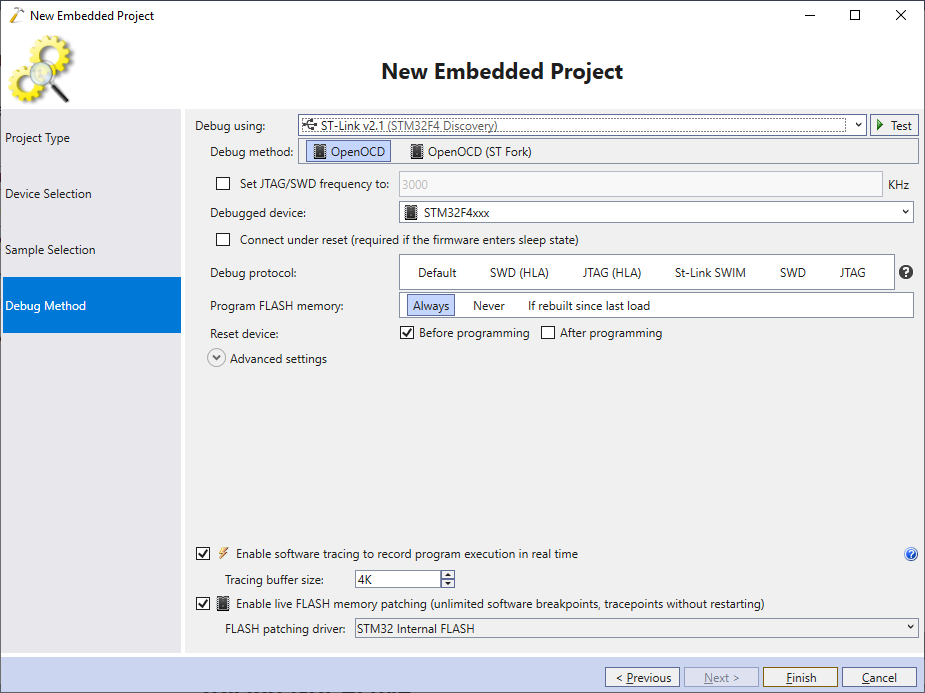
- Finally, configure the debug settings that work with your setup and ensure the software tracing is enabled at the bottom of the page:
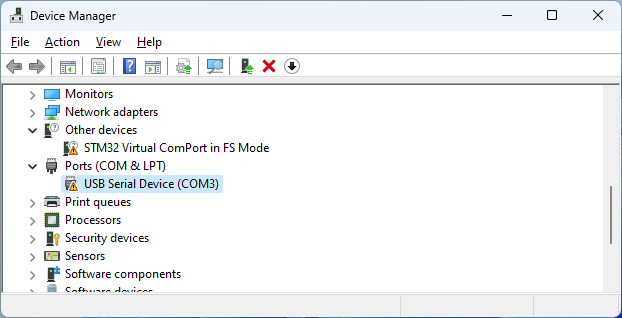
- Try building and running the project. If you are using the regular USB COM port driver bundled with Windows 10/11, it won’t be able to start the device properly:
- Create a new project for the same device, this time picking the latest BSP:
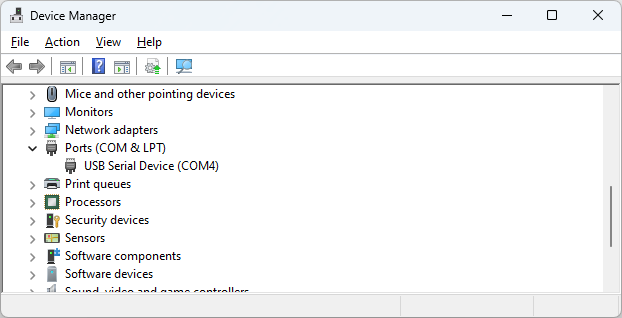
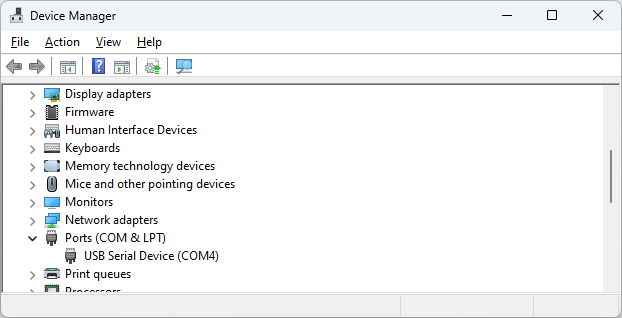
- Run it and make sure the device got recognized:
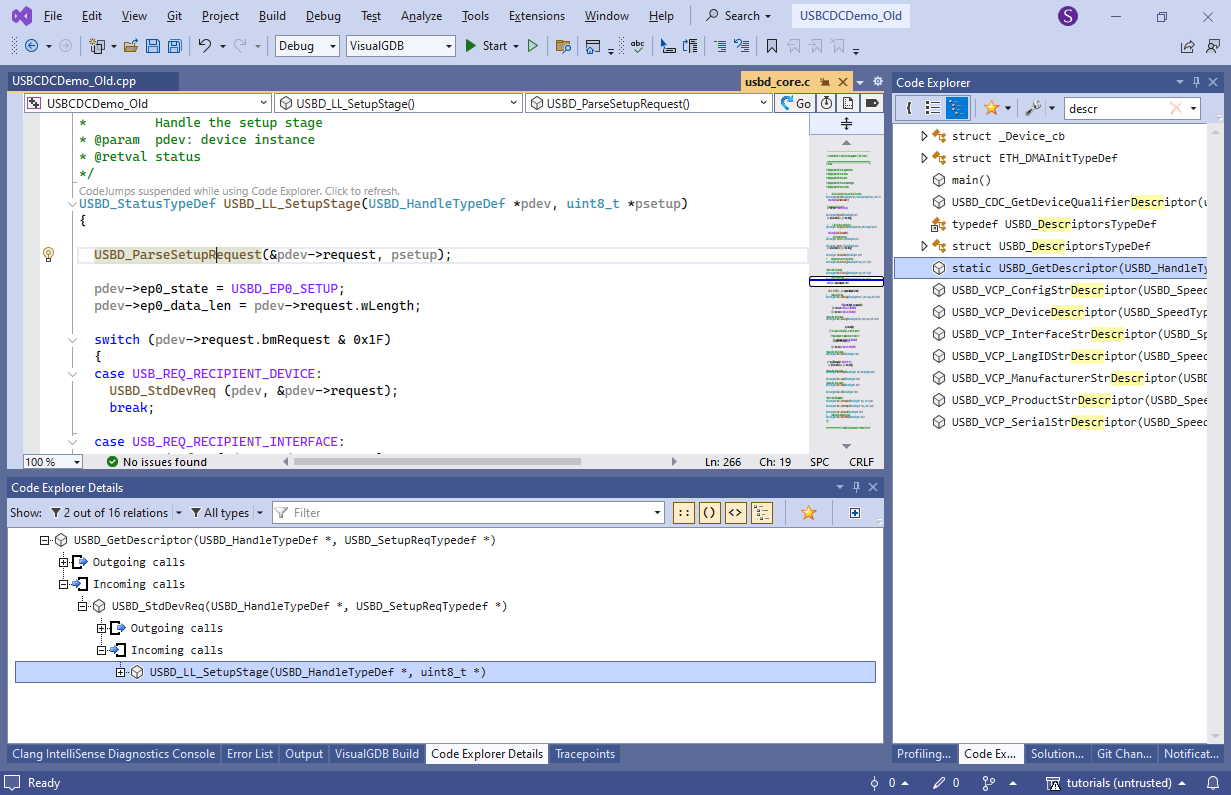
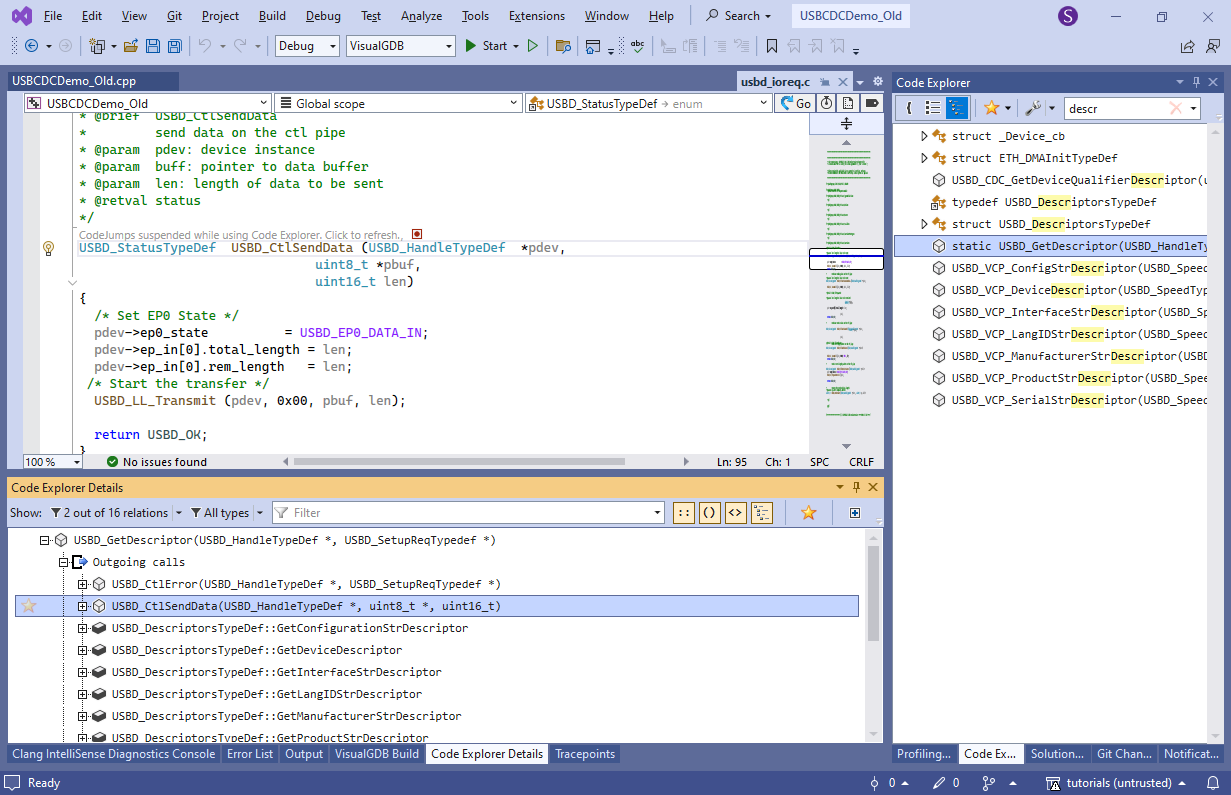
- Normally, we could step through both versions of the project, trying to find the critical difference, however given that USB requests expire after a brief timeout, it would not be practical. Instead, we will use the software tracepoints to record USB-related activity happening on the device, and will compare the traces later. First of all, use Code Explorer to locate all functions related to descriptors, and then navigate the call tree to see that most descriptors are queried from USBD_LL_SetupStage():
- Click on the tracepoints bar on the line after the call to USBD_ParseSetupRequest() and create a new tracepoint recording pdev->request:
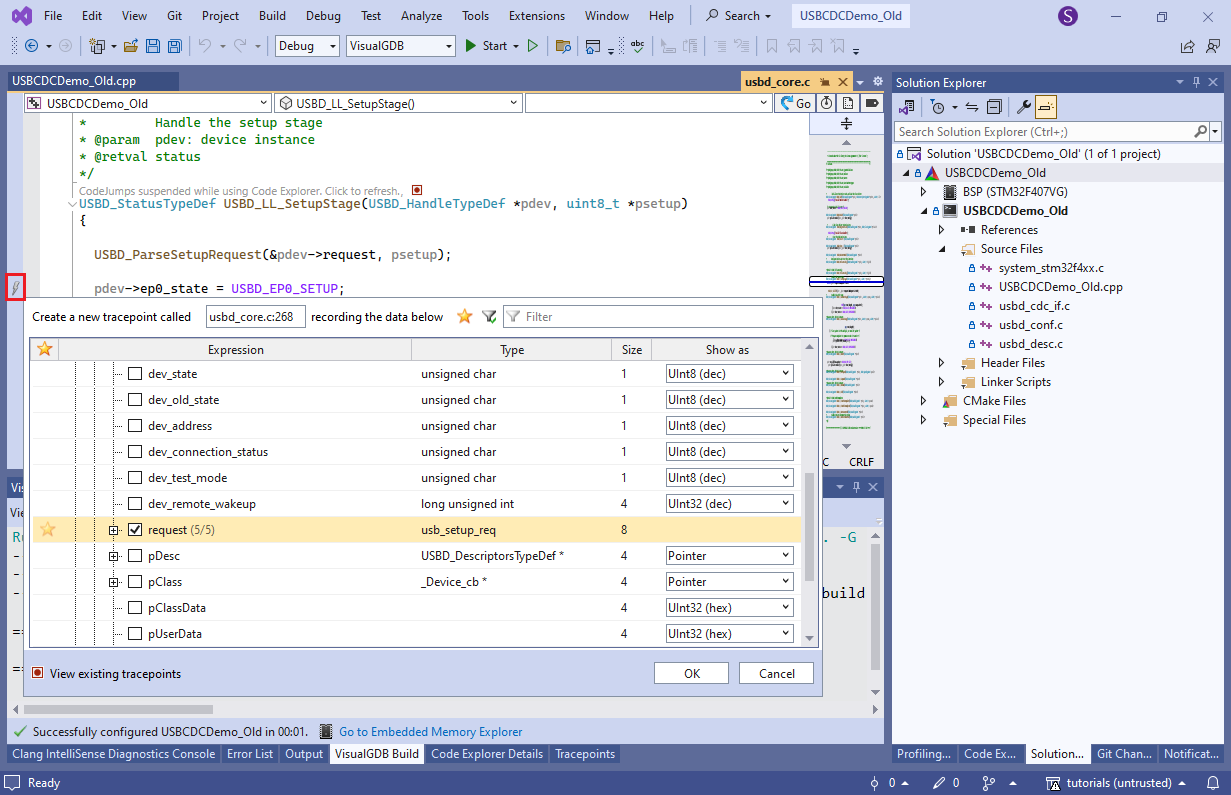
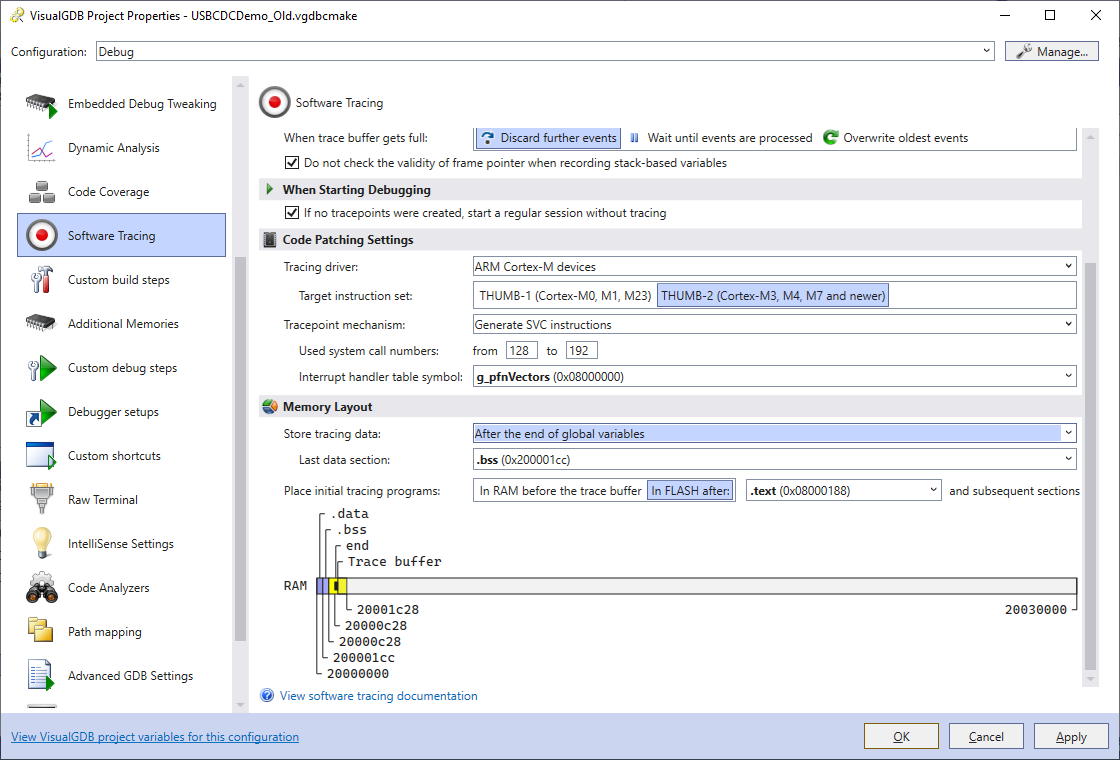
- The old STM32 BSP uses a slightly different memory layout than the new one, so VisualGDB will ask you to verify the tracing settings, and will not agree to place the tracing buffer at the end of RAM. Instead, select “Store tracing data => After the end of global variables”:
- Look through the code (or use the Code Explorer) to find the queried descriptors are sent back to the PC via USBD_CtrlSendData():
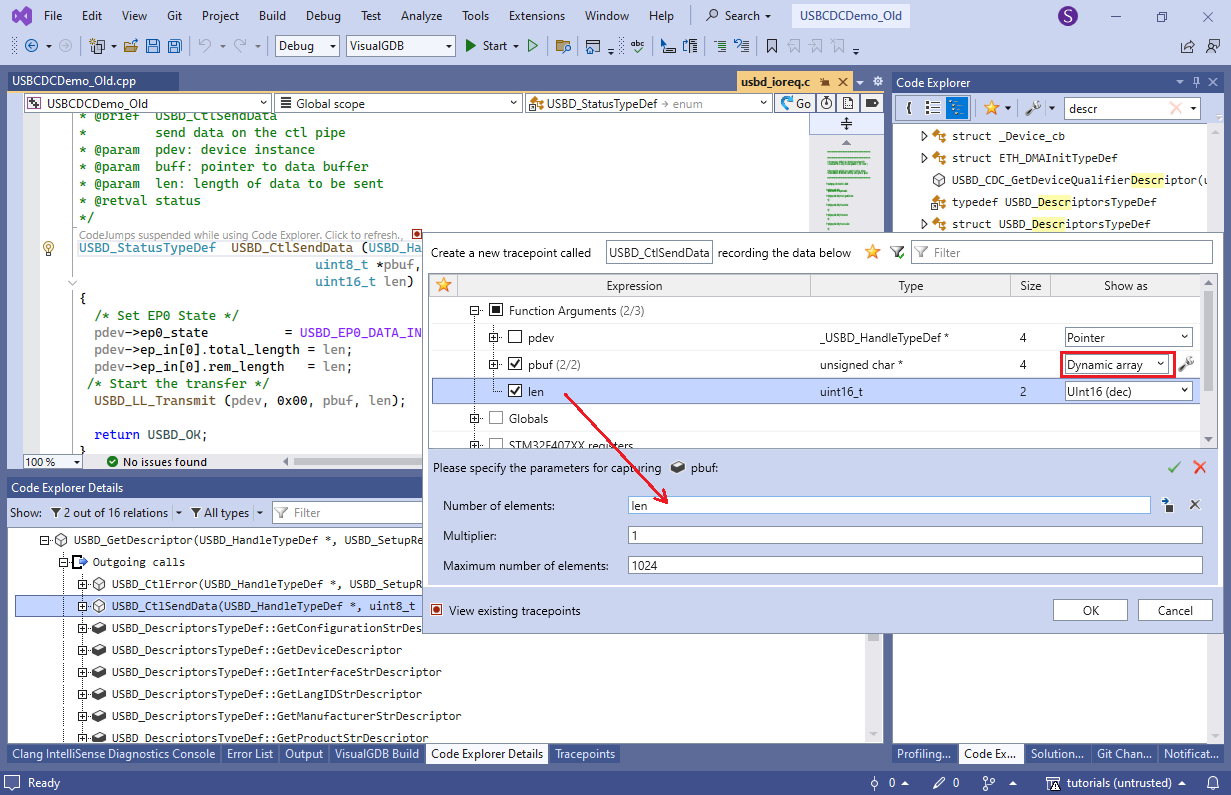
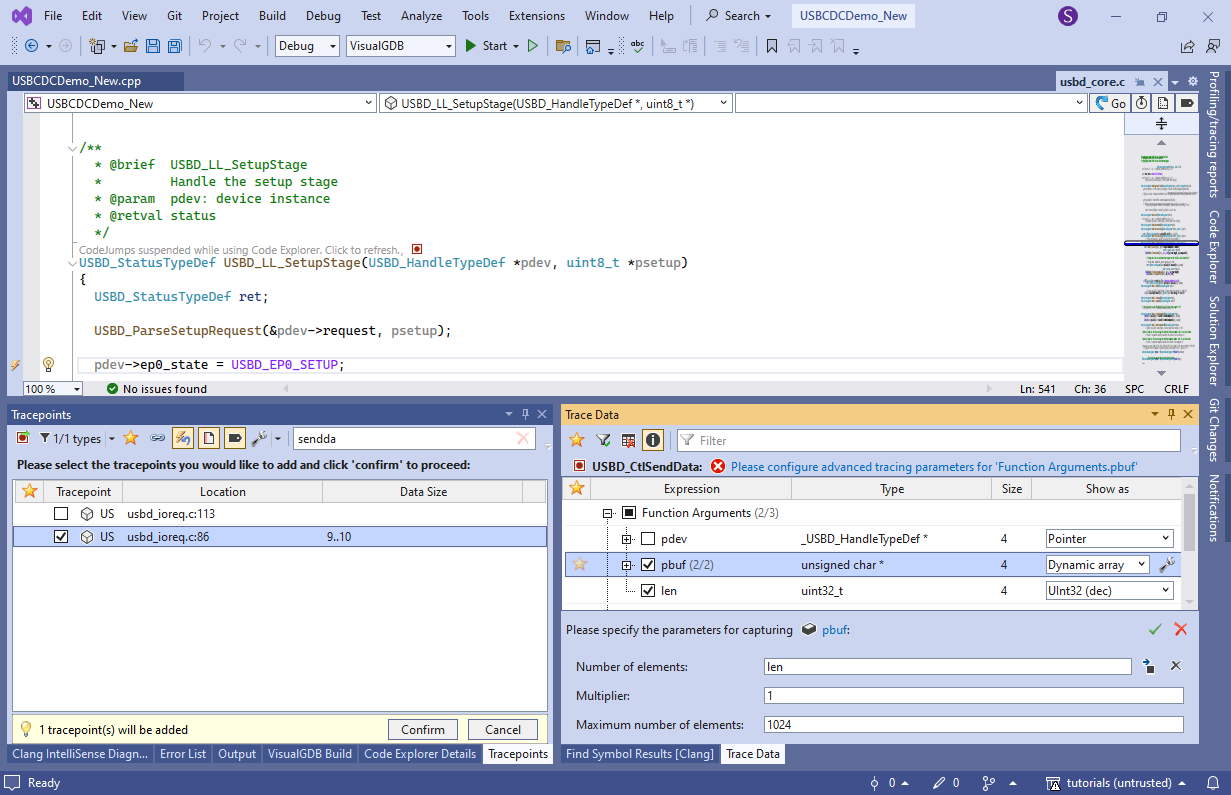
- Add a tracepoint there using the annotation on top of the function (or via the Tracepoints window) and configure to trace pbuf as a dynamic array of len elements:
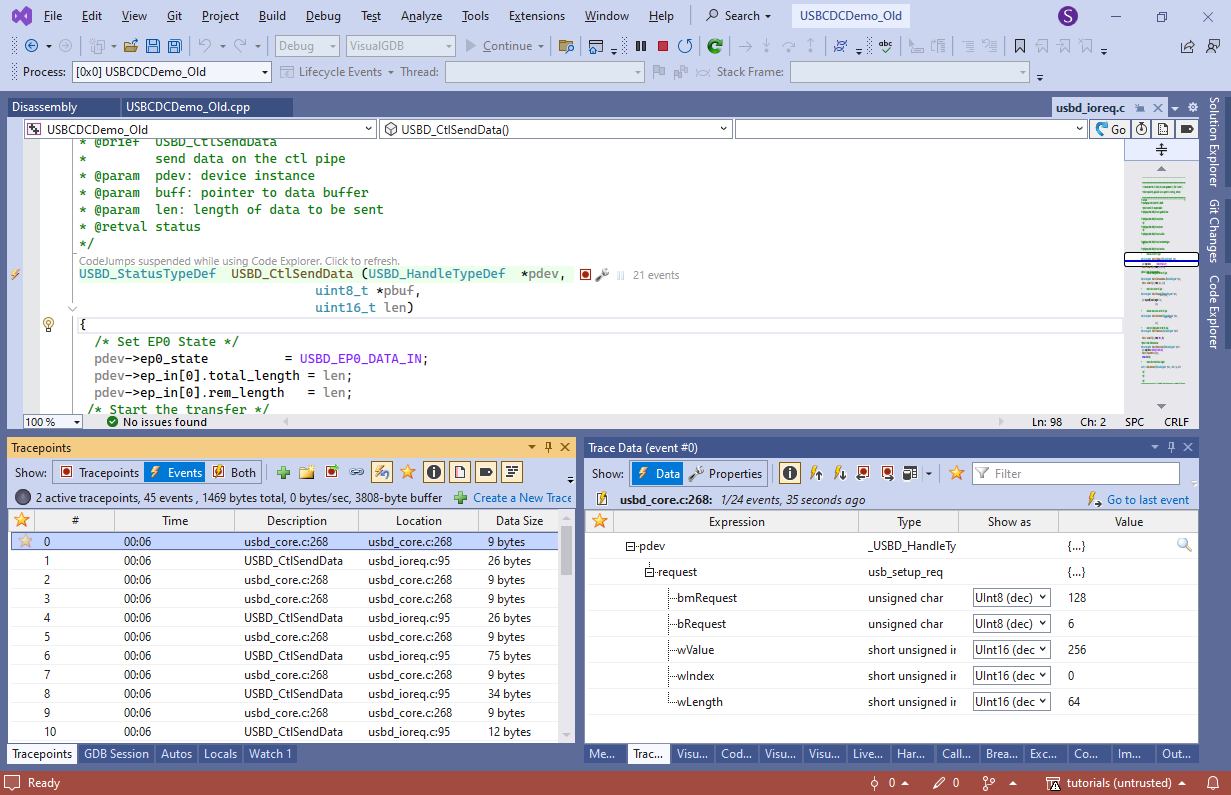
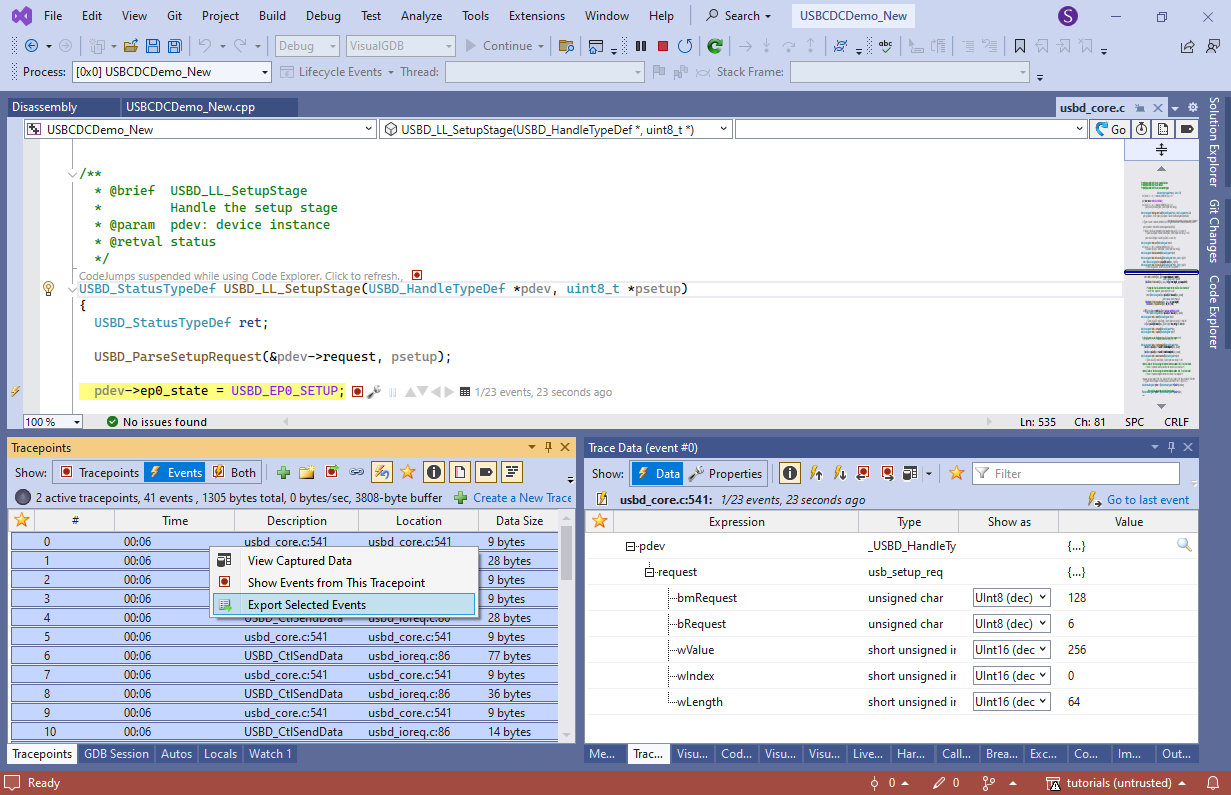
- Now you can press F5 to start debugging and VisualGDB will record each descriptor request and each outgoing packet sent via USBD_CtrlSendData(). You can immediately see the very first request, or browse through multiple ones if you suspect a particular one:
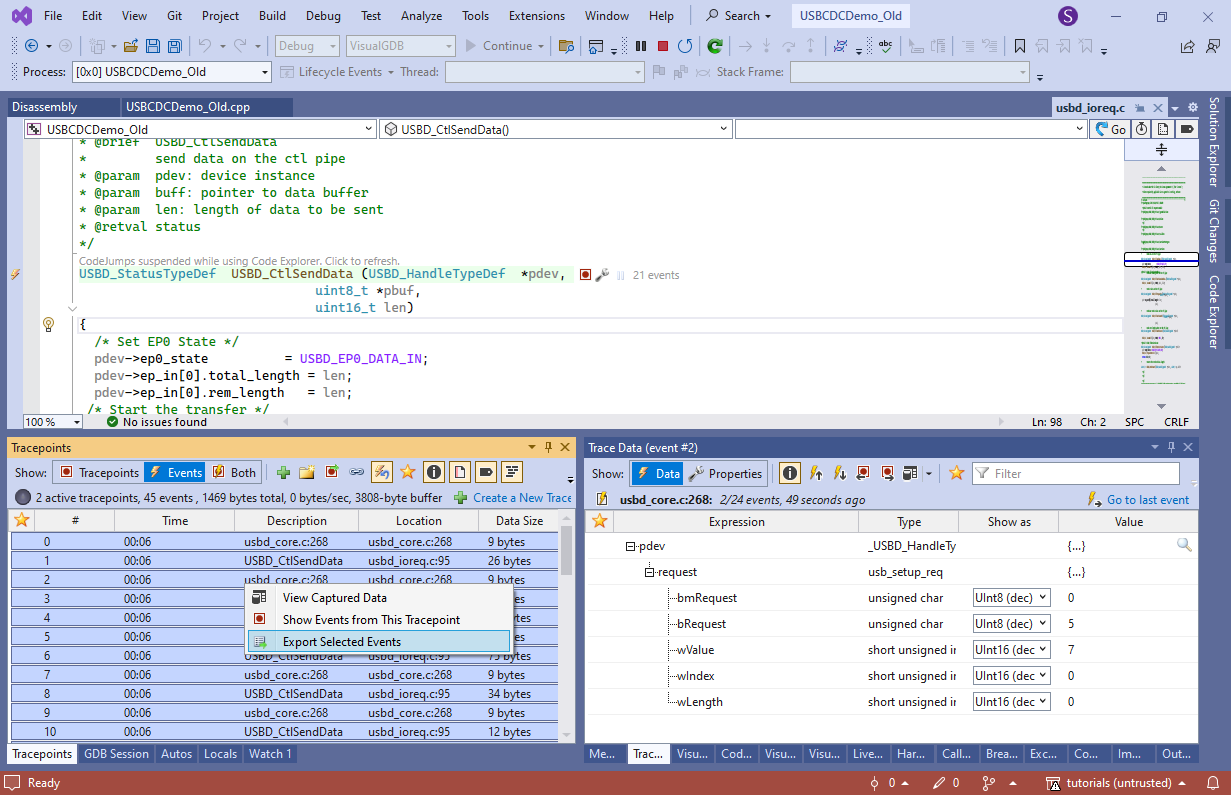
- As we don’t know which request is different, we will instead export all traced data into a text file, and will compare it against a newer option. Select all events, right-click on them and click “Export Selected Events”:
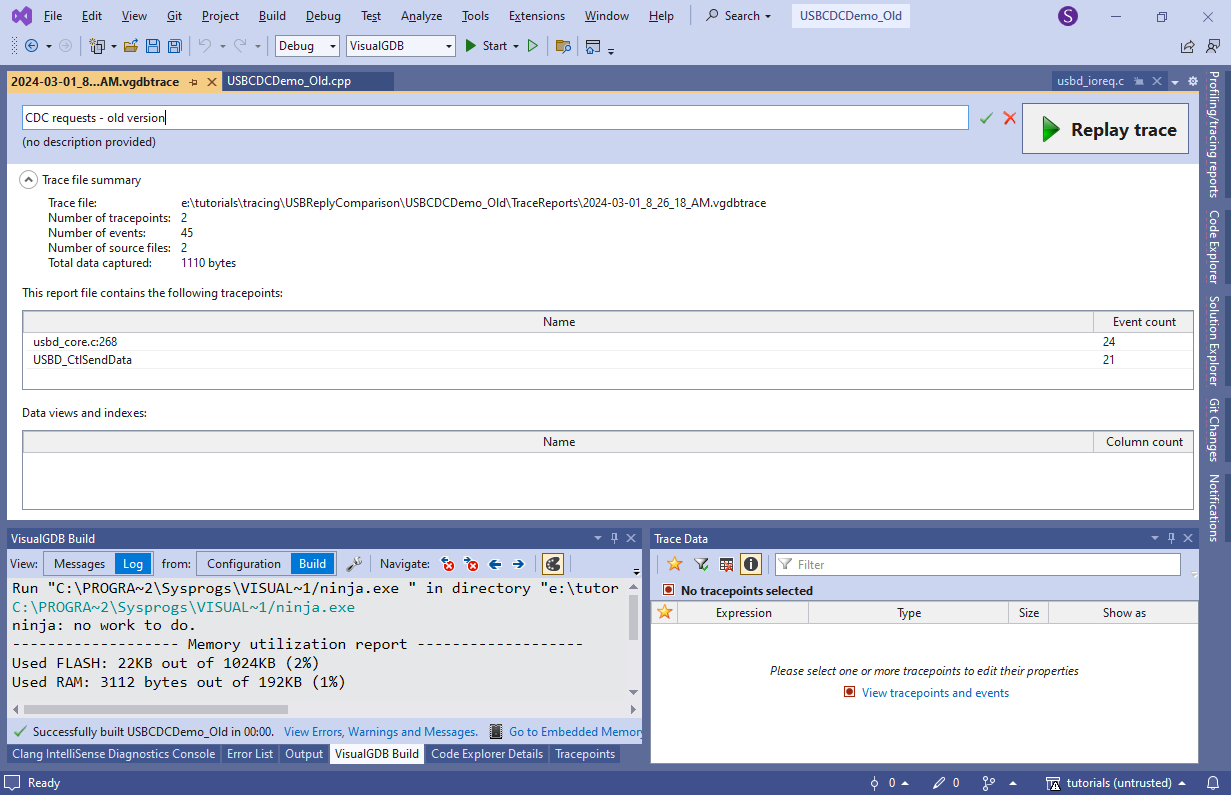
- Stop the debugging session. VisualGDB will create a trace file that can be replayed at any later moment:
- Now open the newer version of the project and create the same tracepoints:
- Run a debugging session to capture the events and export them to another text file:
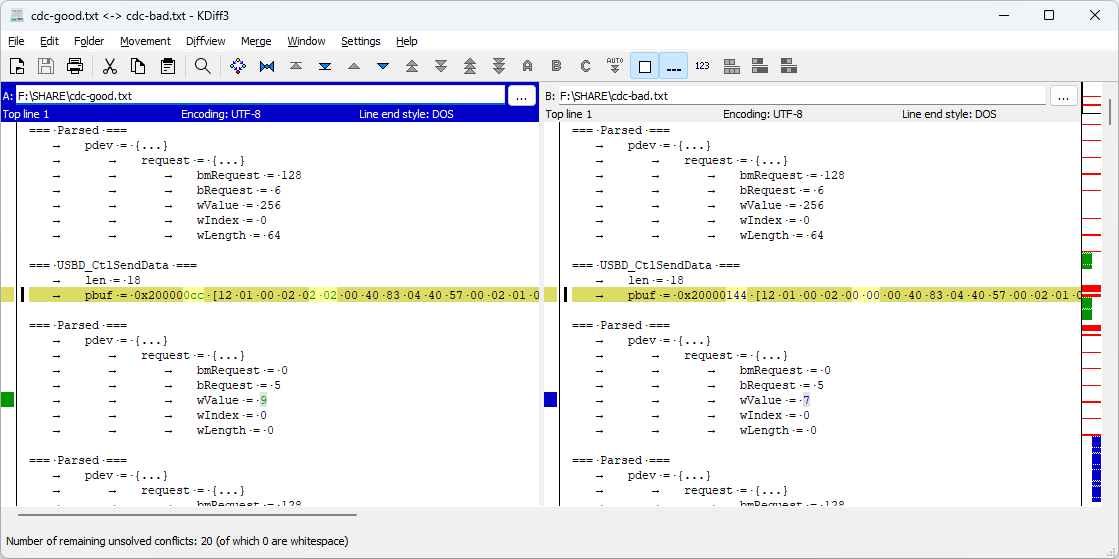
- Use a diff tool (e.g. KDiff3) to compare the requests and replies in both versions. You can quickly see that the very first request yields a slightly different reply:
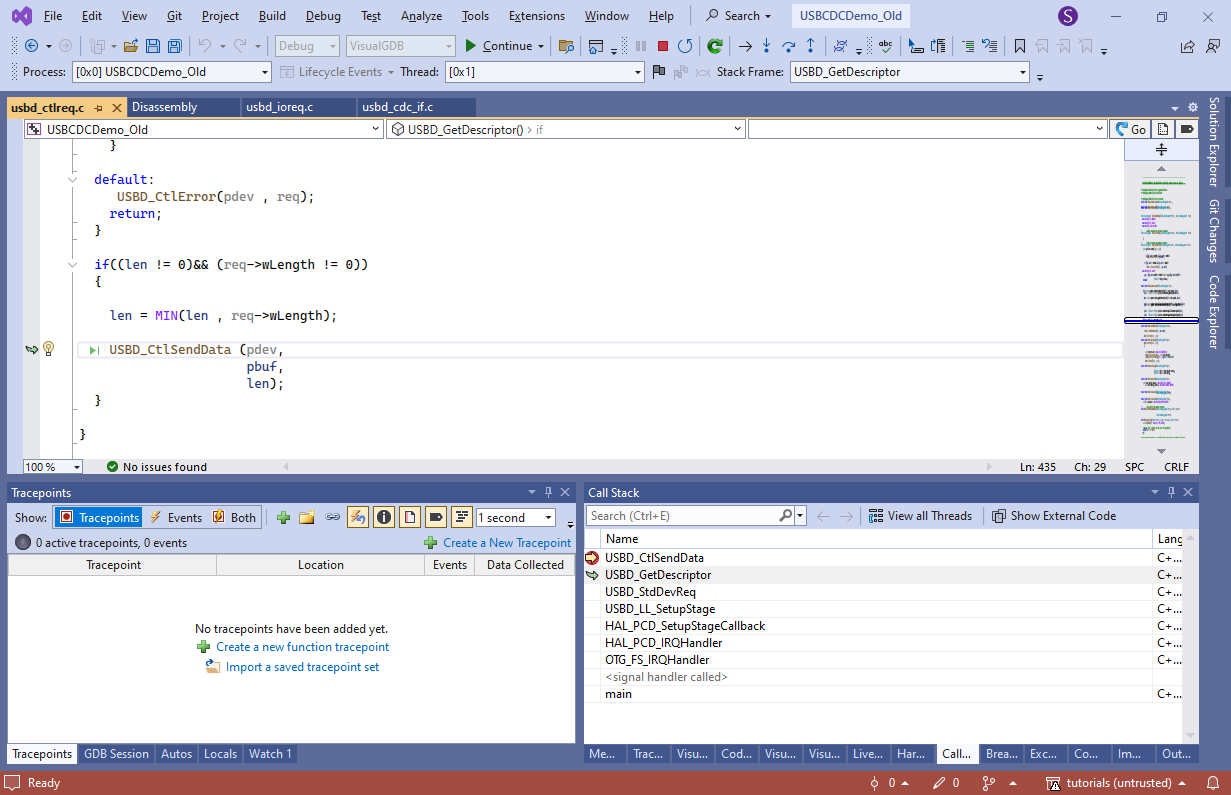
- Set a breakpoint in USBD_CtrlSendData(), wait for it to trigger, and use the call stack to see which function calls it:
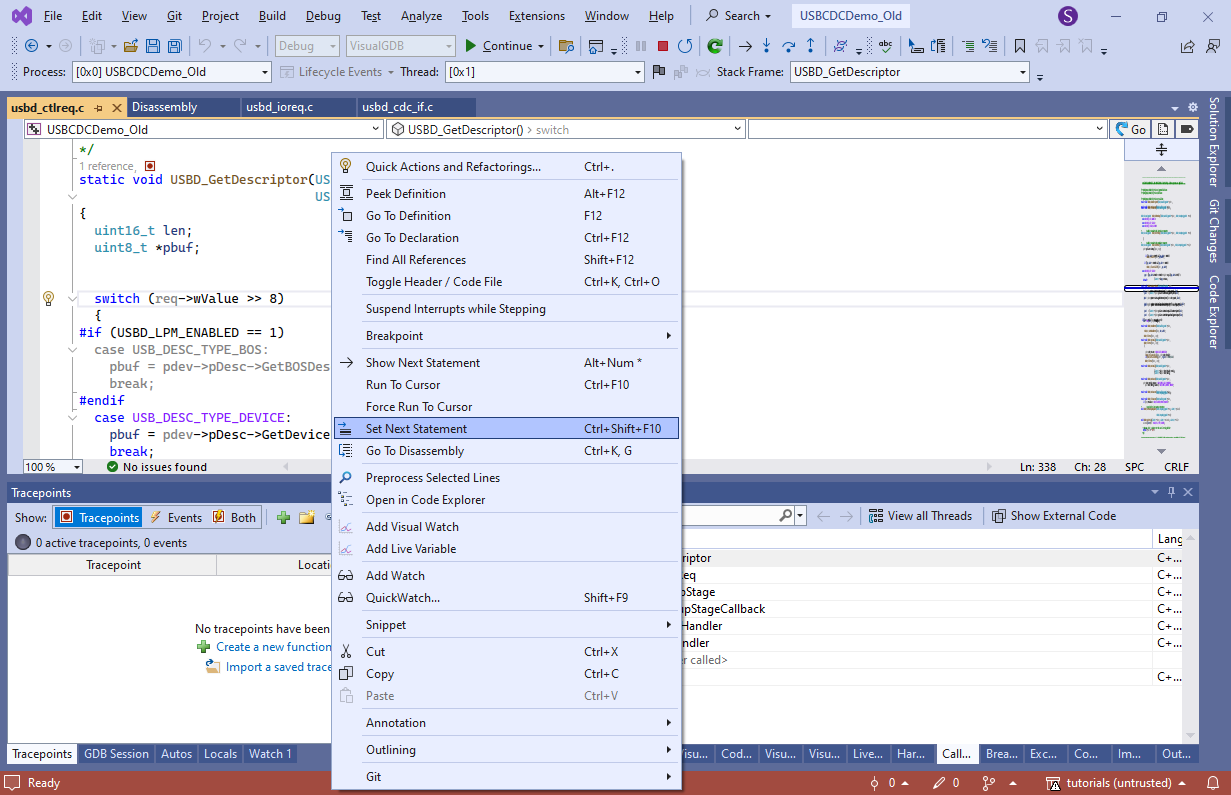
- You can manually check the value of req->wValue to see which descriptor is being requested, or just step out of USBD_CtlSendData() and forcibly step into the first line of USBD_GetDescriptor() to run the same code again:
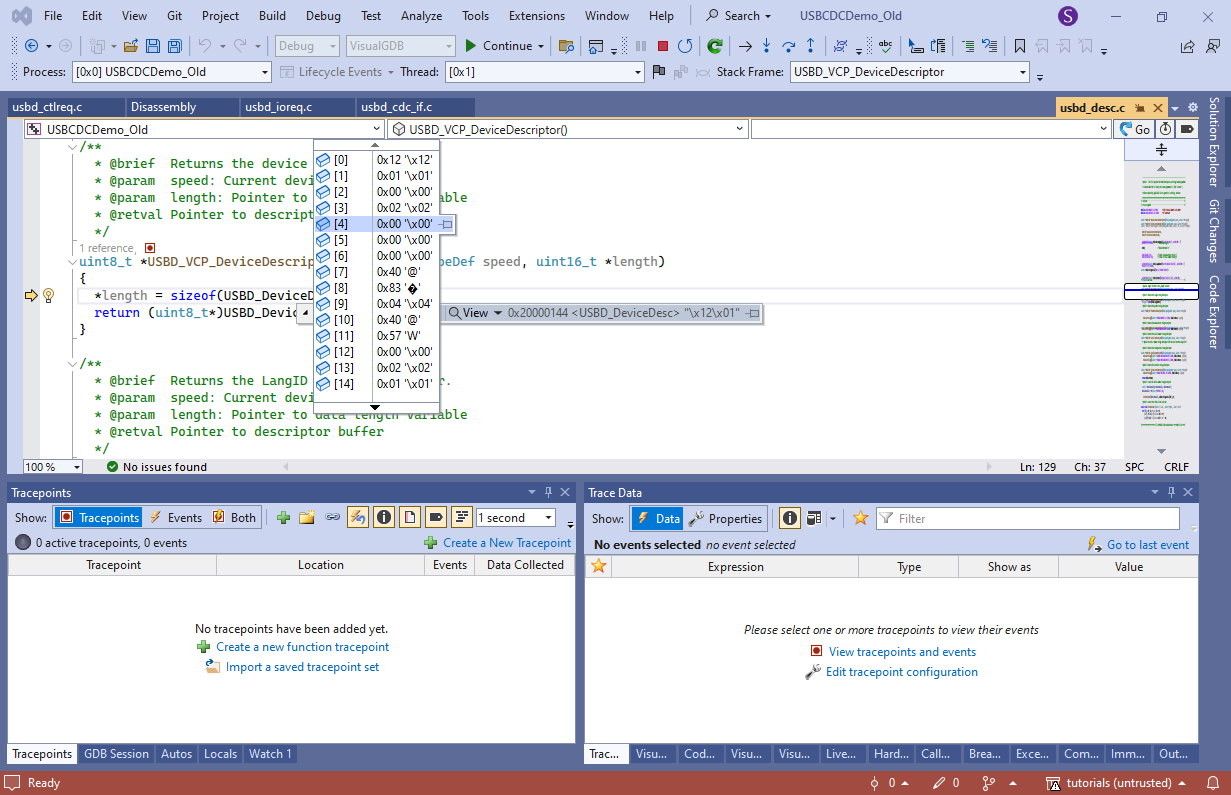
- Stepping through it quickly reveals that the first queried descriptor is the device descriptor and its bytes [4] and [5] are indeed 00 instead of 02 in the newer version:
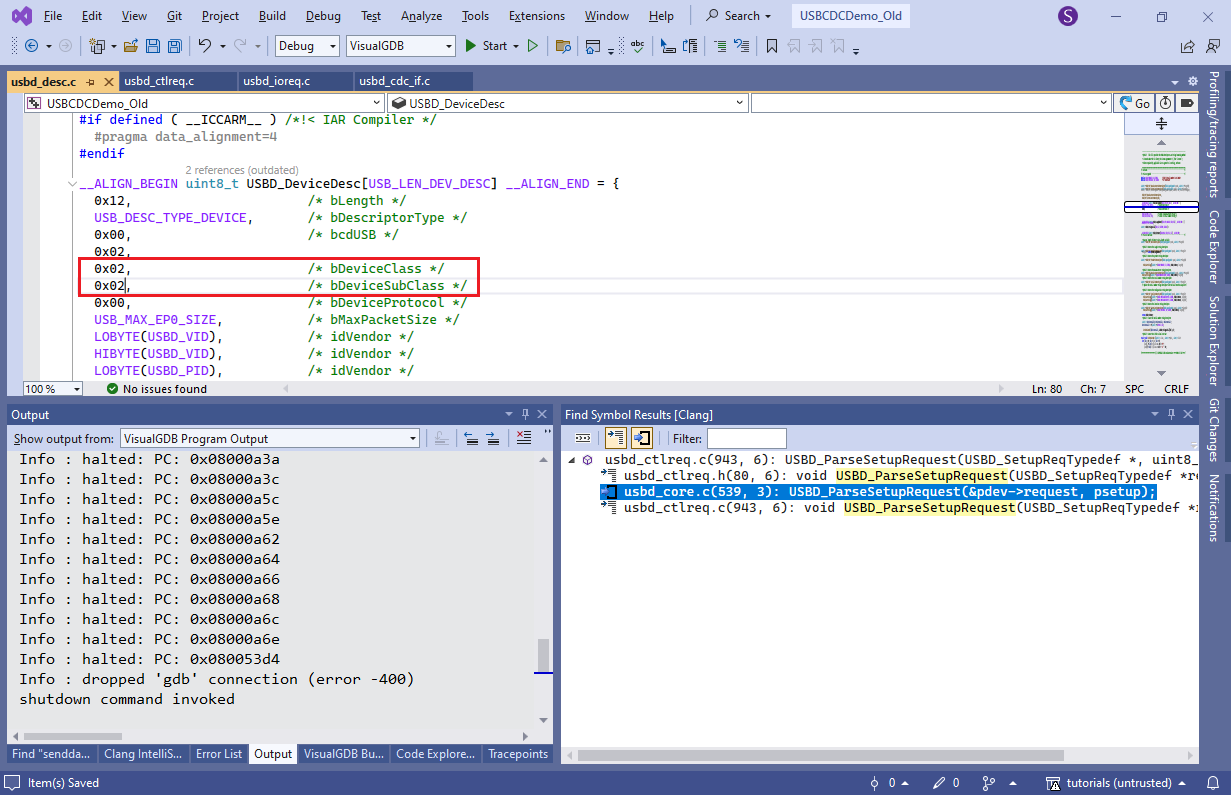
- Go to the definition of USBD_DeviceDescriptor and replace the bytes in question with 0x02:
- Now the old version of the firmware will behave just like the new one, having the COM port successfully recognized and started:
You can keep the recorded trace files for reference, so if the firmware stops working at a later stage, you could always compare its behavior to the times when it worked fine. Trace files can be opened via File->Open in Visual Studio, or converted to XML files by running the following command:
VisualGDB.exe /trace2xml <file.vgdbtrace>