Memory Explorer Window
The Memory Explorer window provides a detailed insight into the memory utilization of your program, and also provides a few analysis options. It can be useful when optimizing the program’s memory footprint, checking that all necessary parts of the program made it to the ELF file, or analyzing the impact of a global setting (e.g. optimization level) on the program. The Memory Explorer window supports several views that will be shown below.
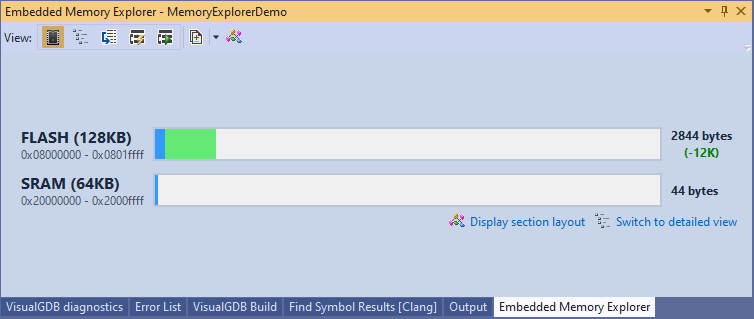
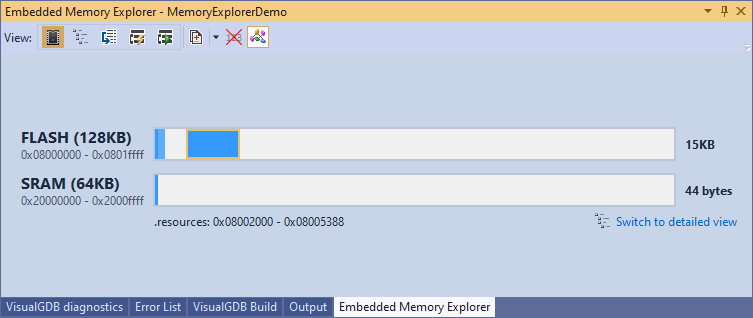
Summary View
In this view the Memory Explorer will display the utilization for each of the target device’s memories. The utilization is computed by analyzing the ELF file (typically named <Project Directory>\VisualGDB\<Configuration>\<Project Name>) that will be used when programming the memory, or debugging the project.
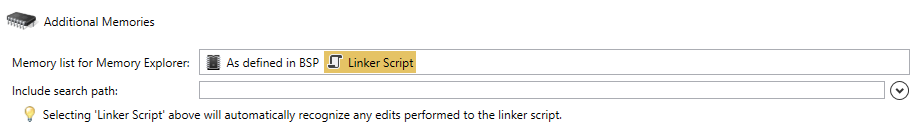
The list of memory regions is normally taken from the device definitions managed by VisualGDB (%LOCALAPPDATA%\VisualGDB\EmbeddedBSPs\<target>\<id>\BSP.XML). If you are using the Custom edition or higher, you can add extra memory regions via VisualGDB Project Properties -> Additional Memories, or configure VisualGDB to read them directly from the linker script file:
 You can also completely override the list of memories used by VisualGDB by creating a MemoryMap.xml file in your project directory (the structure is the same as the BoardSupportPackage/SupportedMCUs/MCU/MemoryMap node in BSP.XML) and adding a MemoryMapOverride element under the Project element in your .vgdbsettings (or .vgdbcmake) file:
<Project xsi:type="com.visualgdb.project.embedded"> <!-- ... --> <MemoryMapOverride>MemoryMap.xml</MemoryMapOverride> </Project> |
You can use the following buttons to customize the information shown in the summary view: 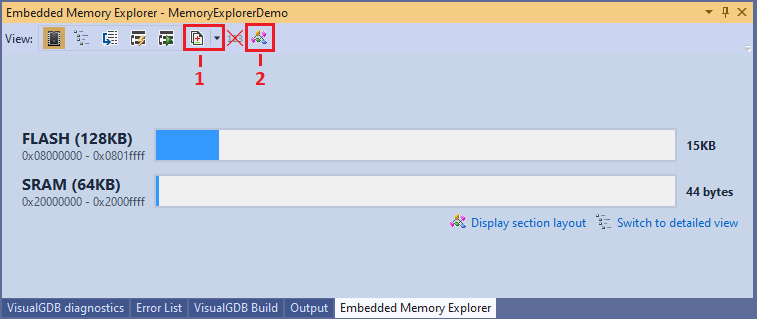
- Comparison mode. Normally, the Memory Explorer window will compare the current build of the project against the previous build, highlighting the differences in red and green. However, you can use this button to compare the current build against a specific ELF file, or save the current build for future comparison:
- Section layout view. This mode displays the exact size and location of each section inside the ELF file. It is useful for visualizing gaps due to alignment and double-checking section addresses:
Details View
This view provides an exhaustive list of all symbols (e.g. functions or global variables) present in the ELF file. Note that the variables placed in stack or allocated from heap will not be shown here, as they have no fixed location in memory.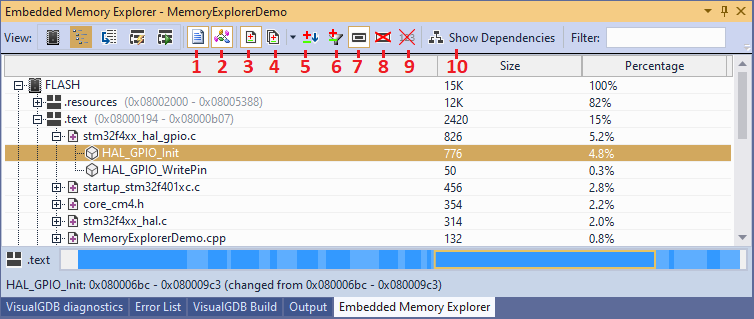 The Detailed view of Memory Explorer can be customized as shown below:
- You can view a flat list of symbols ordered by their size, or group them by the file where they are defined (1), or the section where they are placed (2).
- The Compare With Previous Build button (3) will highlight the symbols that were added, removed, or changed in comparison to the previous build. You can select a specific ELF file as a comparison base (4), sort the symbols by the change in their size, rather than the absolute size (5), or hide the symbols that have not changed (6).
- The Utilization Bar button (7) will visualize the contents of the selected sections or memories at the bottom of the window. To improve usability, you can hide the empty space at the end of the selected memory (8).
- Normally, once you activate the Details view of the Embedded Memory Explorer, VisualGDB will display the physical function sizes (and also size/offset of structure members) directly in the code (requires using the Clang IntelliSense engine):
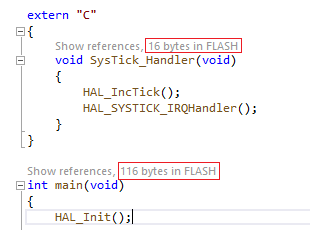 This behavior can be disabled via the Annotations button (9).
 - Enabling the Dependencies view (10) is useful for understanding why a specific symbol is included in the project output. Normally, every variable or function that was not discarded by the linker can be tracked back to either the interrupt vector table (that includes the reset handler) or one of the static constructors:
 Note that many library functions (e.g. printf()) rely on prebuilt auxiliary symbols that do not have the dependency information and hence will not be trackable in the dependency view.
If your linker script explicitly reserves memory for stack and/or heap, it will appear as separate sections typically having “stack” or “heap” in the name. Otherwise, the stack will start at the end of RAM (see the _estack symbol in the map file for the exact address) and will grow downwards. The heap will typically start after the end symbol and will grow upwards until it collides with the stack.
Quick Disassembly View
This view allows quickly disassembling individual functions of the program without starting a debug session. You can pick a specific function from the list, or enable the synchronized view (1) and the Memory Explorer will automatically disassemble the currently selected source line: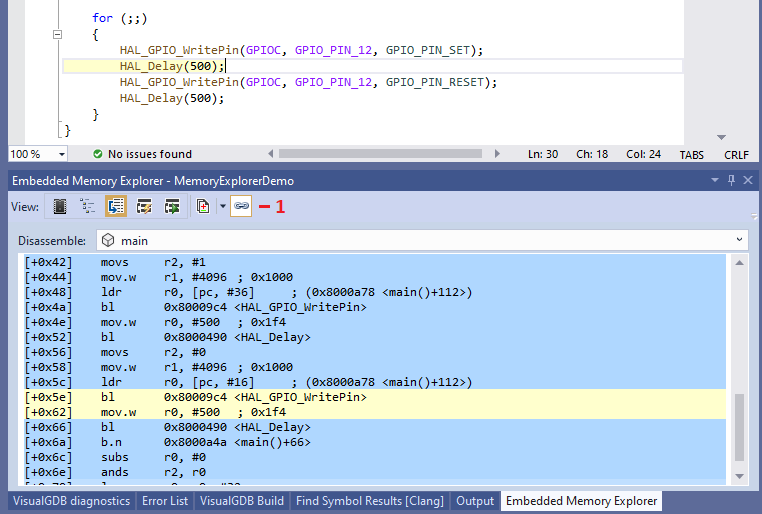
Stack Stack Analysis View
This view allows exploring the worst-case stack usage by different functions in the program. It works by disassembling the entire ELF file and searching functions for stack-modifying instructions. The analysis only supports ARM targets and is implemented in a separate open-source plugin. See this tutorial for a detailed step-by-step introduction to static stack analysis. As the static analysis may not automatically handle all cases (such as indirect calls), the Static Stack Analysis view provides commands for augmenting the discovered information. You can override stack usage for individual functions (4), add (5) or remove (6) calls between functions.
Note that if your code contains functions that never return, the instructions calling them will be very likely followed by a different code branch, or even a different function. In order to avoid interpreting this as a stack-corrupting behavior, these functions need to be tagged explicitly (8).
In order to locate relevant functions faster, you can tag them as favorite (7) and filter out everything else afterwards (2). You can also restrict the view to only functions that have overridden behavior (1).
Using the disassembly command (3) will switch the Memory Explorer to the Quick Disassembly view, focusing on the selected function.
The Analysis Log command (9) will display the diagnostic log from analyzing a specific function: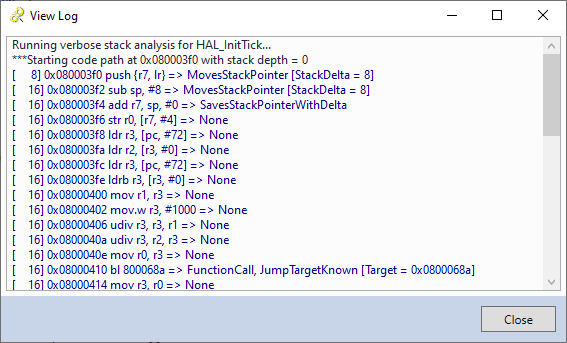 The analysis always starts at the beginning of the function assuming the stack depth of 0, and proceeds instruction-by-instruction, following calls and jumps. For conditional jumps, both branches are checked and the worst-case stack usage is taken. Each instruction can have one or more of the following effects:
| MovesStackPointer | The current instruction increases or decreases stack pointer by the delta value. |
| SavesStackPointerWithDelta | The current instruction saves the stack pointer to the frame pointer (with optional delta). |
| RestoresStackPointer | The current instruction restores the previously saved stack pointer. |
| ConditionalJump | The current instruction is a conditional jump. Unless the JumpTargetKnown attribute is also set, this will raise a “unknown jump” warning. |
| UnconditionalJump | The current instruction is an unconditional jump. Unless the JumpTargetKnown attribute is also set, this will raise a “unknown jump” warning. |
| ChangesStackPointerUnpredictably | The current instruction changes the stack pointer in a way that cannot be modeled (e.g. increases it by a value computed at runtime). This will trigger a warning. |
| FunctionCall | The current instruction is a regular function call. The analysis will follow it recursively. |
| ReturnFromCall | The current instruction returns control to the caller of the current function. |
| UnrecognizableInstruction | The current instruction could not be recognized. This will trigger a warning. |
| UnpredictableJump | The current instruction is a jump that cannot be statically analyzed. |
| MovesSavedStackPointer | The current instruction moves the frame pointer that was previously saved by an instruction with the SavesStackPointerWithDelta effect. |
| RegisterJump | The current instruction jumps indirectly via a register. This will trigger a warning. |
| JumpTargetKnown | Only valid for jump and call instructions. Specifies that the target address of the jump/call is known at the time of analysis. |
| ChangesFramePointerUnpredictably | The current instruction changes the frame pointer in a way that cannot be modeled (e.g. increases it by a value computed at runtime). This will trigger a warning. |
| JumpsViaLinkRegister | The current instruction jumps to the address stored in the link register. It is used in tail call optimization and is equivalent to calling another function just before returning (with no stack overhead). |
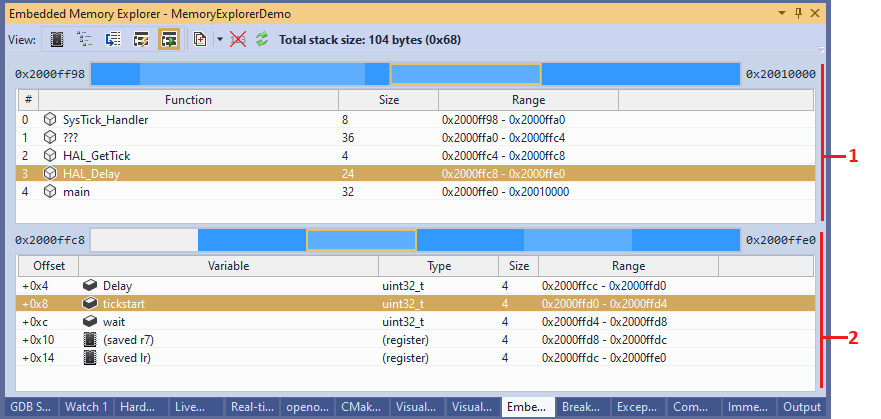
Debug Stack View
This view is only available during debugging. It provides a detailed breakdown of the current stack usage as reported by the debugger. The list of frames (1) is an extended version of the Call Stack window in Visual Studio, providing the exact size and physical location of each stack frame. The in-frame view lists all variables and saved registers inside the selected frame: