Analyzing the Stack Usage of your Firmware with VisualGDB
This tutorial shows how to analyze the stack usage of your ARM firmware using the VisualGDB’s static stack analyzer. We will create a basic FreeRTOS-based project for the STM32F4-Discovery board, will analyze the stack usage by 2 threads, show how to explore the critical path and how to account for cases like dynamic function calls.
Before you begin, install VisualGDB 5.4 or later.
- Start Visual Studio and open the VisualGDB Embedded Project Wizard:
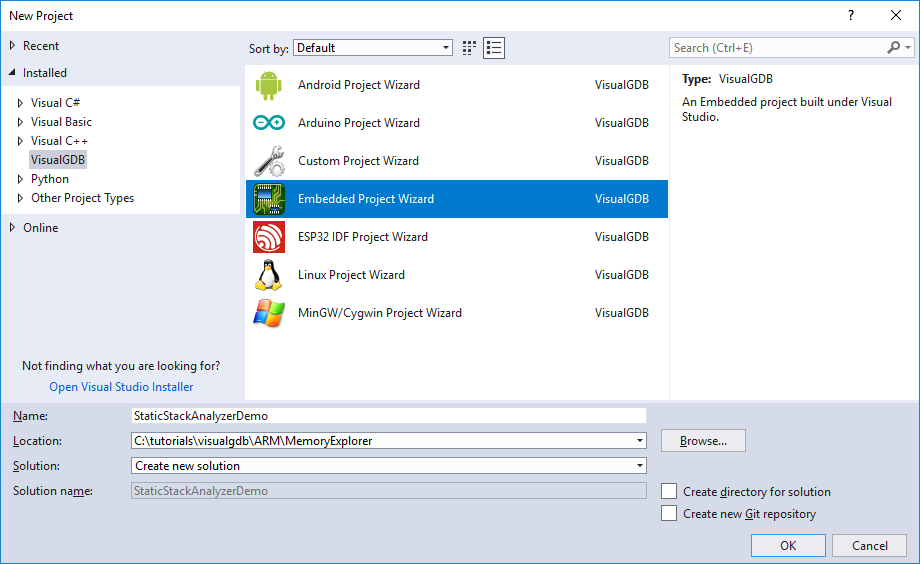
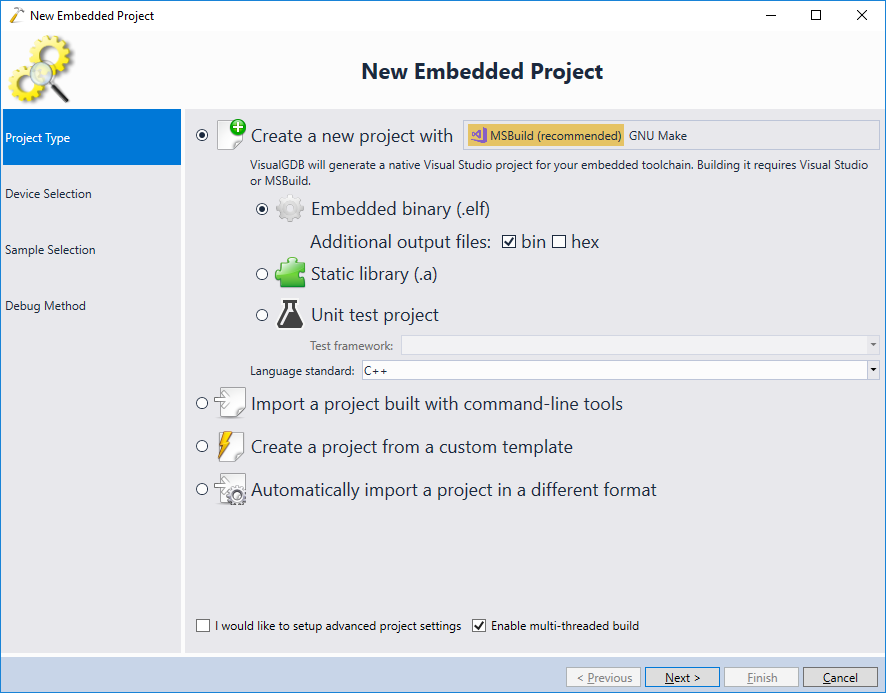
- Select “Create a new project” -> “Embedded binary”:
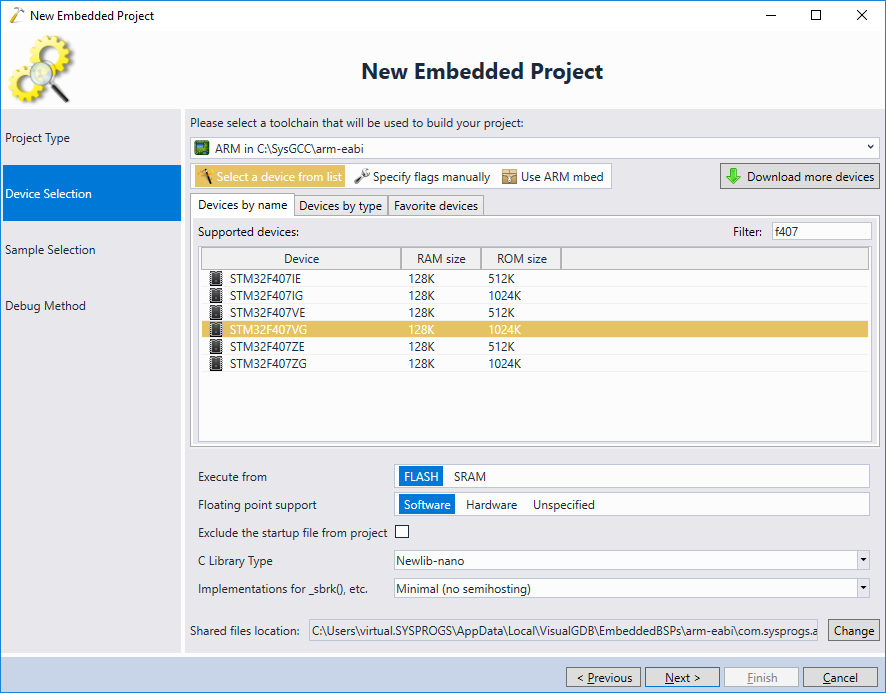
- On the next of the wizard select your toolchain and the device:
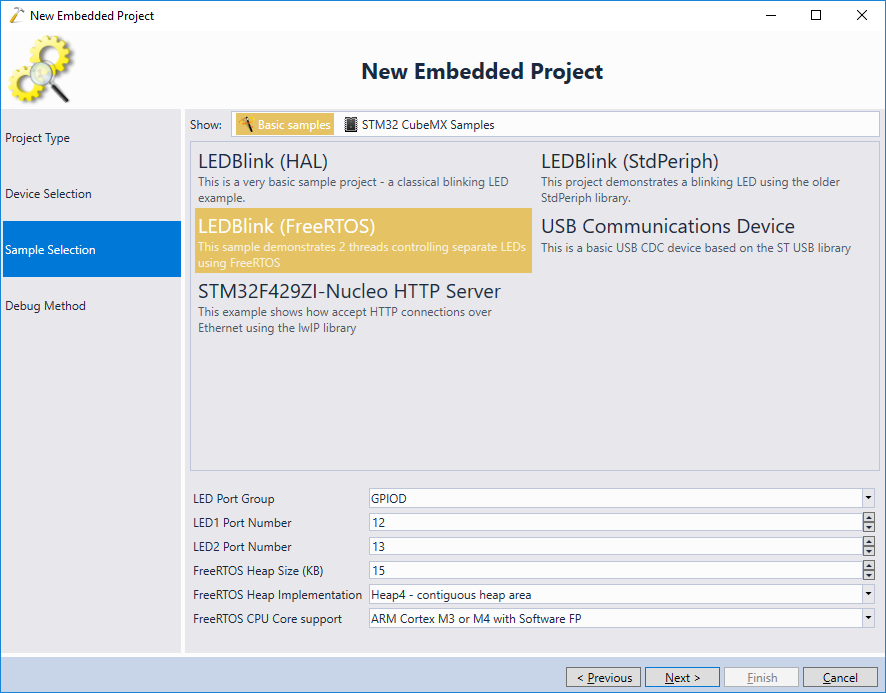
- We will demonstrate the stack analysis under FreeRTOS. Unlike single-threaded projects where the stack automatically utilizes all available space between the end of heap and the end of RAM, RTOS-based projects require explicitly sizing the stack for each thread, and hence are more prone to stack overflow. Choose the “LEDBlink (FreeRTOS)” sample and click “Next”:
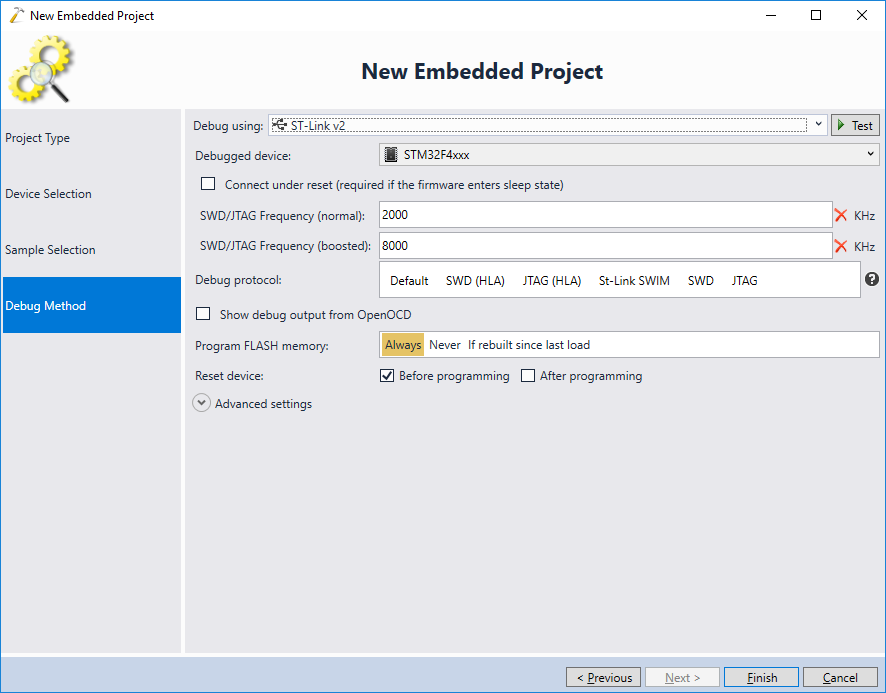
- Connect your board to the USB port and let VisualGDB automatically detect the debug settings. Then press “Finish” to generate the project:
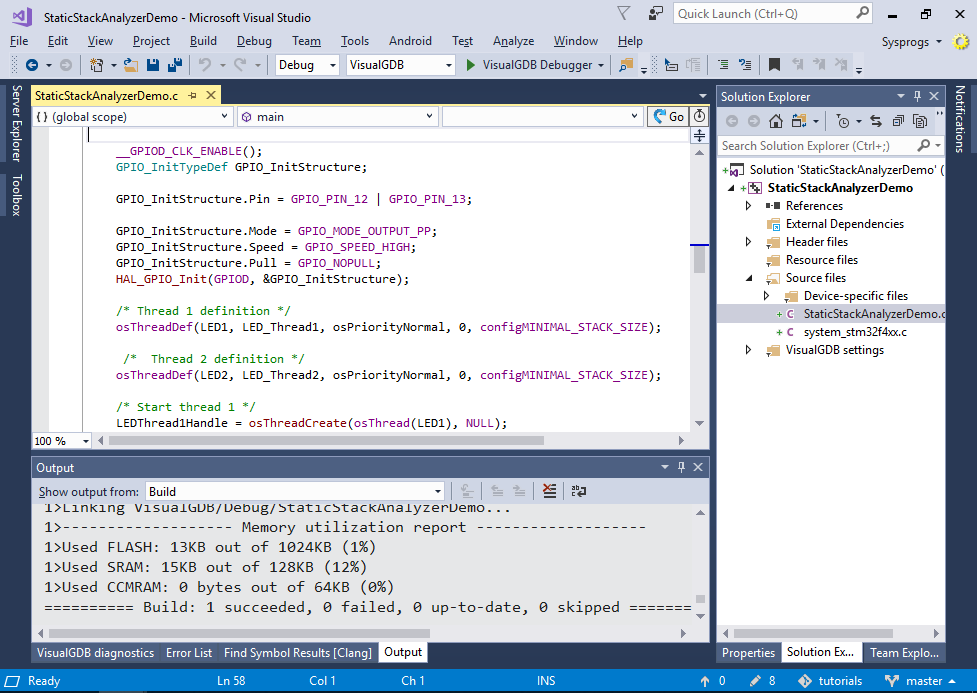
- Once the project is created, built it with Ctrl-Shift-B:
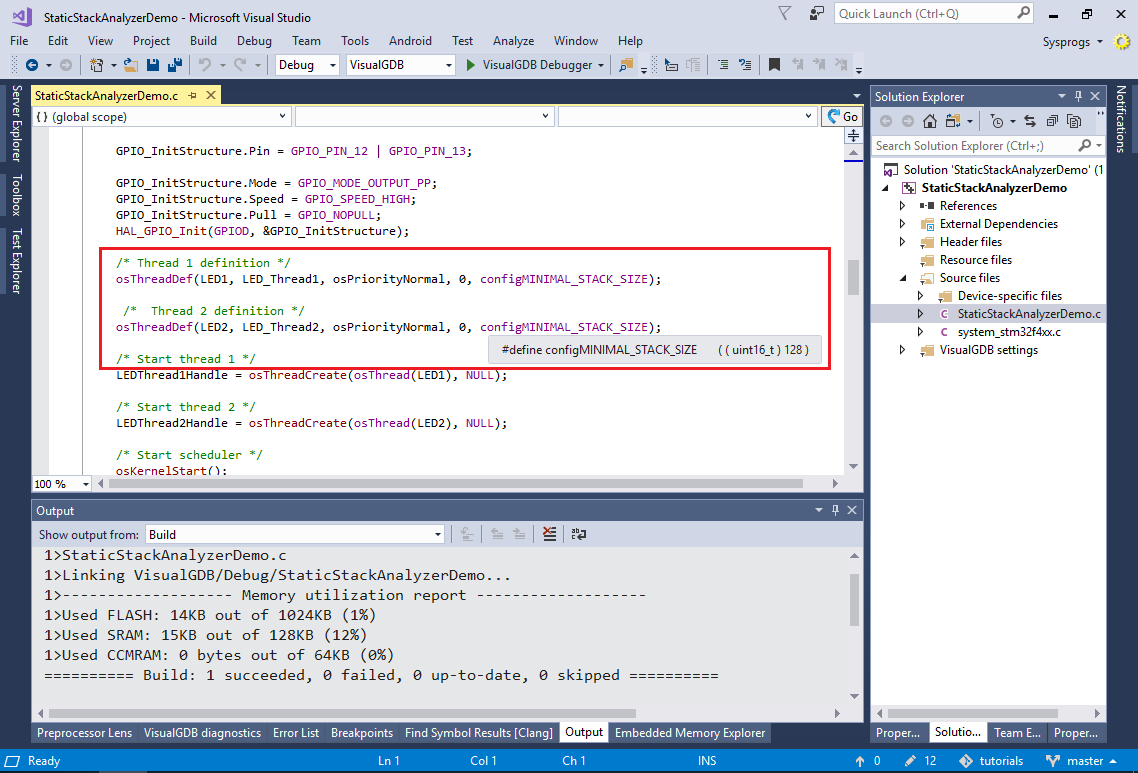
- Note how the RTOS-based projects require setting the stack size for each thread explicitly:
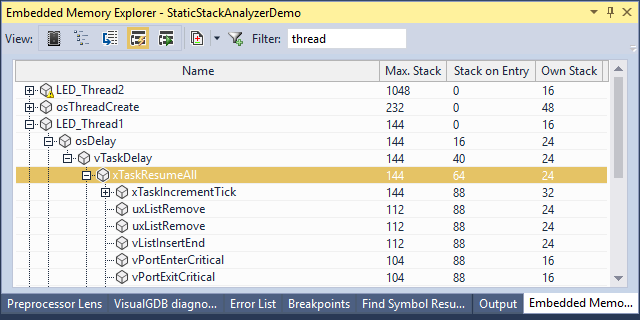
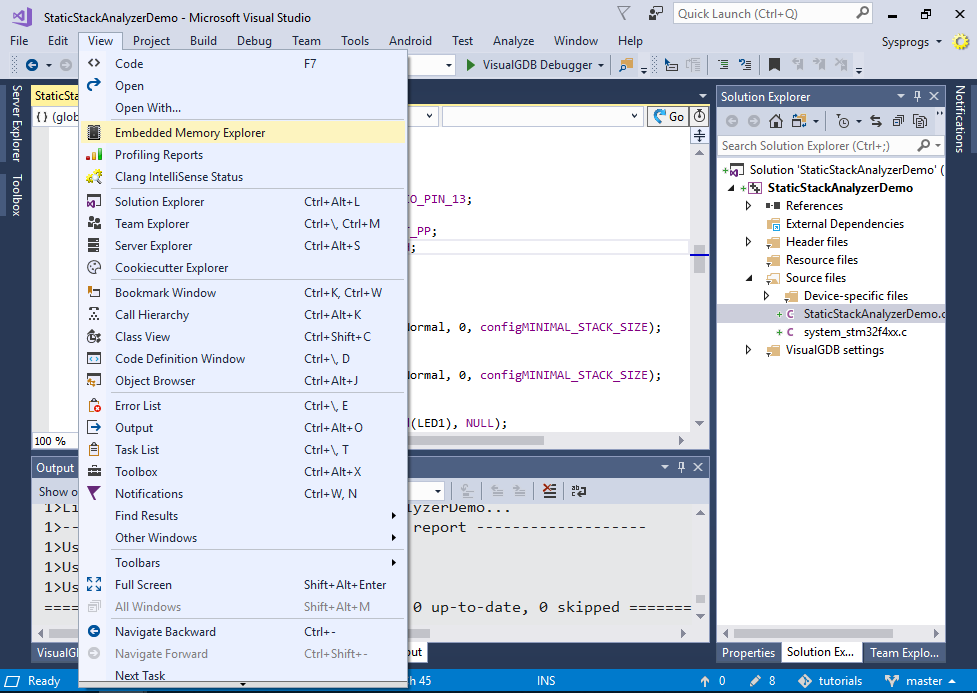
- Once the project is built, open the View->Embedded Memory Explorer and switch it to the static stack view:
- The Memory Explorer will display a list of all functions in your program and the stack usage by each of them:
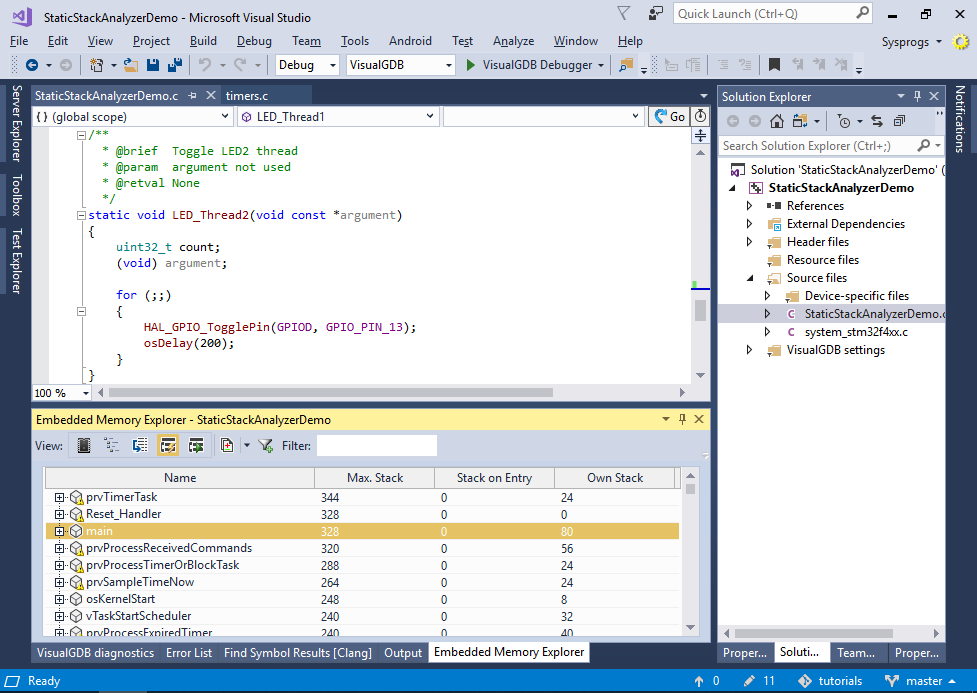 The stack usage is computed from analyzing the disassembly of each function, so it will also work for library functions. To make it easier account for rare scenarios, the code responsible for analyzing the stack-related effects of each instruction runs in a separate open-source plugin, so you can tweak it if your project uses unconventional ways of moving the stack pointer, or is not based on the ARM architecture.
 - Find the LED_Thread2 in the list and expand the critical path:
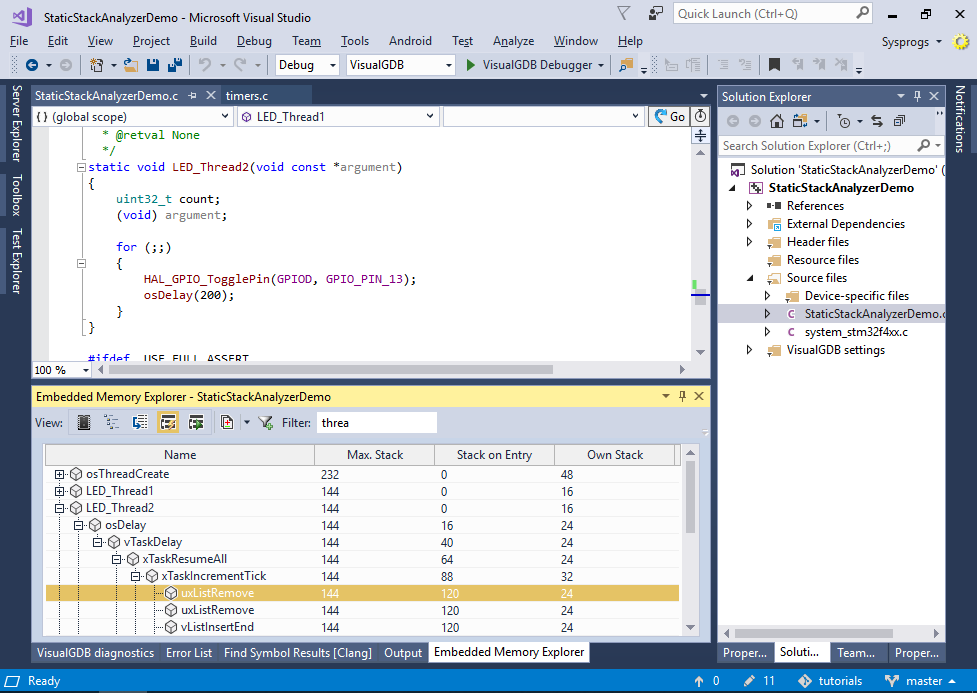 VisualGDB will show that the worst-case stack usage of the LED_Thread2() function is 144 bytes (Max. stack column), that is actually larger than the 128 bytes allocated for the stack. Each level of the critical path will show how much stack was already used by the callers by the time a certain function was called (Stack on Entry column) and how much stack does each function itself use, not counting any called functions (Own Stack column).
 - Now we will try to reproduce the worst-case scenario in debugger. Set a breakpoint in LED_Thread2() and try stepping in the functions along the critical path. Under normal circumstances, LED_Thread2() will never run for long enough time to trigger the additional processing in xTaskResumeAll() that lies on the critical path, so the stack will never get overflown. However, adding a non-trivial interrupt handler later may affect the timing of the threads, trigger this branch and ultimately lead to a crash. We will simulate it by simply using the “Set Next Statement” command to step into the block calling xTaskIncrementTick():
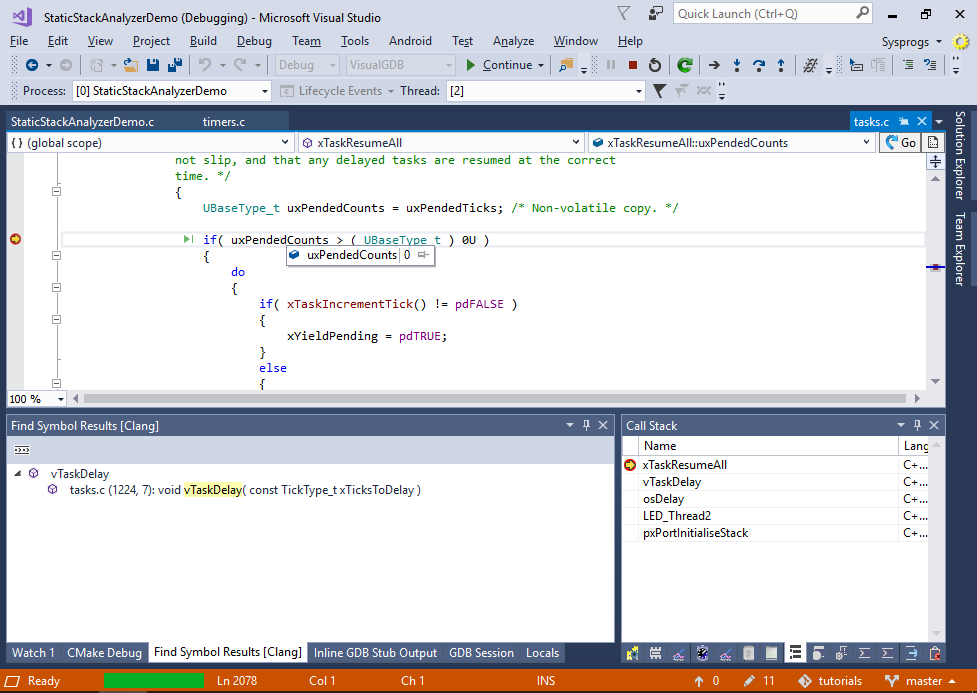
- Apply the same trick to step into uxListRemove() to get the worst-case stack layout in the debugger. Then switch the Embedded Memory Explorer to the Debug Stack view:
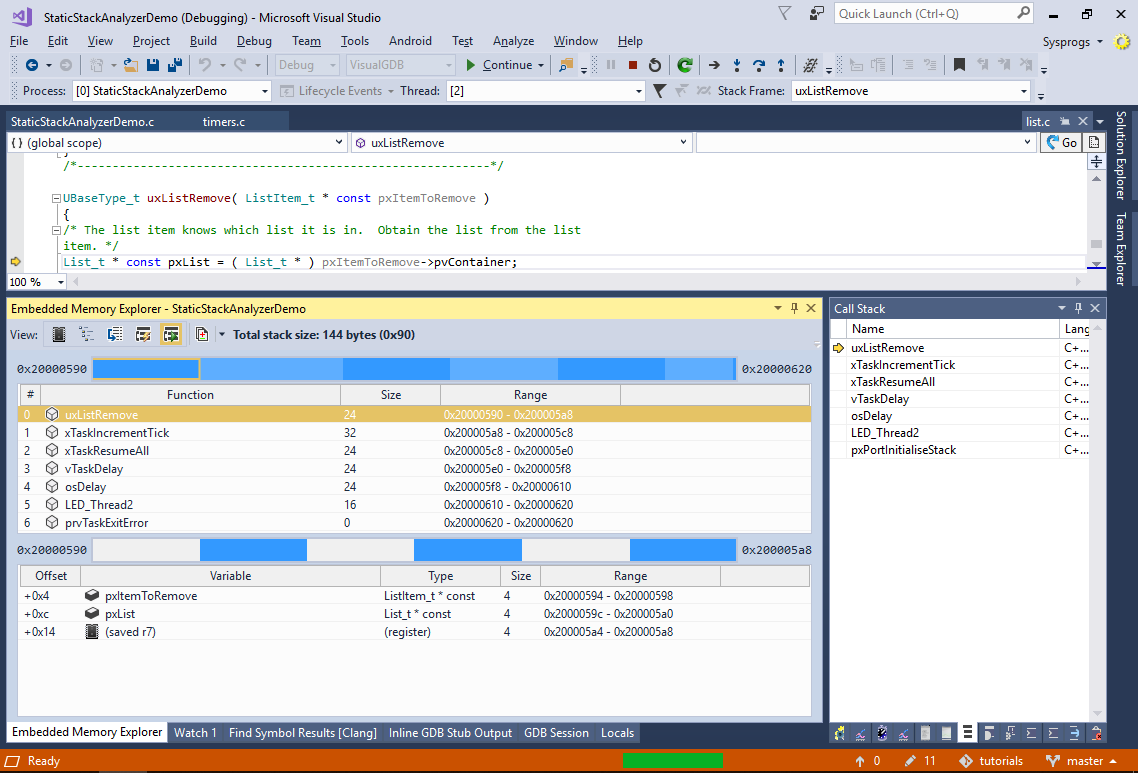 The Debug Stack view queries the exact locations of the stack frames in memory from the debugger, visualizes them and displays detailed statistics. You can switch between frames to see the variables and saved registers contributing to the stack usage by each function. The white space between the variables is either lost due to alignment, or could not be traced back to specific variables by the gdb debugger.
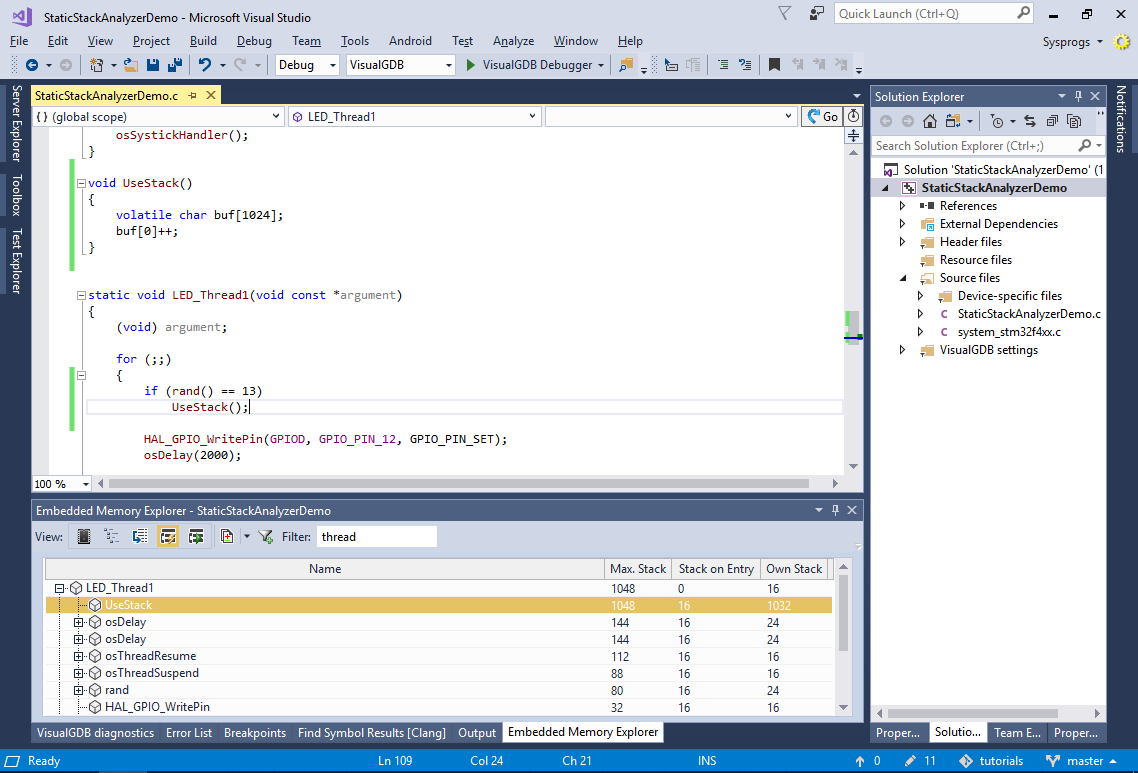
 - Now we will modify the LED_Thread1() function to dramatically increase its worst-case stack use. Add the following function to your code:
void UseStack()
{
  volatile char buf[1024];
  buf[0]++;
}
Then call it from LED_Thread1():
if (rand() == 13)
  UseStack();
- As the call to UseStack() is conditional (and the condition has a very low probability), dynamic analysis would likely not catch this. However as the static analysis always considers the worst possible call sequence, it clearly shows that the stack use by LED_Thread1() has jumped to 1048 bytes:
- Now we will complicate our scenario. Add the following global variable to your main file:
void(*g_pFunc)();
Update LED_Thread1() to set g_pFunc to UseStack() instead of calling it:
if (rand() == 13)
  g_pFunc = &UseStack;
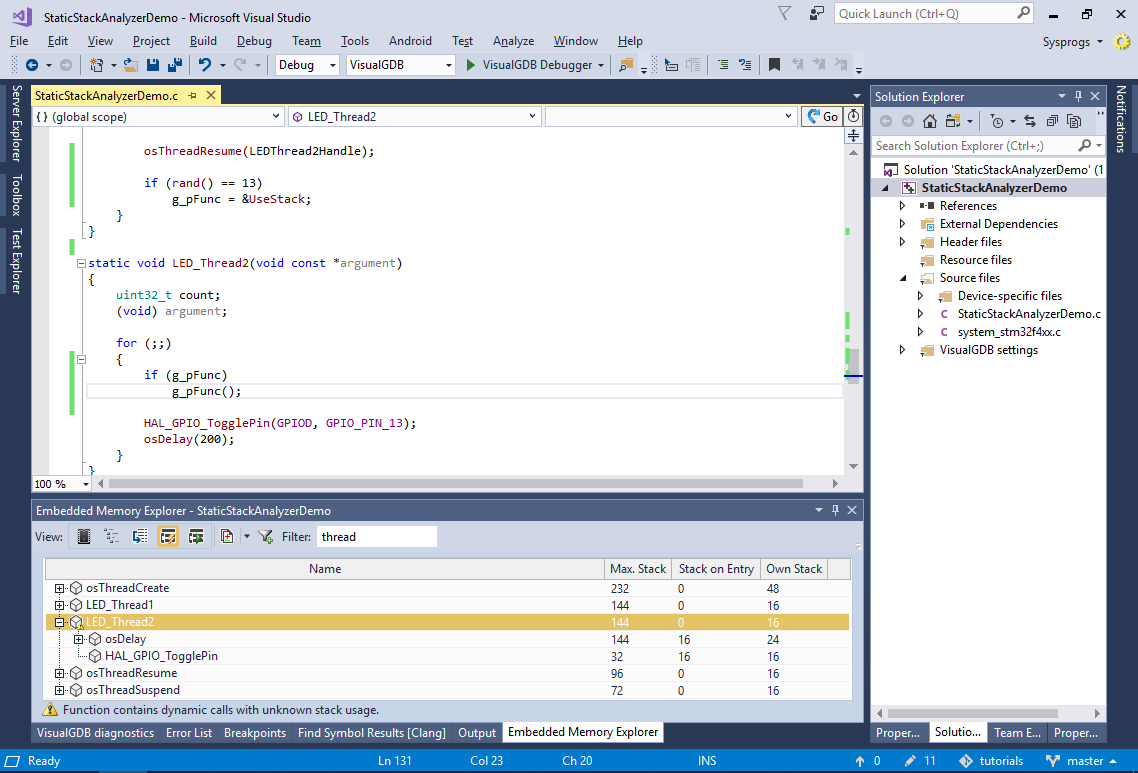
- Finally call the function pointer from LED_Thread2():
if (g_pFunc)
  g_pFunc();
- The stack analyzer won’t be able to automatically unwind this, so it will show the stack usage for LED_Thread2() as 144, but will warn that it contains dynamic calls:
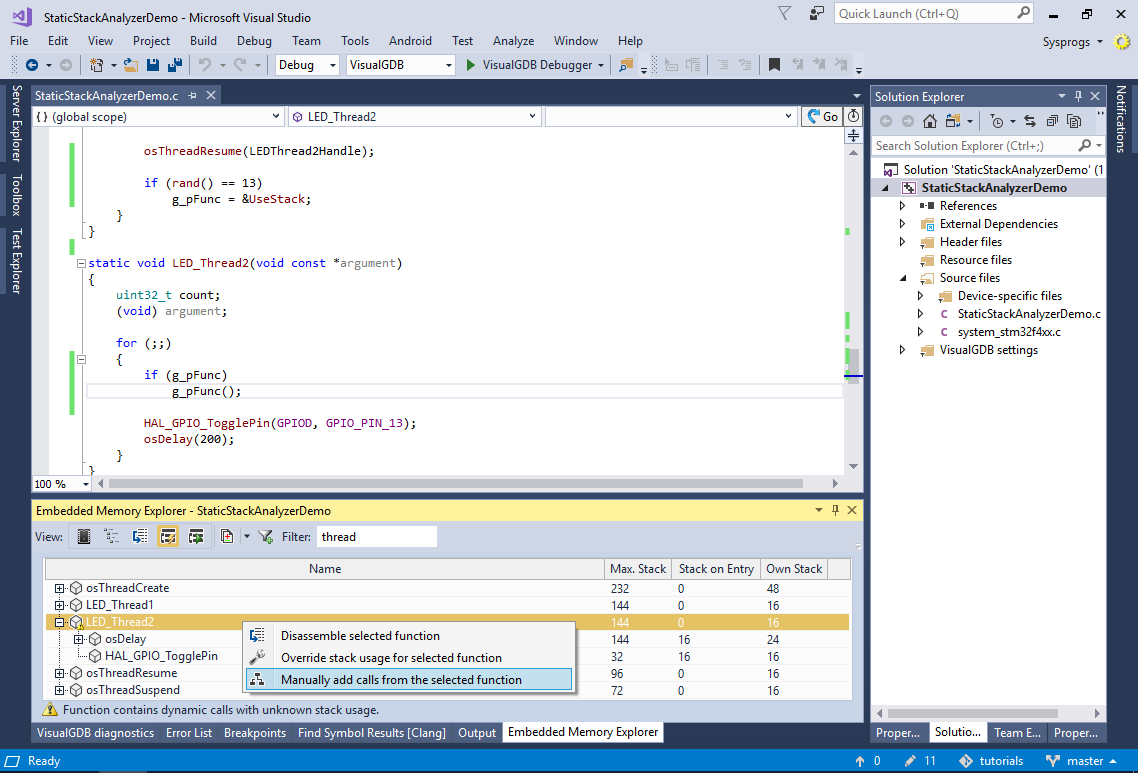
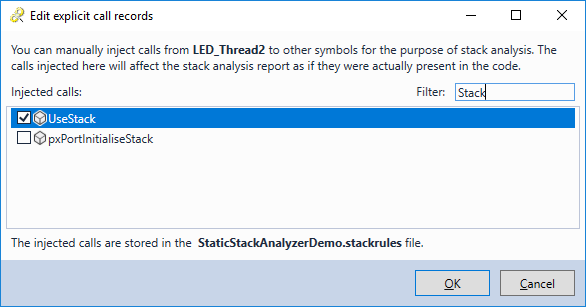
- One way to handle this automatically would be to extend the stack analyzer plugin to check for possible values written to a certain variable, but that would still not cover all the cases. Instead, right-click on LED_Thread2() and select “Manually add calls from the selected function”:
- Check the “UseStack” symbol and click “OK”:
- VisualGDB will now recompute the stack usage for LED_Thread2() as if it directly called UseStack():
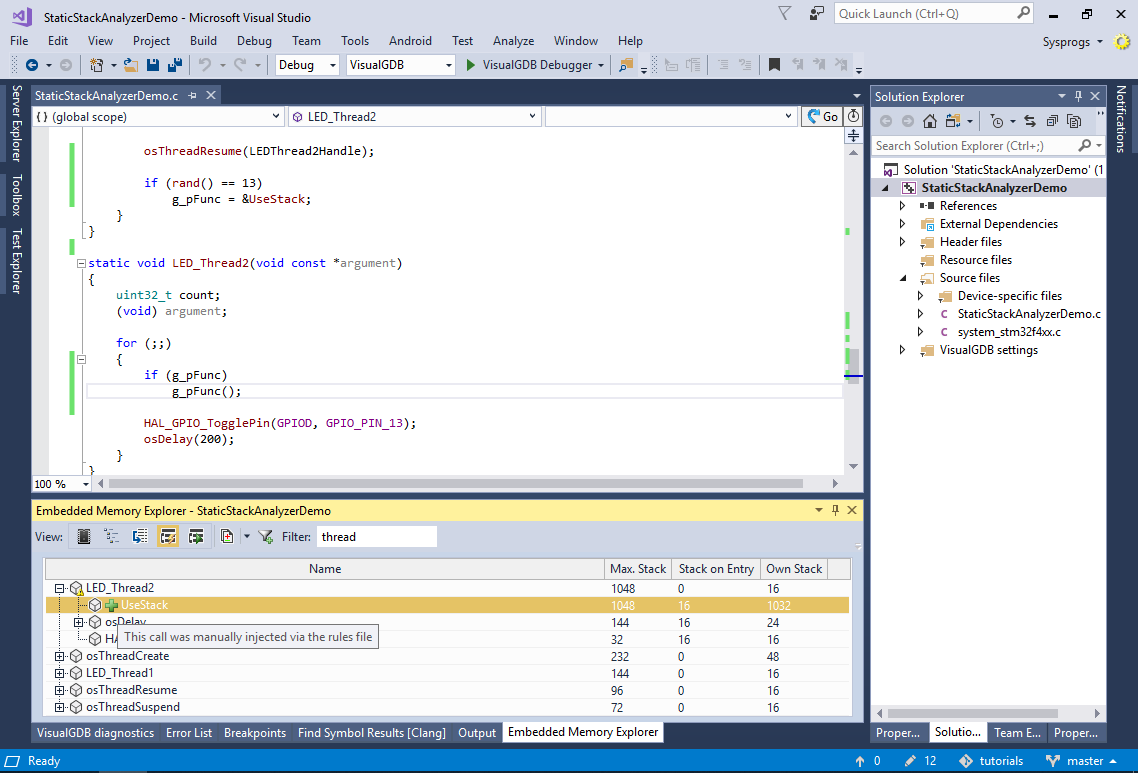
- VisualGDB stores the manually specified calls in a text file called <Project Name>.stackrules. It uses a very straight-forward format, so you can generate/update those rules programmatically:
#This file stores explicit relations between functions
#Format:
#<function>:[<optional stack size override>]
#<tab><called function>:[<optional stack usage at the time of call>]
LED_Thread2
  UseStack
You can find the source code for the project shown in this tutorial in our tutorial repository on GitHub.