Developing PIC32 Projects with VisualGDB
This tutorial shows how to create, build and debug applications for the PIC32 devices with Visual Studio and VisualGDB.
Before you begin, make sure you install MPLAB X (that includes the PIC32 compiler) and VisualGDB 5.6 or later. Then, connect the following signals on your chip to your JTAG debugger:
| Signal | JTAG20 Pin | Pin on PIC32MX534F064H | Pin on PIC32MM256GPM064 |
| TDI | 5 | B13 | RB3 |
| TDO | 13 | B11 | RC9 |
| TMS | 7 | B10 | RB9 |
| TCK | 9 | B12 | RB8 |
| RESET | 3 | MCLR# | MCLR# |
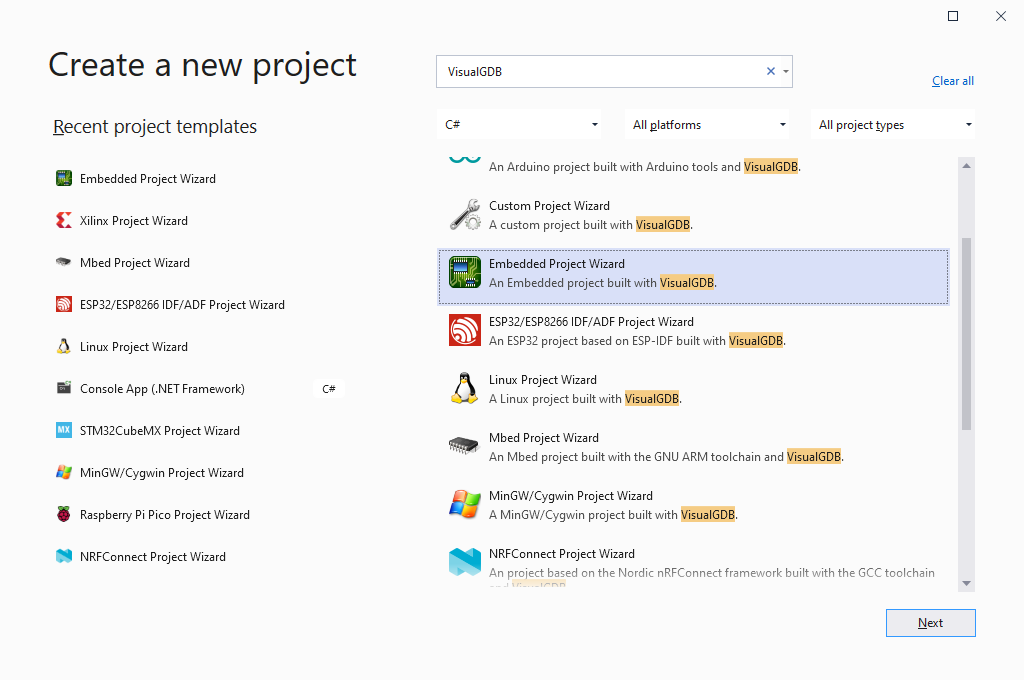
- Start Visual Studio and open the VisualGDB Embedded Project Wizard:
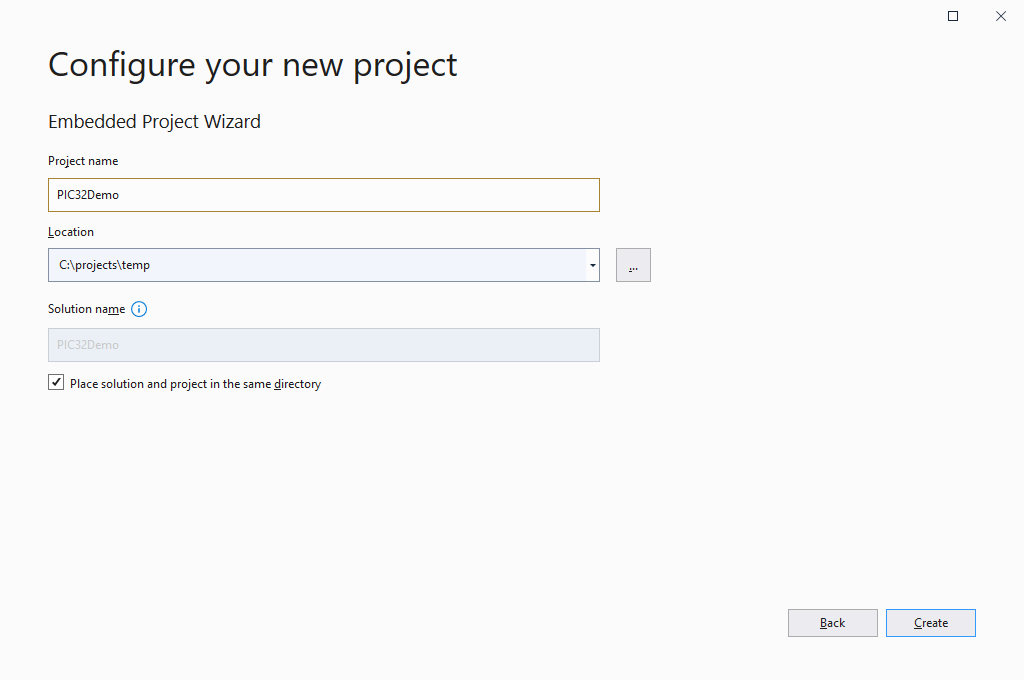
- Enter the name and location for your project:
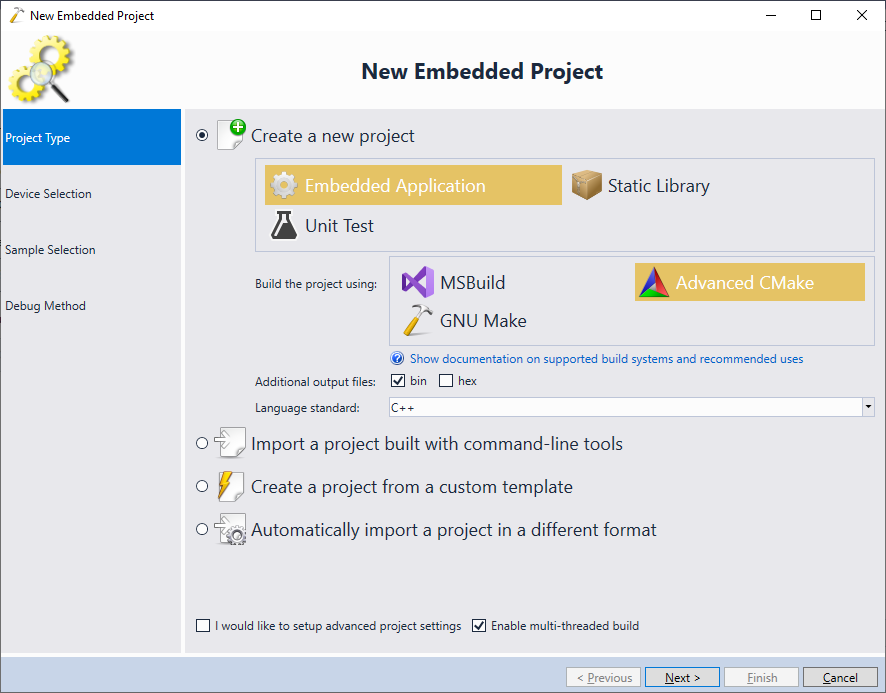
- Select “Create a new project -> Embedded Application” and pick the build system you would like to use. We recommend Advanced CMake or MSBuild for most scenarios:
- On the next page locate your PIC32 toolchain. VisualGDB can automatically detect the PIC32 compiler from the MPLAB X via registry. If it doesn’t appear in the toolchain list, check the C:\Program Files (x86)\Sysprogs\VisualGDB\Rules\KnownToolchains.xml file for the exact registry key used by VisualGDB to find it:

- Once you select the PIC32 compiler, VisualGDB will display the list of supported devices. Pick your device and click “Install” to download the corresponding BSP:

- Once the BSP is installed, press “Next” to proceed to the next page:

- Select the “Blink” sample project and click “Next”:
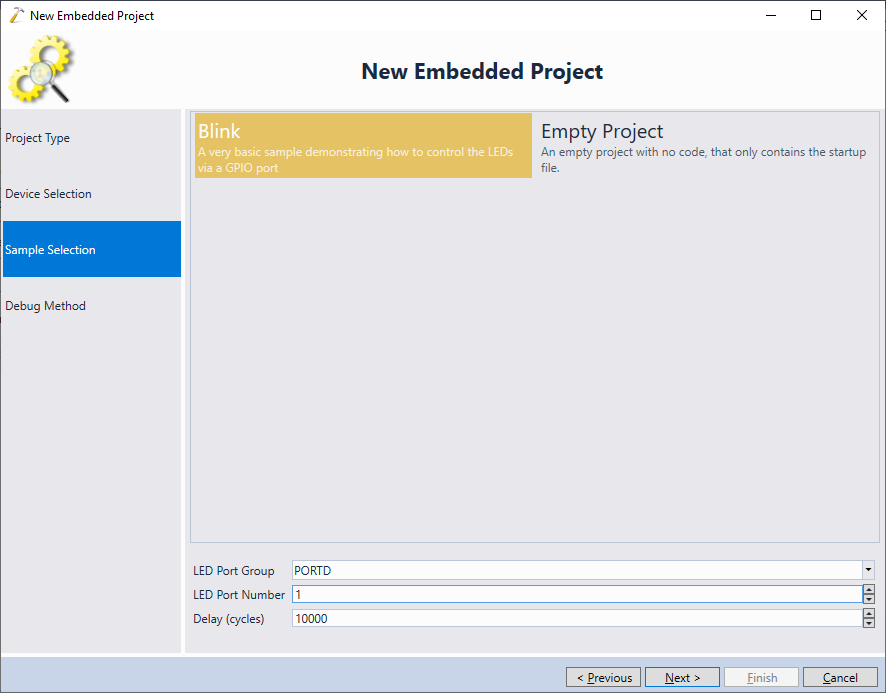 You can optionally set the LED port to match your board pinout, or just proceed with the default settings if you plan to replace the main() contents with something else.
 - On the last page of the wizard select your debug method. As of November 2021, VisualGDB supports the following methods for PIC32:
Debug Method Supported Devices Remarks Segger J-Link Most PIC32MX devices Works out-of-the-box, requires Segger J-Link hardware. Supported by Segger. OpenOCD PIC32MX, PIC32MM Open-source tool without technical support. Works with most JTAG debuggers, however the PIC32MX support is somewhat unreliable (PIC32MM support is better). May require extra troubleshooting/patching. 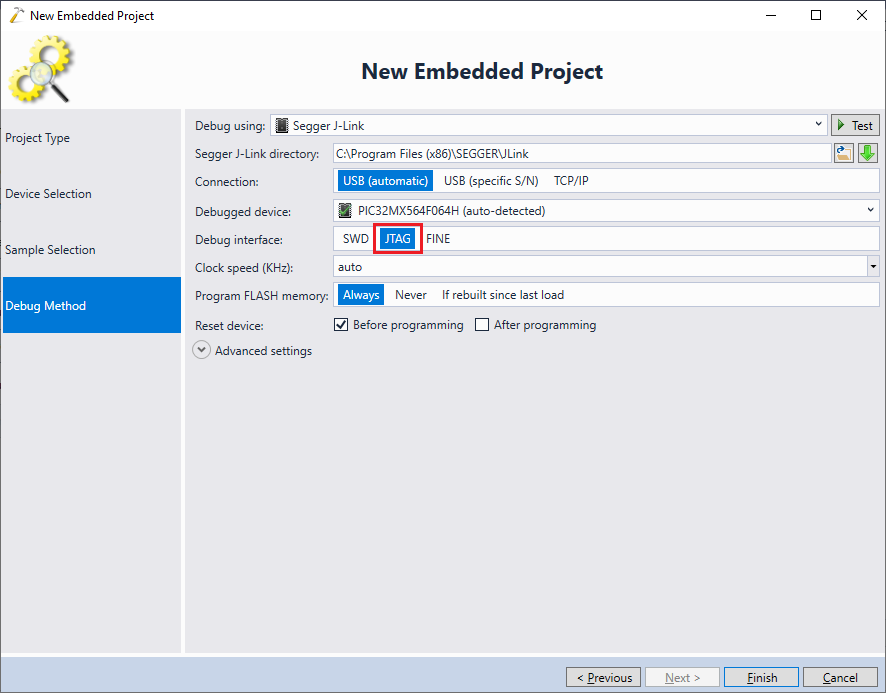
- Press “Finish” to generate the project. Build it by pressing Ctrl-Shift-B. Note how VisualGDB automatically picks up the memory layout from the device definition, and shows the memory utilization:
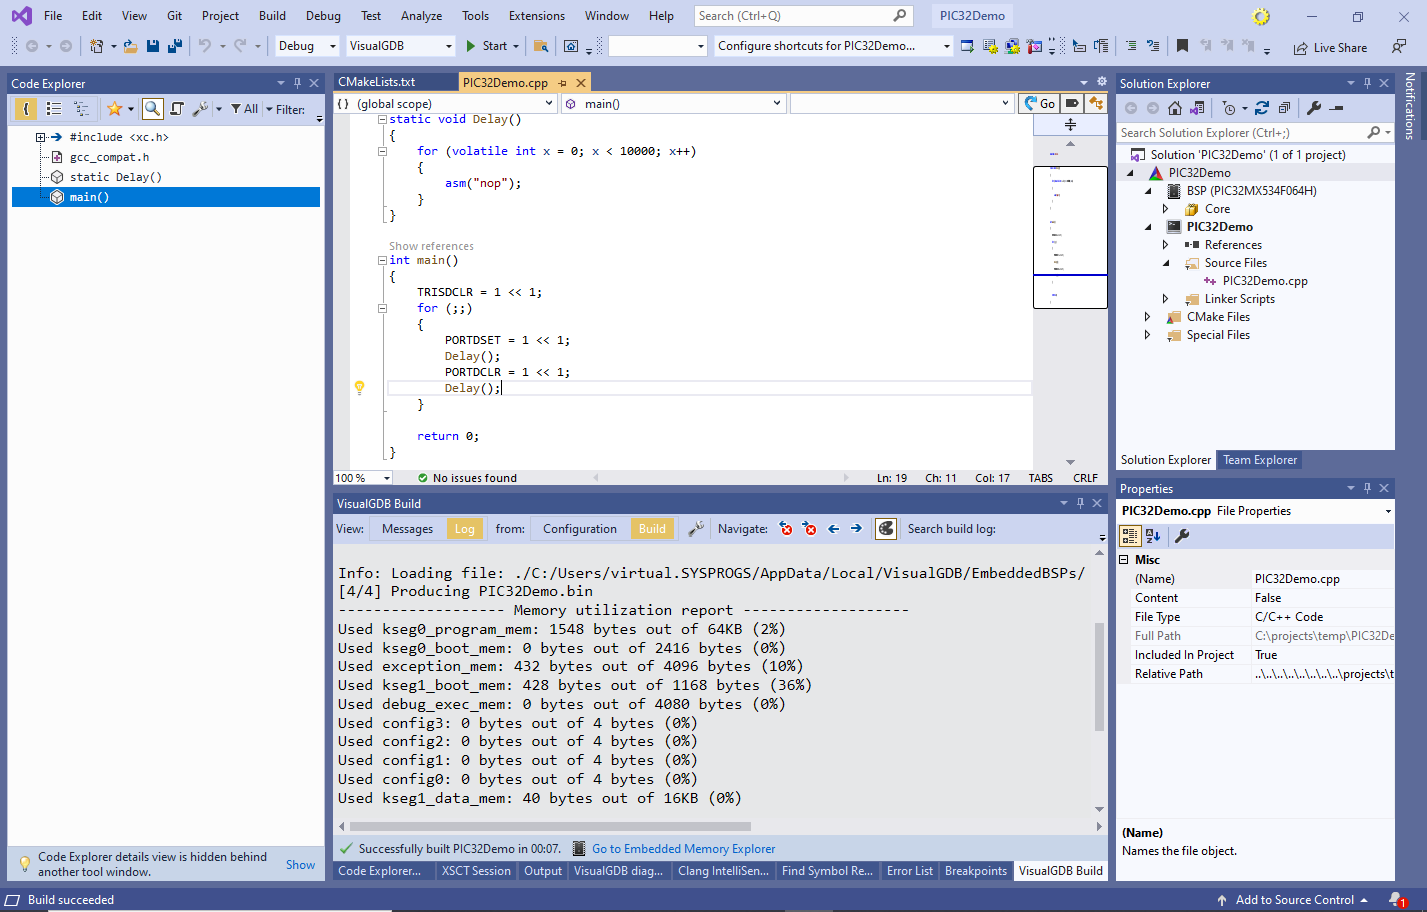
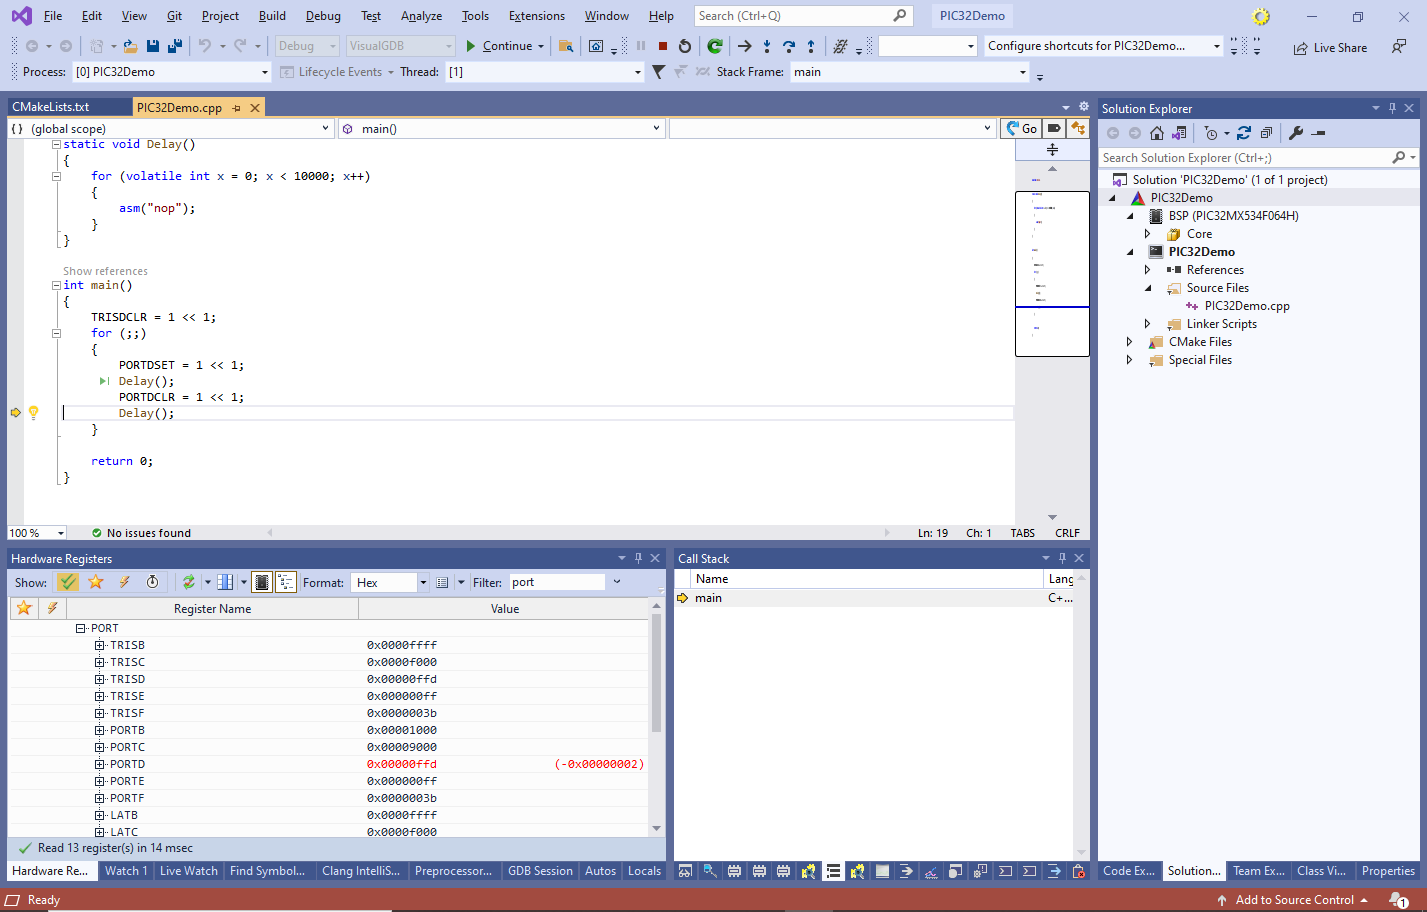
- Set a breakpoint before a call to Delay() and press F5 to begin debugging. The breakpoint will trigger, allowing you to evaluate variables and view the hardware registers: