Using Live Watch on ESP32-C3 Devices
This tutorial shows how to use Live Watch with the ESP32-C3 devices. Unlike the regular ESP32 chip that uses the Xtensa core, ESP32-C3 is based on RISC-V, and hence allows accessing the device memory without stopping the CPU, allowing VisualGDB to inspect the values of the global variables without stopping the target.
As of ESP-IDF 4.3.2, using Live Watch requires patching the components/hal/esp32c3/include/hal/cpu_ll.h file to replicate this commit. We will show how to do it later in the tutorial.
Before you begin, make sure you install VisualGDB 5.6 or later, and update the ESP32 Debug Package to the latest version.
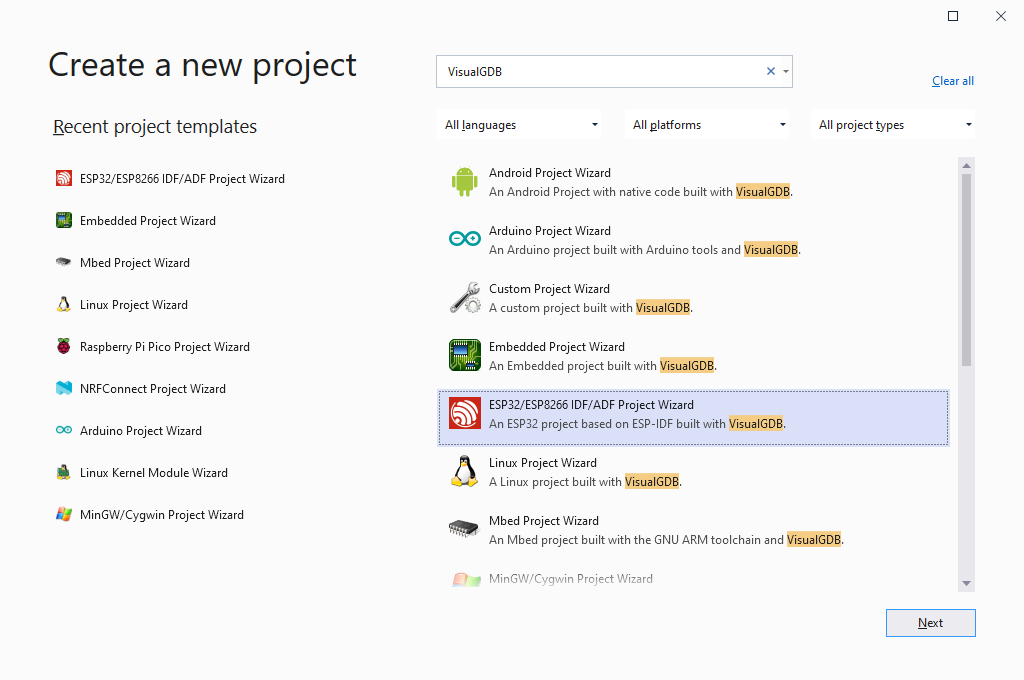
- Start Visual Studio and open the New Project window. Then, locate the VisualGDB ESP32 Project Wizard:
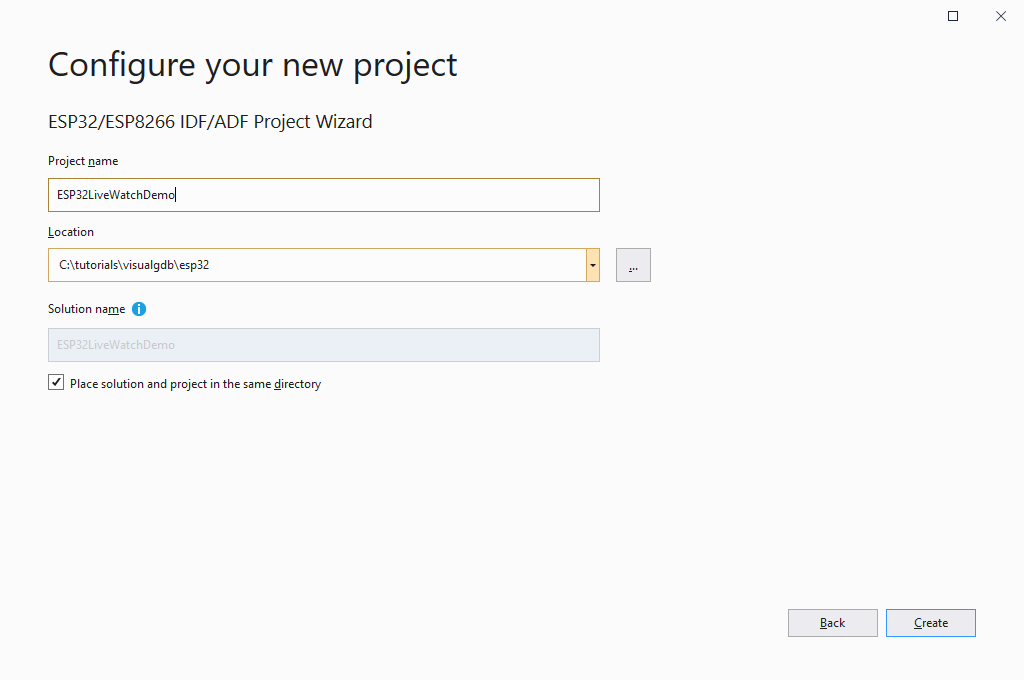
- Enter the name and location for your project, then press “Create”:
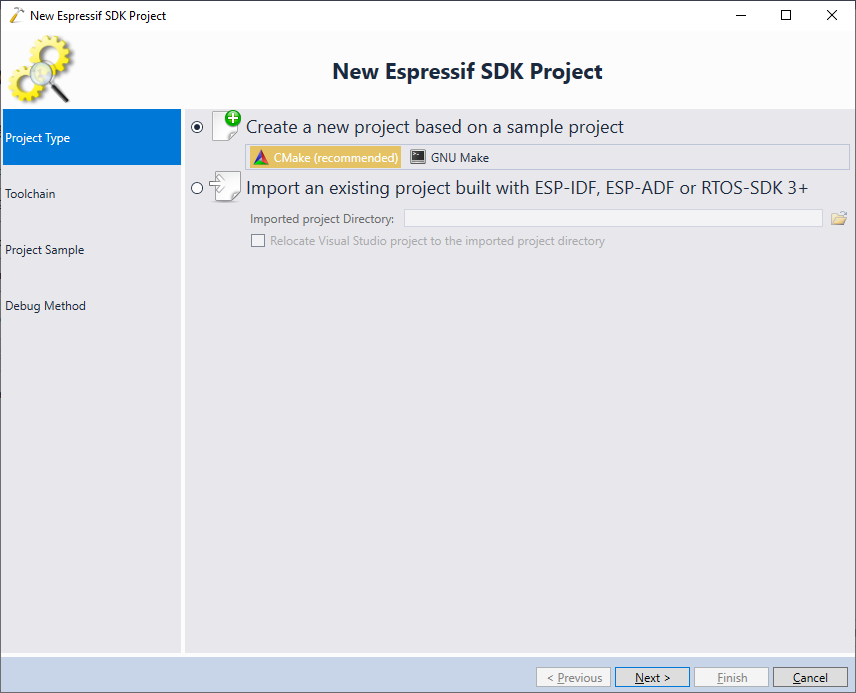
- Proceed with the default project type (new CMake-based project):
- On the next page of the wizard, select your ESP32 toolchain and pick the ESP32C3 device:
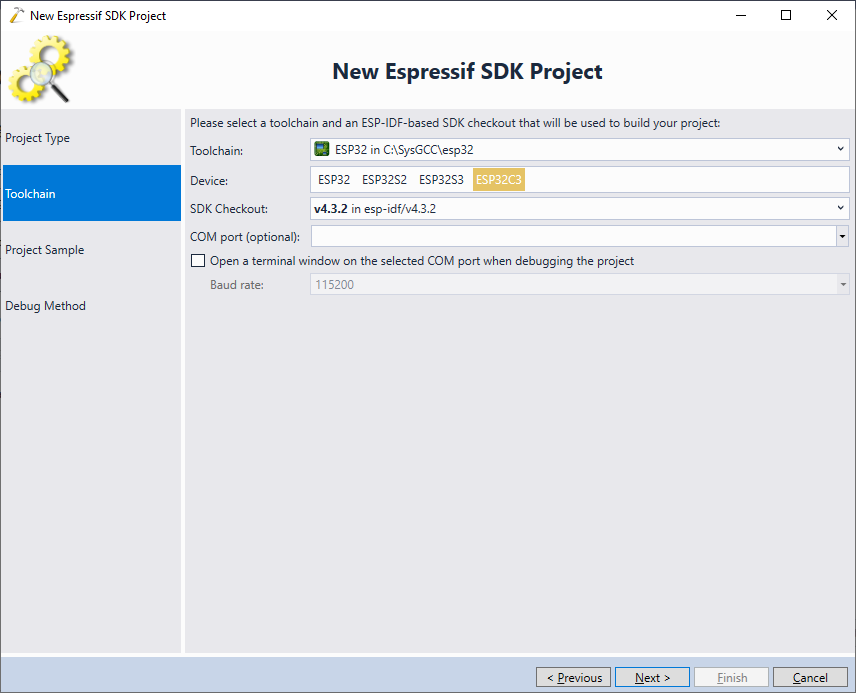 Note that Live Variables will NOT work on the regular ESP32 and ESP32S2/S3 devices, as they utilize a different CPU.
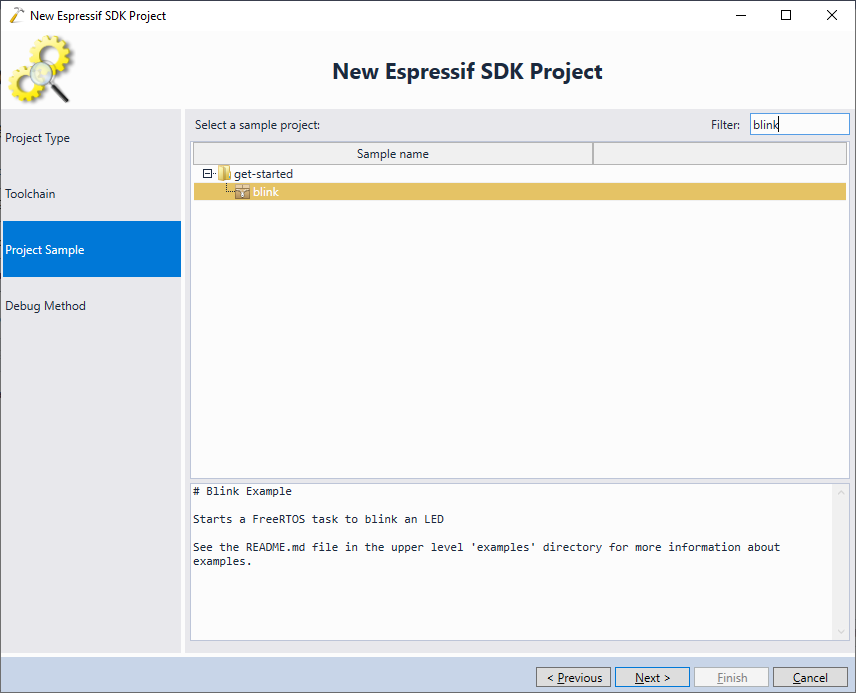
Update: For better compatibility with the latest ESP32 tools, we recommend selecting the consolidated toolchain instead. - Pick the project sample you would like to clone. In this tutorial, we will use the most basic “blink” sample:
- Connect your device to the USB port as shown in this tutorial and let VisualGDB detect it. Then, select it in the “Debug Using” field and press “Test” to verify the connection:
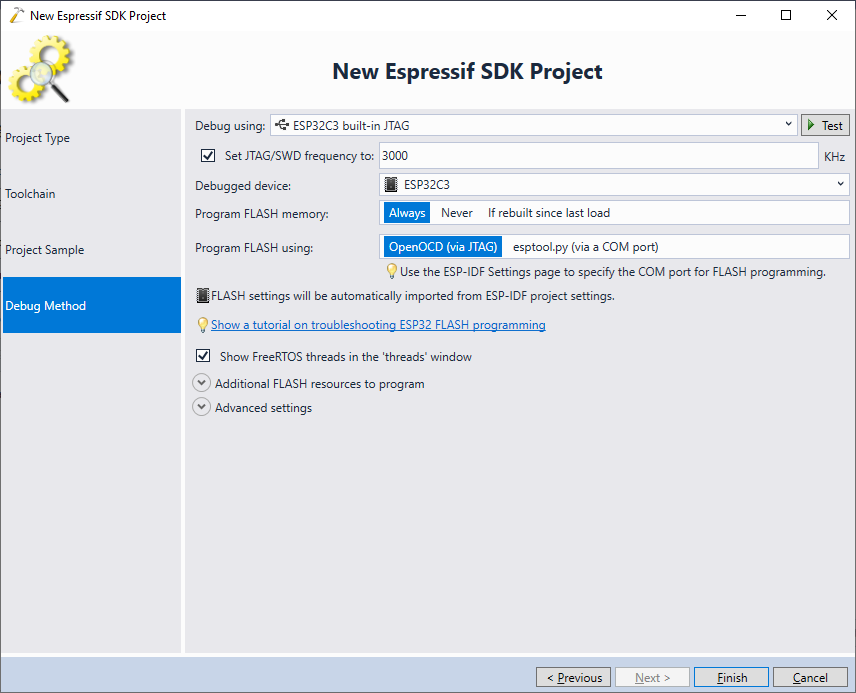 You can safely ignore the warning about all device registers being 0. It is normal for ESP32-C3 devices.
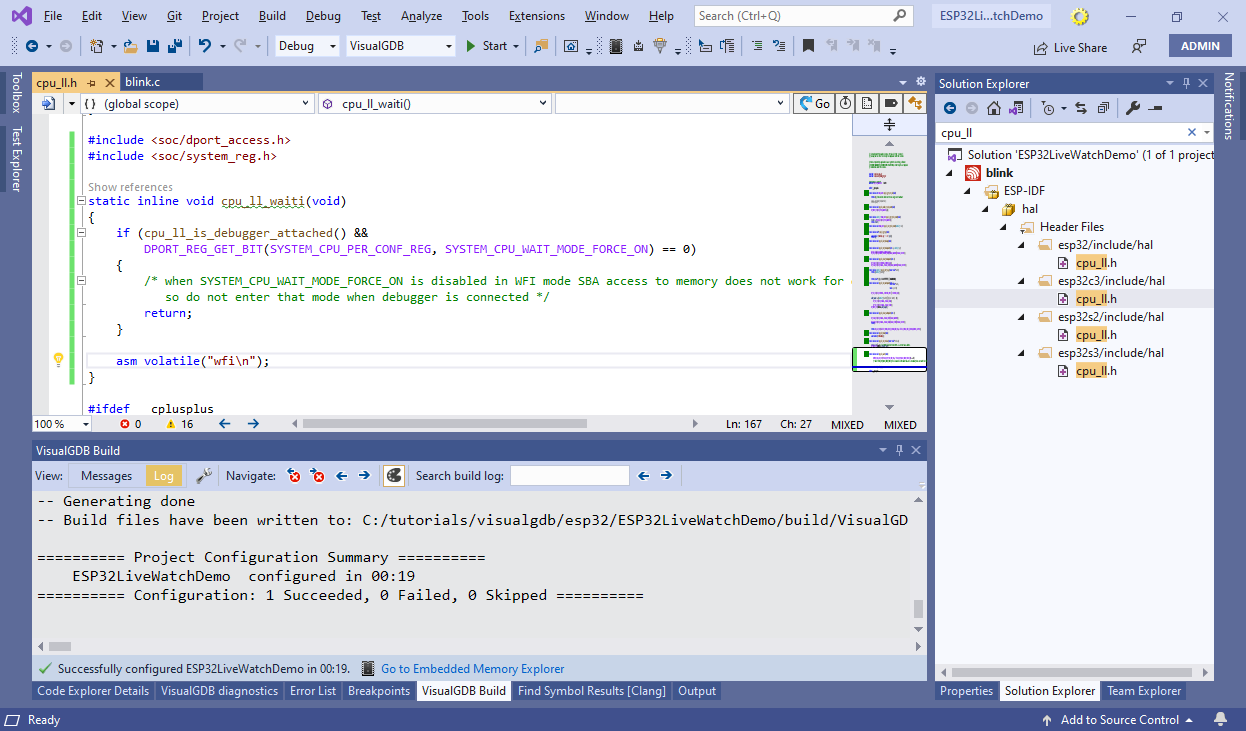
 - Press “Finish” to generate the project. Before you build it, we would need to patch the ESP-IDF to prevent the CPU from entering the sleep mode while the debugger is connected (otherwise Live Watch will not work). To do that, locate the esp32c3/include/hal/cpu_ll.h file and replace the cpu_ll_waiti() function with the one matching this commit:
#include <soc/dport_access.h>
#include <soc/system_reg.h>

static inline void cpu_ll_waiti(void)
{
    if (cpu_ll_is_debugger_attached() &&
        DPORT_REG_GET_BIT(SYSTEM_CPU_PER_CONF_REG, SYSTEM_CPU_WAIT_MODE_FORCE_ON) == 0)
    {
        return;
    }

    asm volatile("wfi\n");
}
- Add a global g_Counter variable to the main source file and update the app_main() function to periodically increment it:
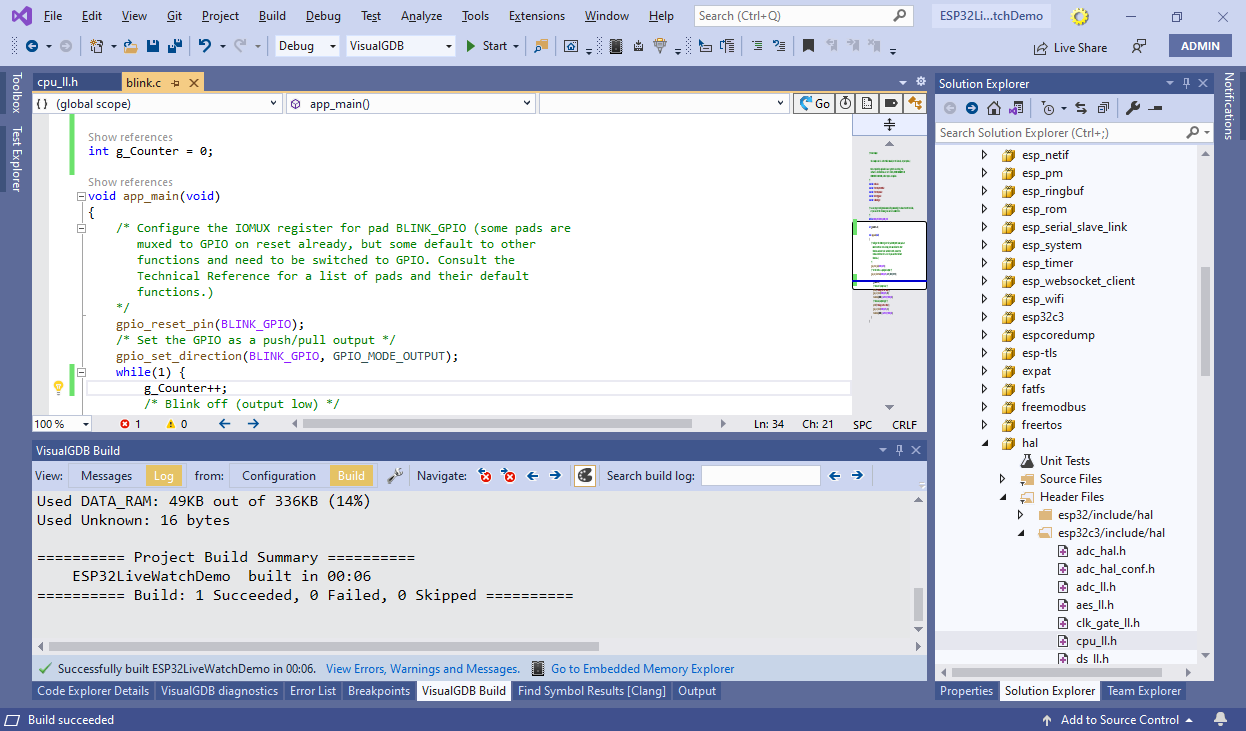
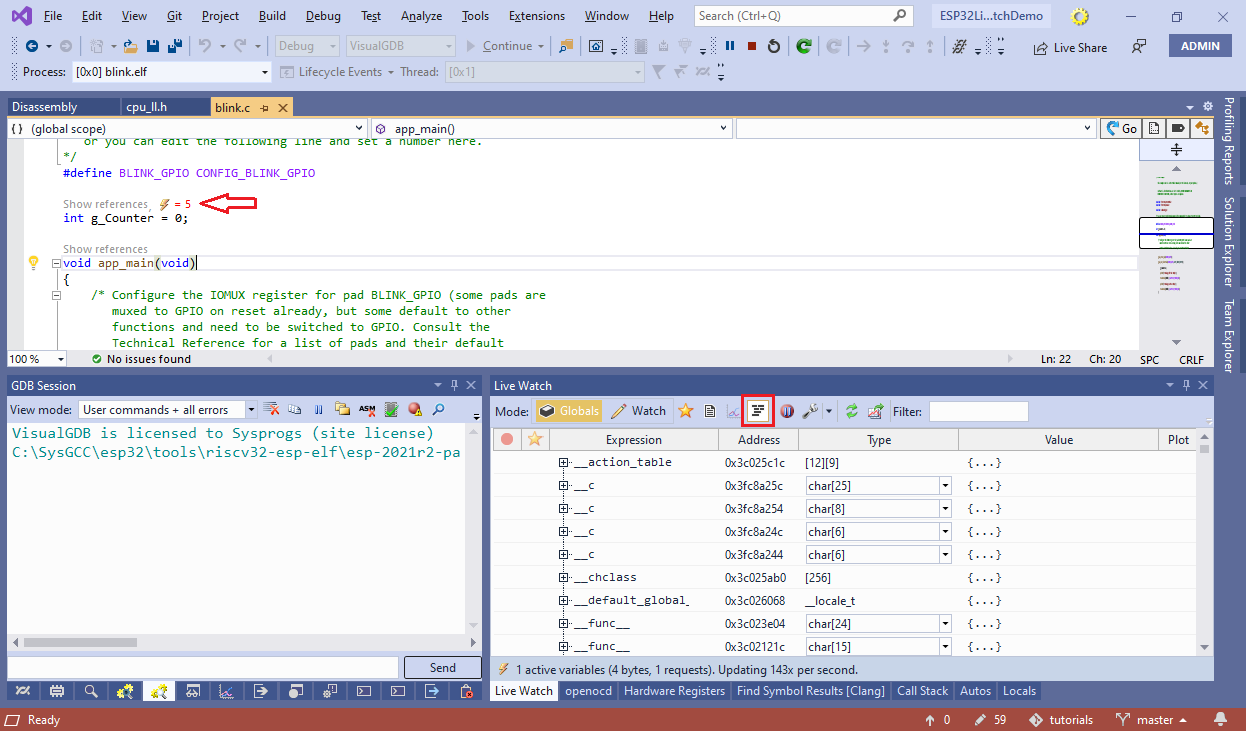
- Press F5 to build the project and start debugging it. As long as you have in-place display enabled in Live Watch, it will immediately display the value above the variable declaration:
 Note that if all values show the value of 0, double-check that you have patched the correct cpu_ll.h file, and rebuilt the project after doing so.
 - Click on the live value to locate the variable in the Live Watch window. You can use the Globals view to quickly locate other variables or flag them as favorite:
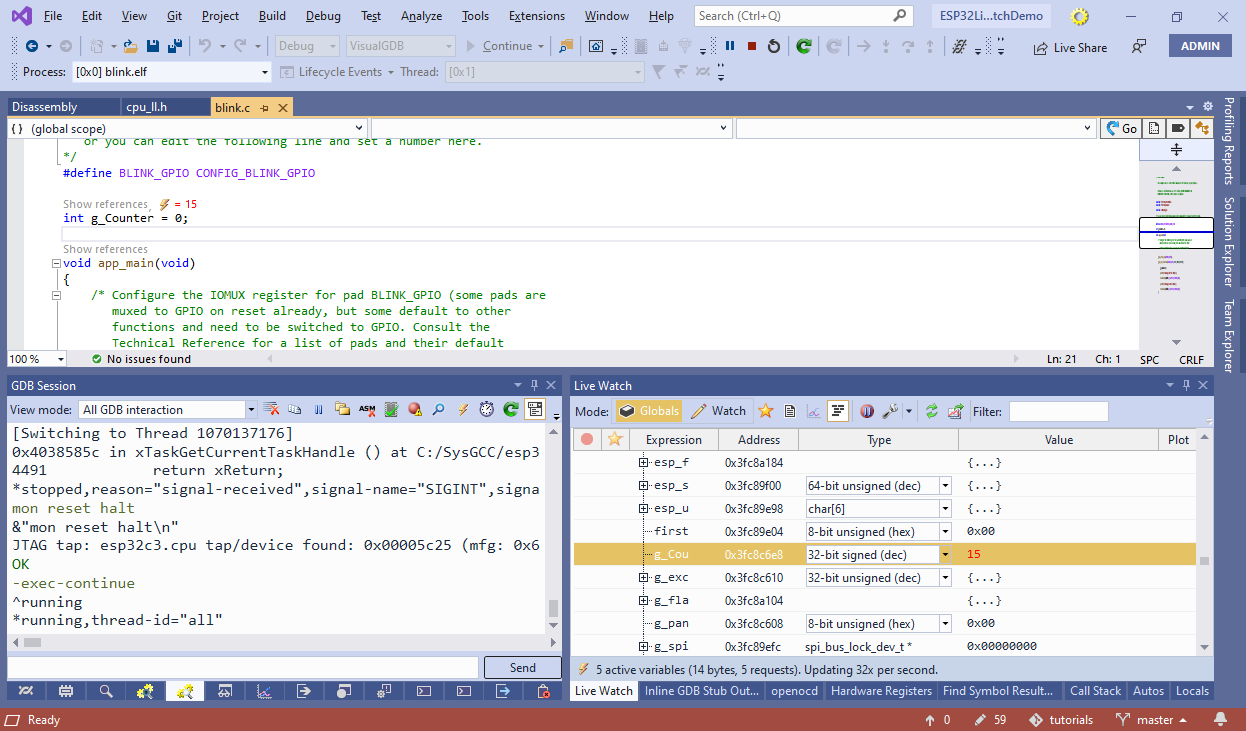 You can also use the Watch view to observe the values of specific variables.
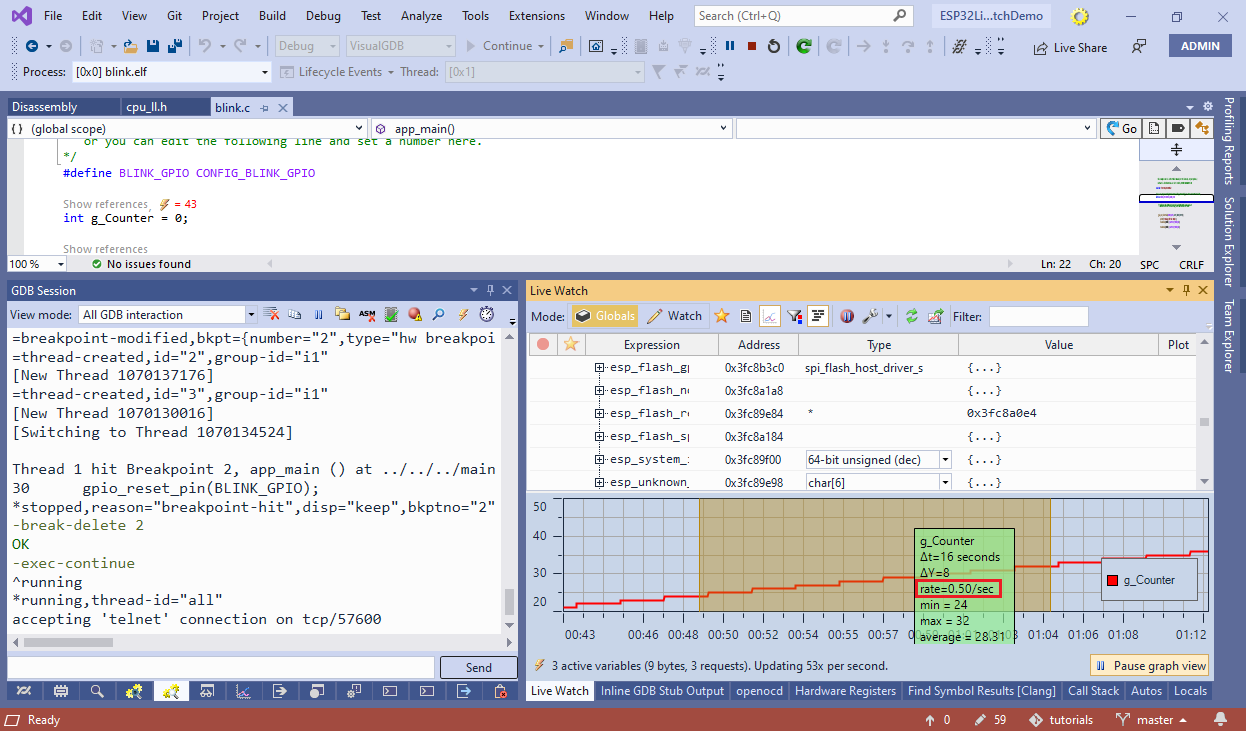
 - Click in the “Plot” column next to the g_Counter row. VisualGDB will display how the value of g_Counter changes over time:
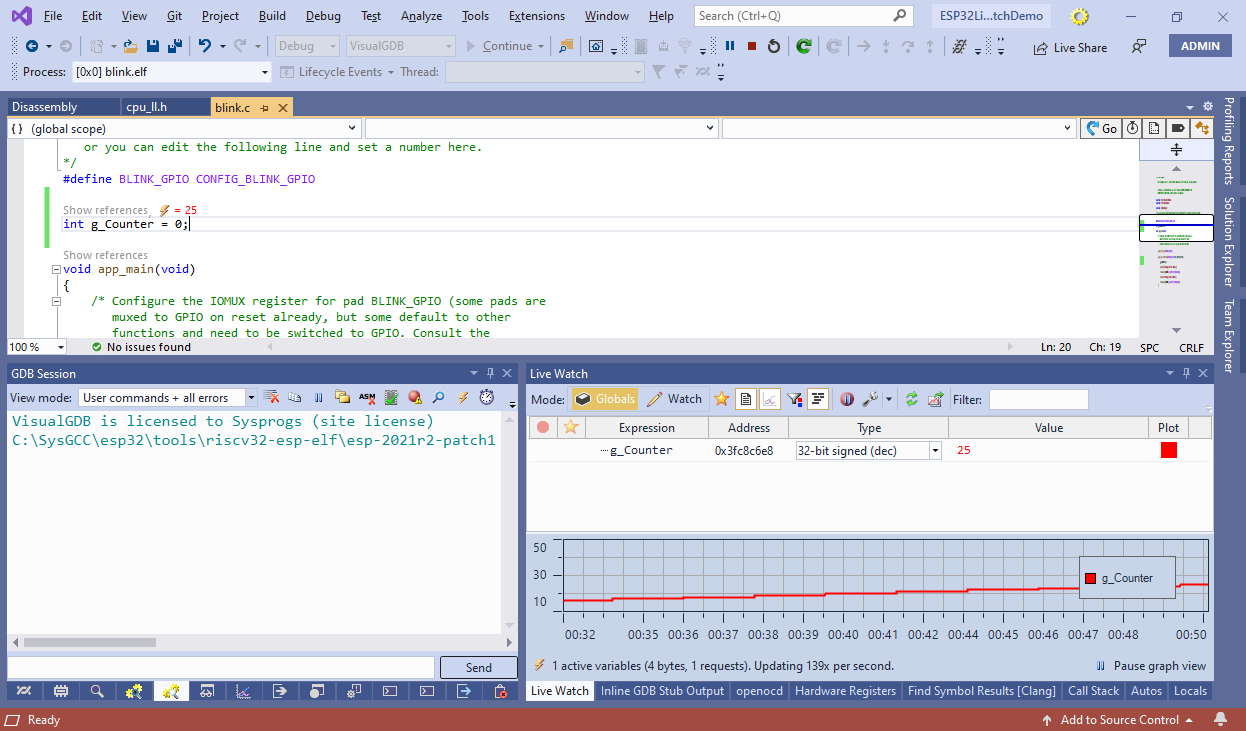
- You can use the plot view to conveniently measure various parameters (e.g. how fast the value changes over time):