Live Variables / Live Watch
The Live Watch feature (previously known as Live Variables) allows examining the state of global variables in your embedded program without stopping the program execution: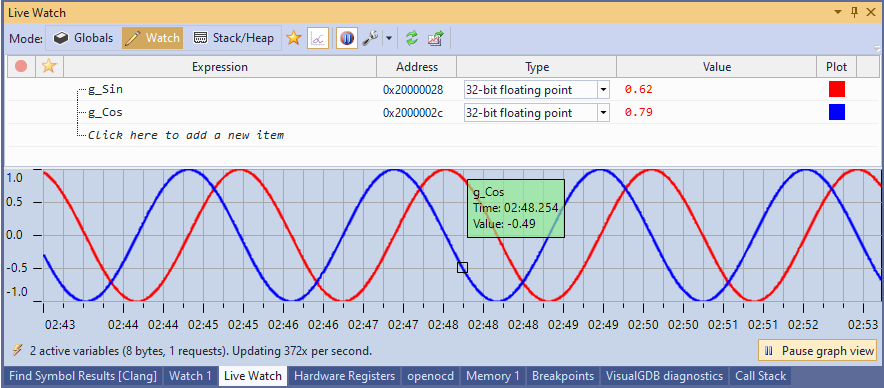
Overview
VisualGDB supports live variables for the following targets:
- ARM Cortex targets when using:
- OpenOCD
- Segger J-Link Software
- LPC-Link GDB Server
- RISC-V targets when using OpenOCD
Live Watch supports 3 primary views (Globals, Watch and Plugin) and includes a few additional tools that simplify the analysis of the captured data.
Globals View
This view shows all globals variables (including the static variables inside functions or classes). It operates independently from the gdb debugger, so you can explore the state of your program without ever having to stop it: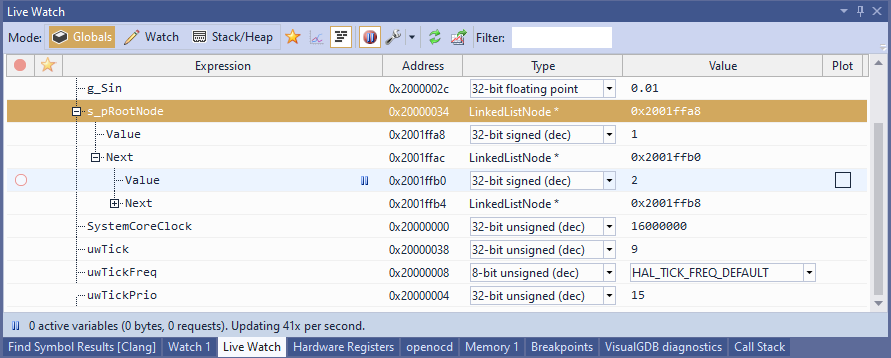
Advanced Data Types
The Live Watch window can automatically handle arrays, structures, strings, enums and pointers. To avoid flickering for rapidly changing pointers, it will not automatically replace the child nodes under a changed pointer, however it will mark them outdated. Clicking the “refresh” button near the pointer node will automatically update the children: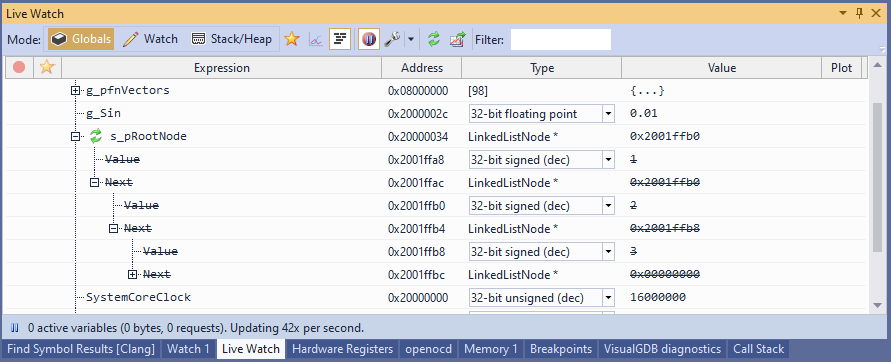
Filtering
You can quickly find specific global variables (or fields inside structures) by using the “filter” input: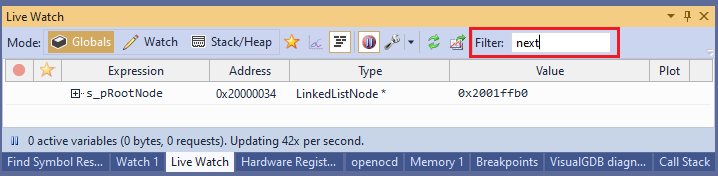
Filtering works very fast and will leave out the nodes containing the filter string in their name, or anywhere under their child nodes. This only involves analyzing the variable types and does not result in any extra memory reads. E.g. in the example above, s_pRootNode was shown because it contains a field called “Next”.
You can press “Enter” in the filter box to automatically expand all parent nodes, showing the variables that actually matched the filter.
Favorites
You can tag specific nodes in the Globals view as favorite and then use the Favorite filter to quickly view them: 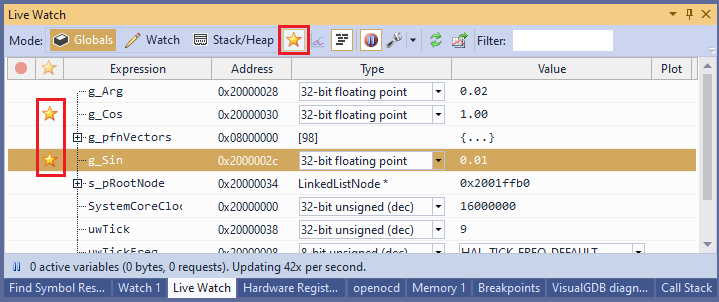 The favorite flag is preserved across debug sessions and is stored in the .vgdbsettings.user file.
Source Annotations
If you enable the Source Annotations mode in the Live Watch window (Globals view only), VisualGDB will show the live values of global variables directly in the code (requires using the Clang IntelliSense engine): 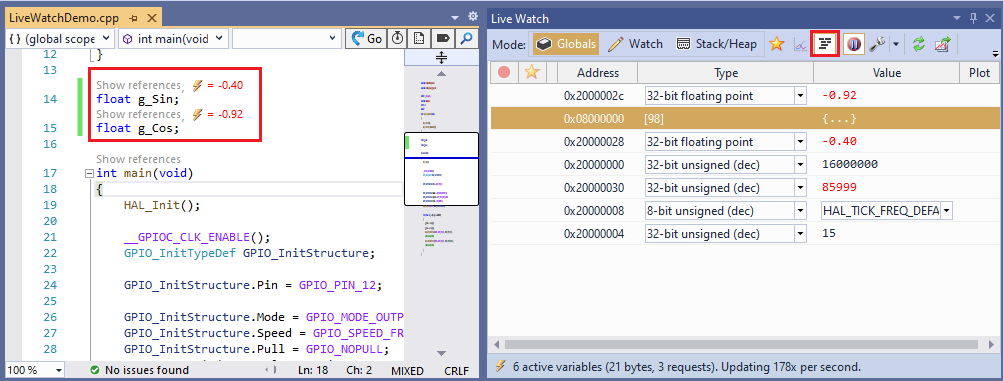 Clicking on the annotations will automatically go to the related variable in the Live Watch window, so you could change its type, or plot it.
Watch View
This view is every similar to the regular Visual Studio’s Watch windows. You can add new variables by entering arbitrary expressions in the list and VisualGDB will evaluate their address and create Live Variables based on them: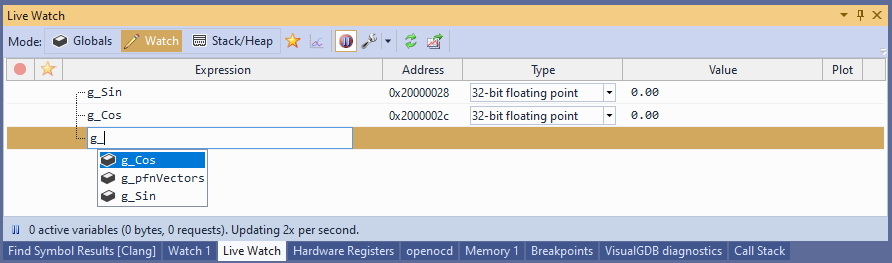 Note that adding Live Variables in the Watch mode may temporarily stop the gdb session, so that VisualGDB could evaluate the address of the variable. If this is not intended, please use the Globals view instead.
Plugin View
Live Watch supports plugins that can analyze the values of raw variables and present it in a more meaningful way (requires Custom edition or higher). VisualGDB is shipped with plugins for analyzing the stack/heap usage and visualizing FreeRTOS internals. Both plugins are open-source, so you can extend VisualGDB to analyze and visualize domain-specific structures: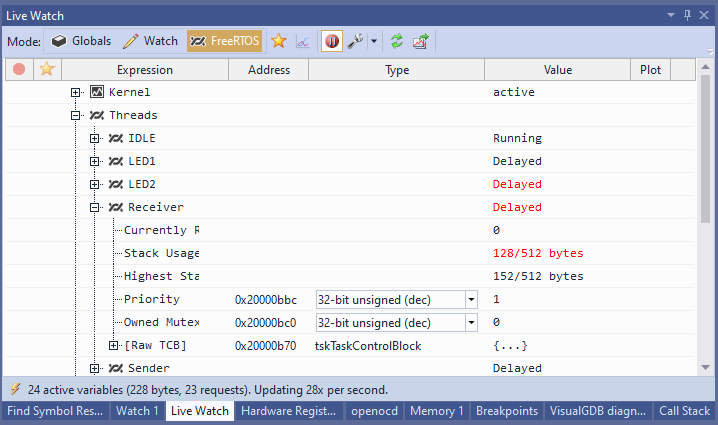
Plotting
VisualGDB can plot the values of the selected variables, so that you can observe how they change over time: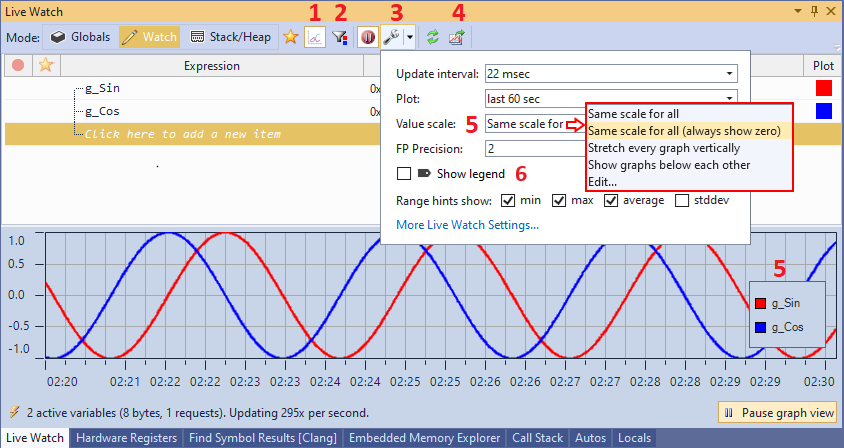 You can turn the graph view on and off via the “Graph” button (1), customize the scaling and updating options (3), or export the data to a CSV file (4). If you need to quickly locate the plotted variables in the list, you can enable the “plotted variables only” filter (2). You can also switch between different scaling options (5) or enable/disable the legend (6) via the options view.
Pausing the graph view allows exploring the exact values of the variables captured at each time point: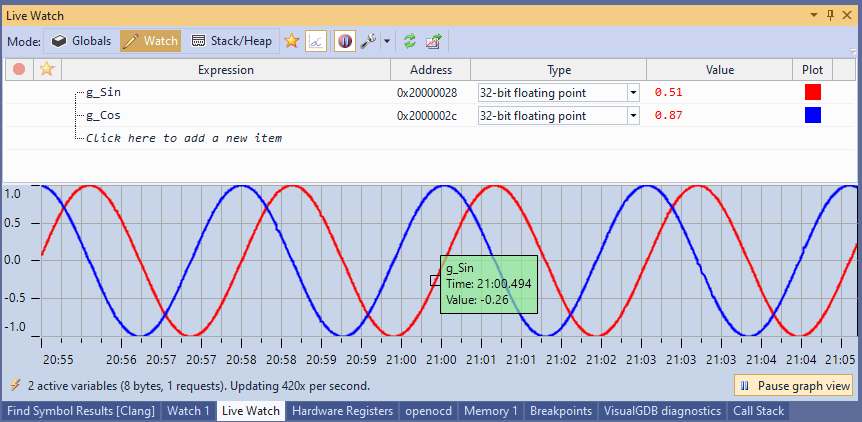 You can use the mouse to select an arbitrary time period in the graph view, and see various statistical information about the variables (e.g. minimum, maximum, average, standard deviation), as well as the average growth rate:
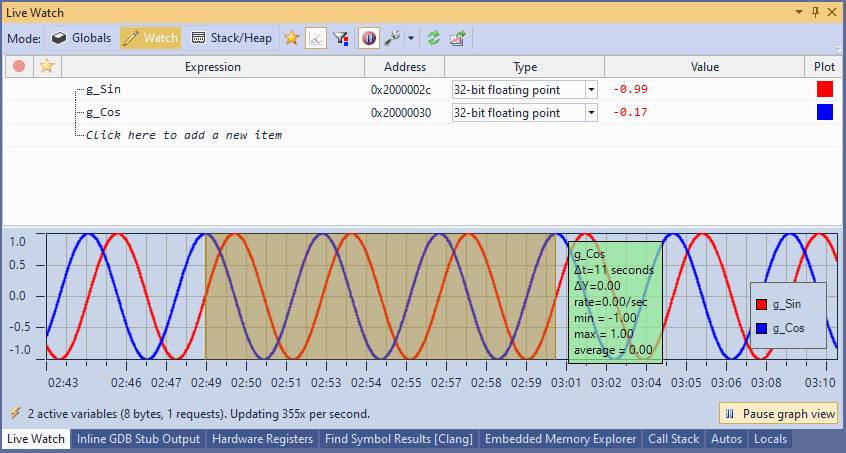 The context menu on the graph area allows exporting the selected data into a CSV file, or zooming into it.
You can also zoom the graph in our out via the mouse wheel, or pan it left and right by holding the Shift key and moving it with the mouse.
Breakpoints
You can set breakpoints on Live Variables by clicking in the Breakpoint column: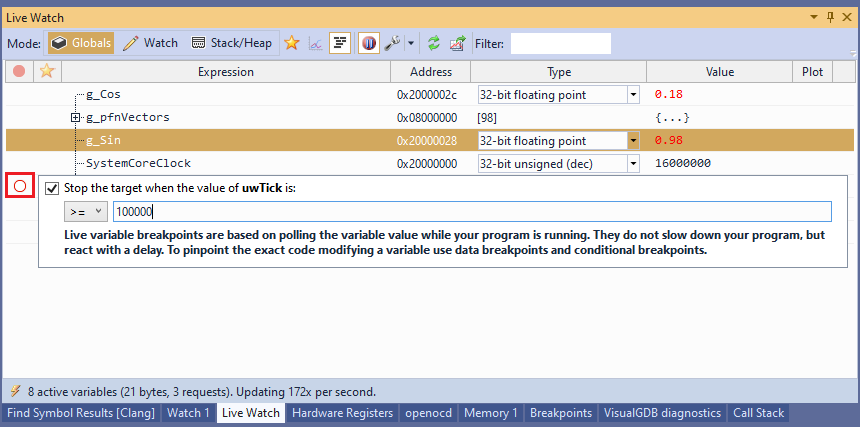 As soon as VisualGDB spots a matching value while querying the live variable, it will immediately stop the program and display more information. This does not consume any hardware breakpoints, however it won’t catch the exact location in the code where the variable was changed.
Settings
You can tweak various aspects of Live Watch via Tools->Options->VisualGDB->Embedded->Live Variables. Simply search for “Live” on this page for a detailed list of settings. Below are the explanations for the most commonly used settings:
Default Colors
This setting allows overriding the default colors used by VisualGDB to plot Live Variables. Simply enter a comma-separated list of RGB values (e.g. ff0000;0000ff;00ff00) and VisualGDB will use them next time you start plotting a variable.
Expand NULL Pointers
If set, VisualGDB will treat NULL pointers as any other valid pointers, showing their children in the Live Watch window. If unset, VisualGDB will display a [Null Pointer] stub instead.
Maximum String Size
This setting allows tweaking the maximum size of the string variables queried by VisualGDB. This is done to minimize performance penalty for large buffers. E.g. if you add a live watch for a “char g_Buffer[1024]” variable in the string mode, the actual amount of bytes read from g_Buffer will never exceed the value of this setting.
Stack Border Watch Size
When using VisualGDB to dynamically monitor the used stack, it will initially fill the entire stack with a fixed pattern (Unused Stack Fill Pattern), and will monitor how much of that pattern was overwritten. VisualGDB will then monitor a fixed amount of bytes near the previous known stack border:
This will work even if the stack usage grows by a large amount at once, but could skip a change, if the stack skipped a large area (e.g. reserved space for a large variable, but never used it). To get 100% accurate stack usage report at a much slower rate, increase the value of this setting (e.g. to 1M).
Value Scaling Anchors
Unless you are using the “Scale each variable independently” mode, VisualGDB will try to pick round numbers for the graph bounds (i.e. X × 10Y). This setting allows overriding the allowed values of X.
Read More
See this tutorial for a detailed step-by-step example of using Live Variables.