Developing Firmware for the ESP-WROOM-32 Module
This tutorial shows how to develop and debug a simple WiFi HTTP server for the ESP-WROOM-32 module using Visual Studio and VisualGDB. Before you begin, install VisualGDB 5.3 or later.
Warning: The MSBuild-based ESP32 projects are deprecated since VisualGDB 5.4. Please use the Advanced ESP-IDF Project Subsystem instead. The rest of the steps shown in this tutorial will still work.
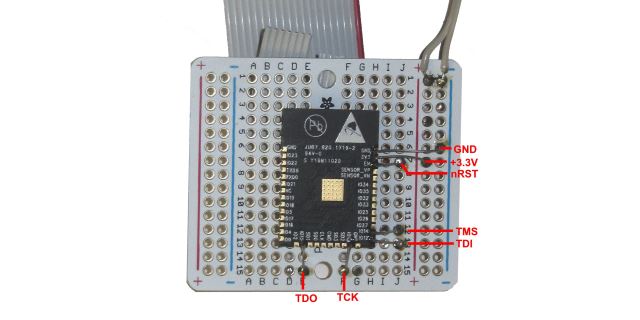
In order to debug the ESP-WROOM-32 module over JTAG, you will need to use an external stabilized 3.3V power supply and a JTAG debugger (e.g. Olimex ARM-USB-OCD-H) and connect it to certain pins of the ESP-WROOM-32 module. The table below shows the relevant pins:
| ESP32 signal | ESP-WROOM-32 signal | JTAG signal | JTAG20 pin |
| +3.3V | 3V3 | VCC | 1 |
| CHIP_PU | EN | SRST | 3 |
| GND | GND | GND | 4 |
| MTDI | GPIO12 | TDI | 5 |
| MTMS | GPIO14 | TMS | 7 |
| MTCK | GPIO13 | TCK | 9 |
| MTDO | GPIO15 | TDO | 13 |
See ESP-WROOM-32 schematics for more details.
You can use a breadboard to easily connect the relevant signals to a JTAG cable as shown below: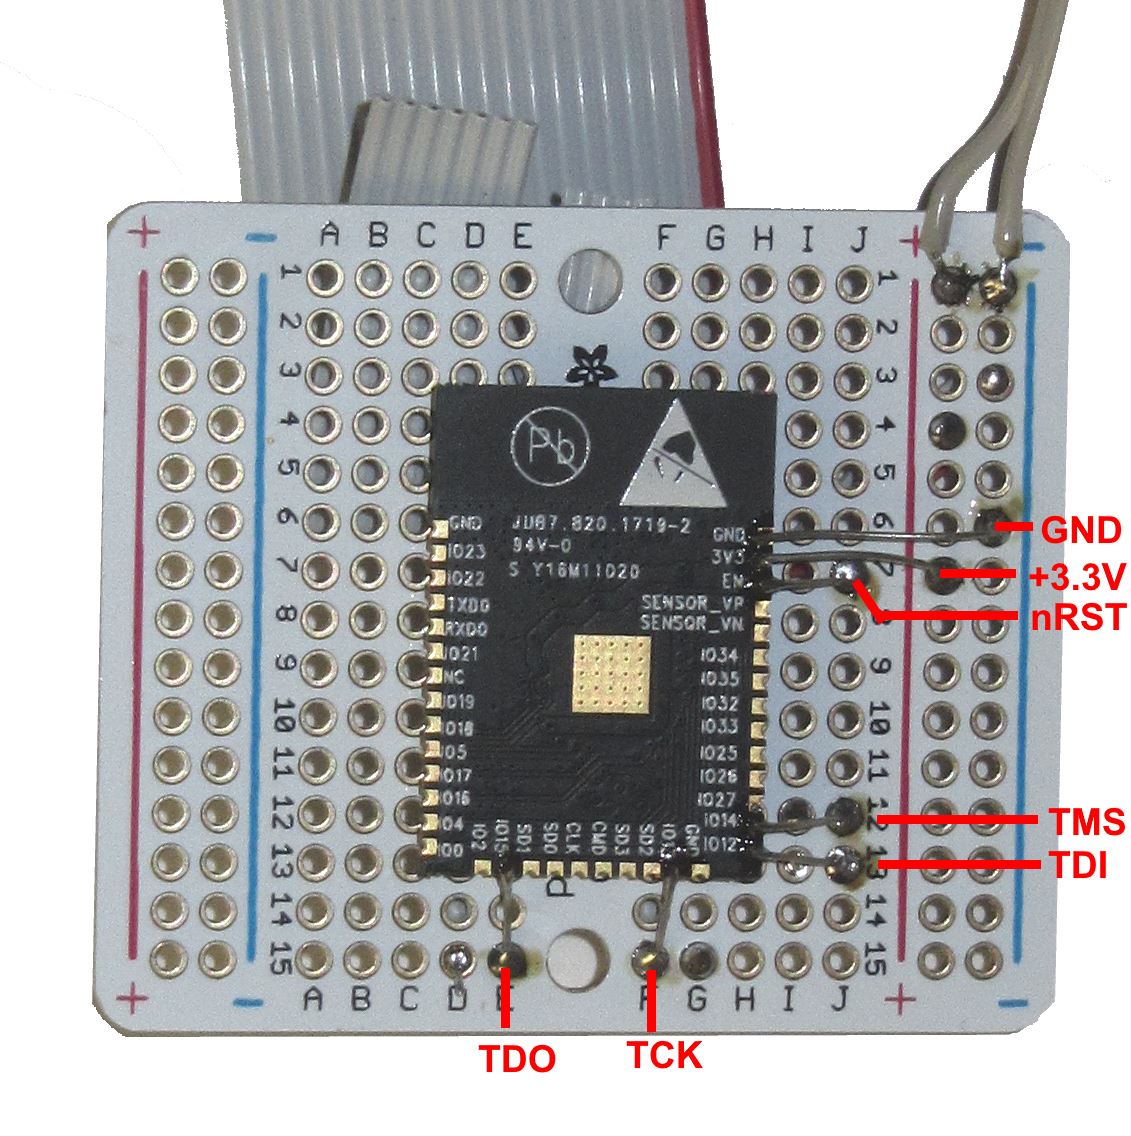
Warning! Be careful not to short-circuit nearby signals and double-check everything with a multimeter. Also note that confusing +3.3V and ground may instantly burn your ESP-WROOM-32!
The final setup of the ESP-WROOM-32 and a JTAG debugger would look as shown below: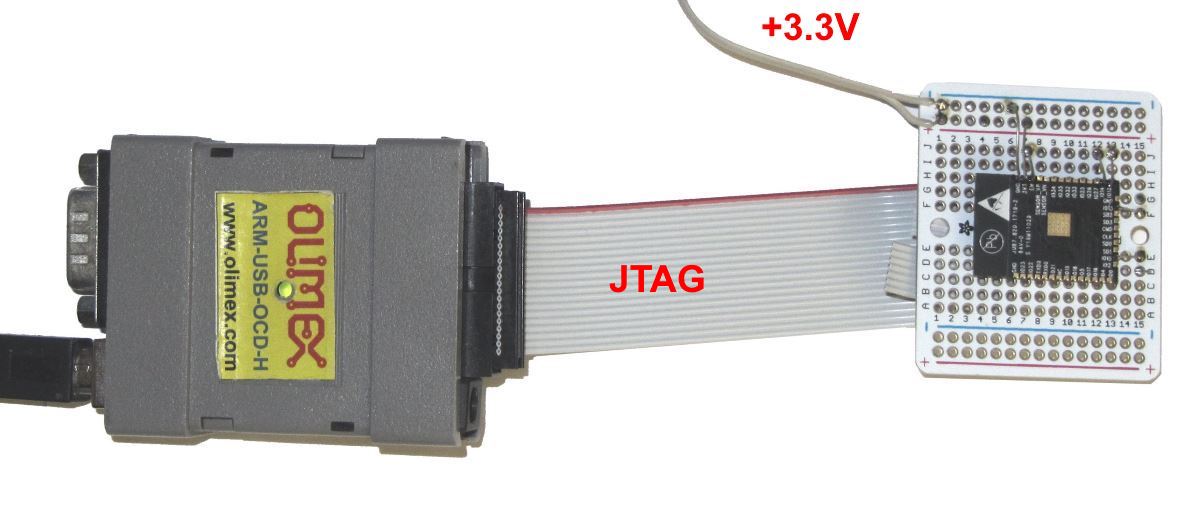
Once the wiring is configured, you can proceed with creating and testing out a basic project.
Note: VisualGDB 5.4 supports the new advanced ESP-IDF project subsystem that delivers better development experience than MSBuild-projects shown in this tutorial. Once you get basic debugging to work, follow this tutorial to get started with the new advanced ESP-IDF project subsystem.
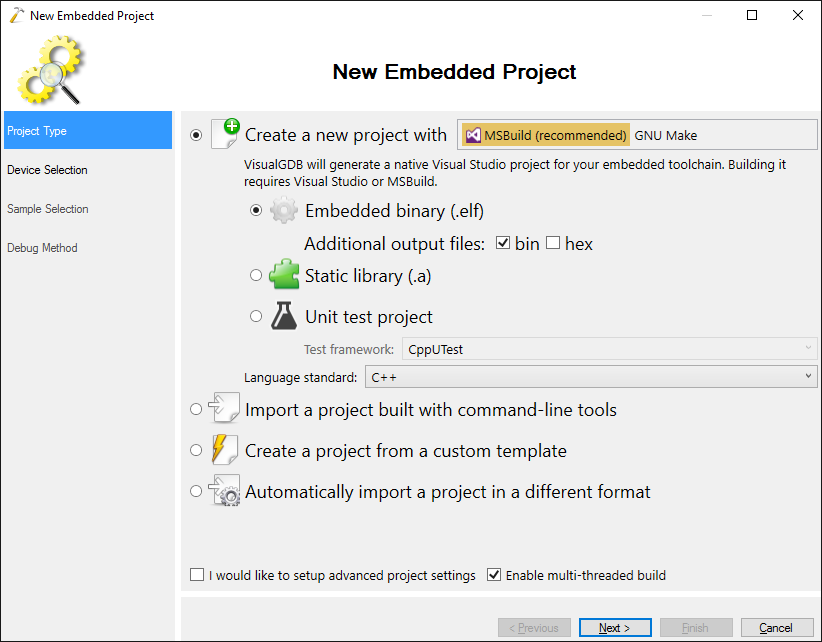
- Start Visual Studio and open the VisualGDB Embedded Project Wizard:
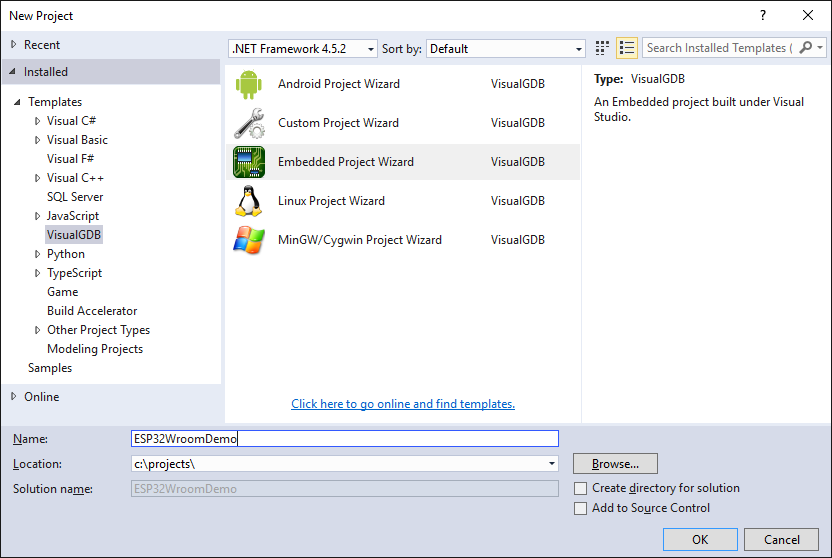
- Proceed with the default “New Project->MSBuild” setting:
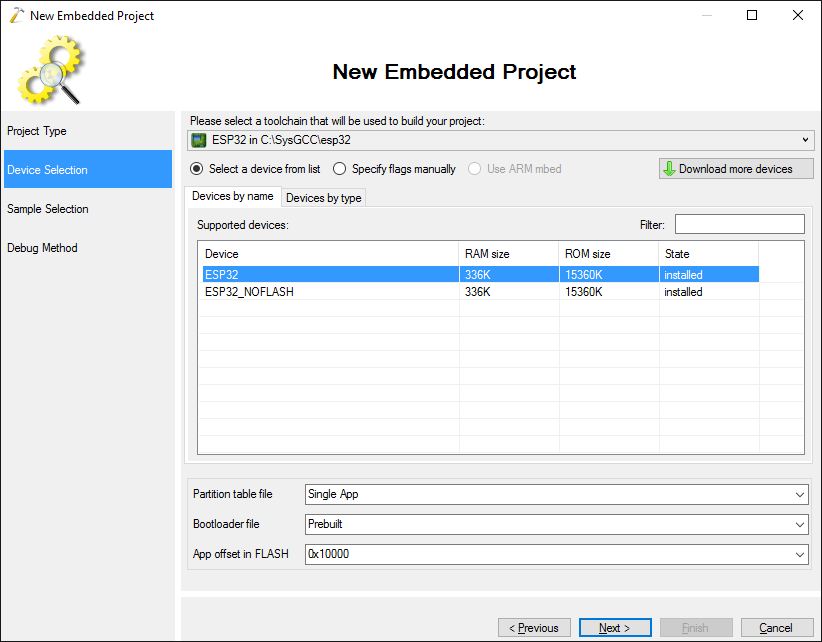
- Select the ESP32 toolchain and the regular ESP32 device:
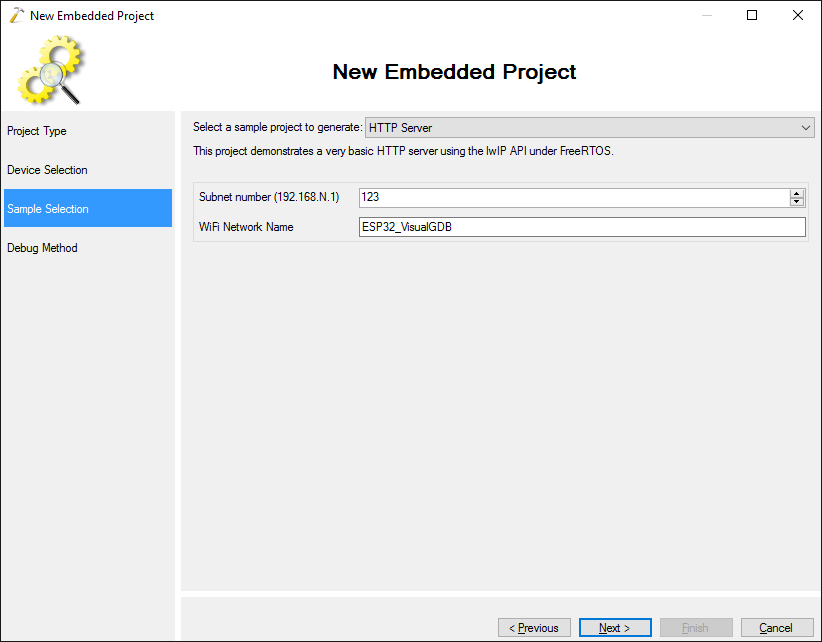
- As we have not soldered any LEDs on the board, we will proceed directly with the Wi-Fi example. Select “HTTP Server” and proceed with the default configuration:
- Connect your JTAG debugger to USB and select it in the “Debug Using” field. VisualGDB should automatically detect supported JTAG programmers and install the necessary drivers:
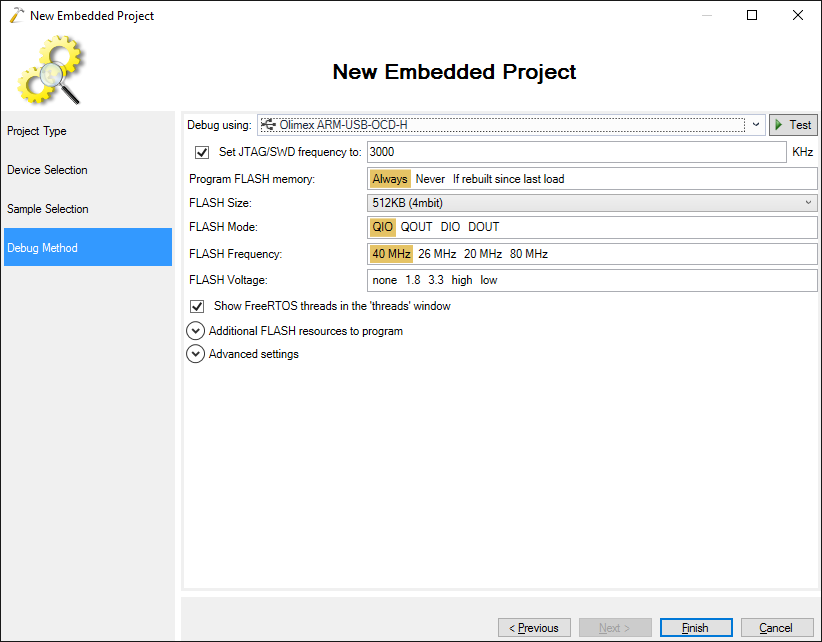
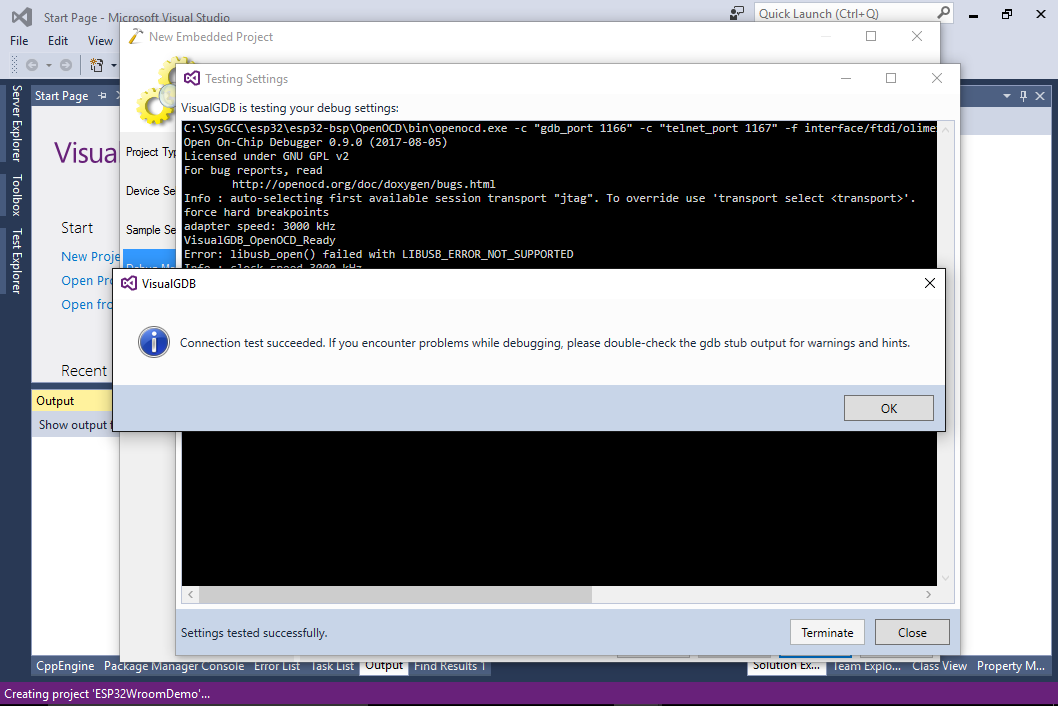
- Click “Test” to check the connection. If you see errors like “scan chain interrogation failed”, double-check your wiring and power:
- Press “Finish” to create the project and build it via Ctrl-Shift-B:
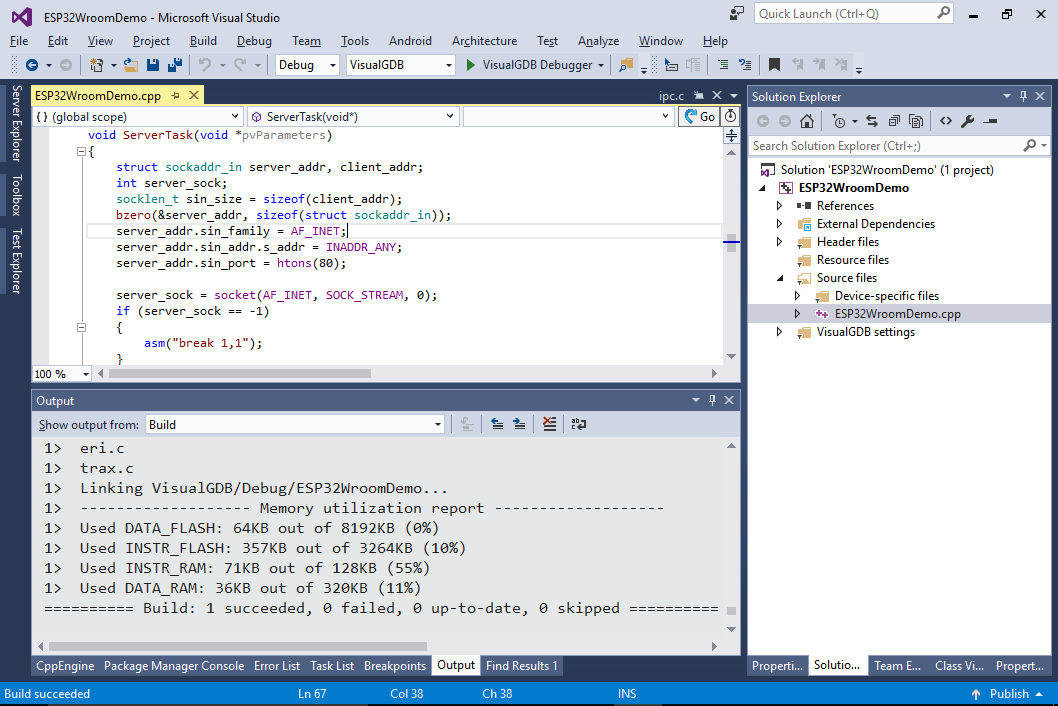
- Set a breakpoint in the ServerTask() function and press F5 to begin debugging:
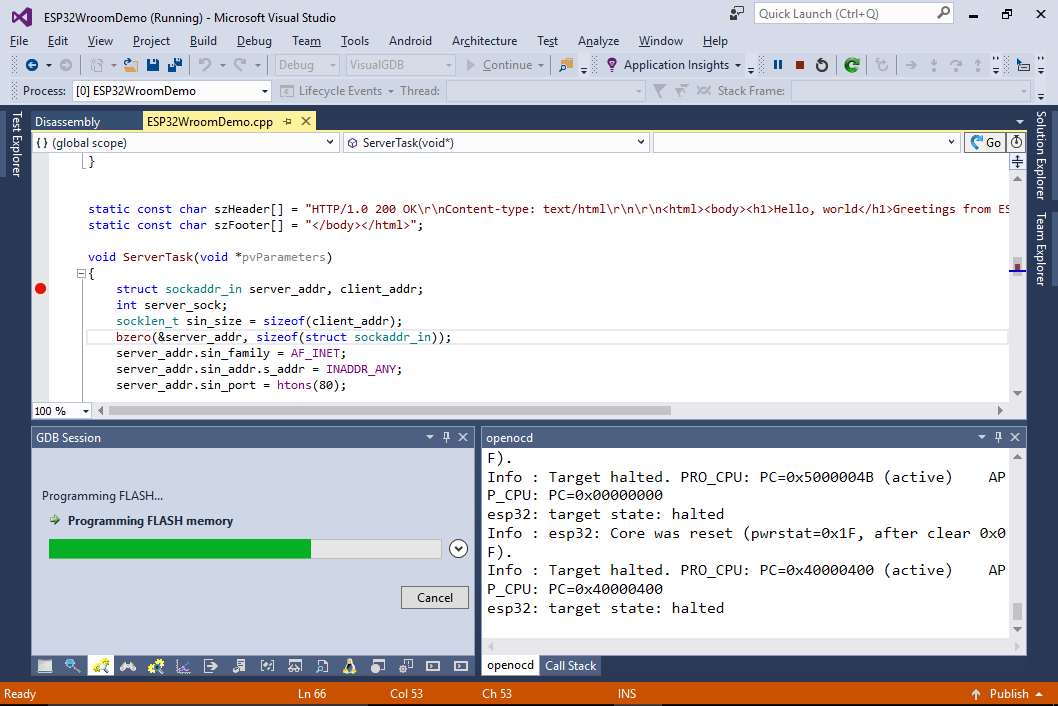
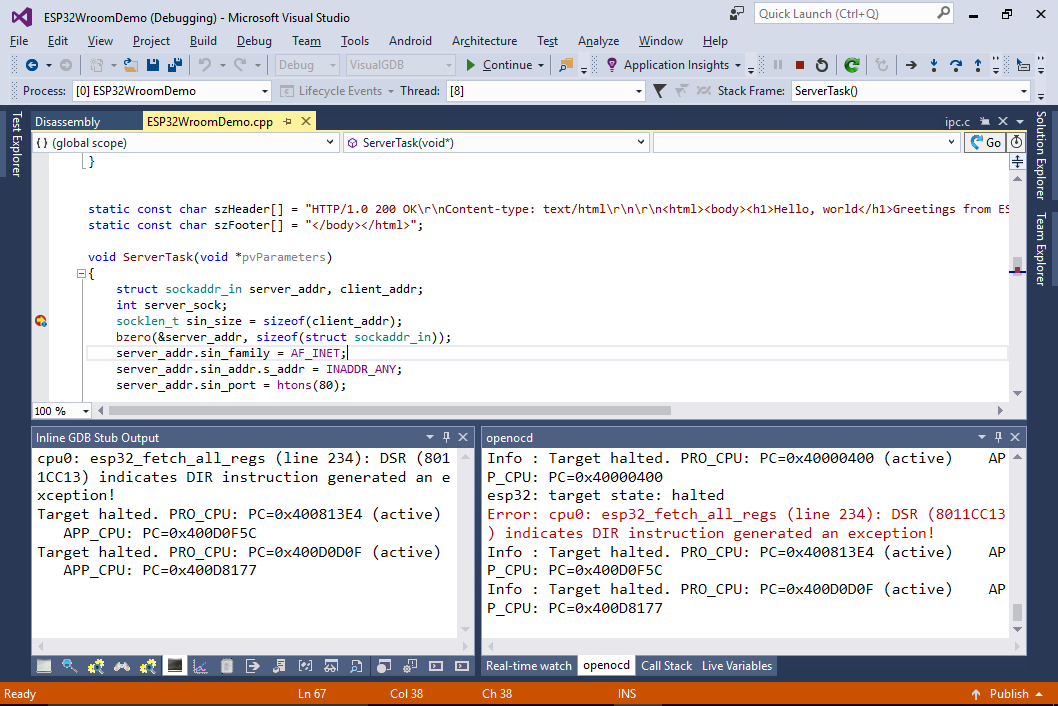
- VisualGDB will program the FLASH memory in the ESP-WROOM-32 module and start debugging. The breakpoint will hit:
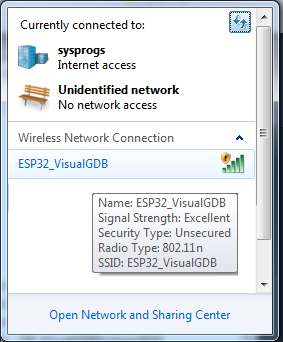
- Press F5 to continue debugging. Then locate the ESP32_VisualGDB Wi-Fi network from your device:
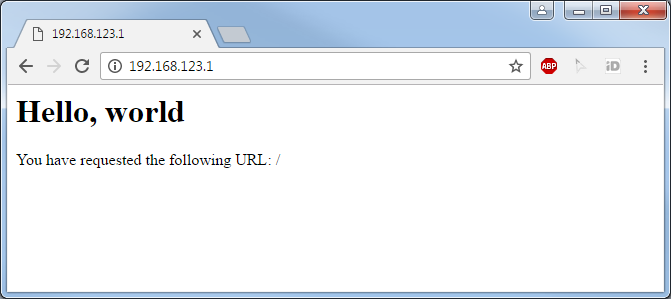
- Once the connection is successful, open 192.168.<subnet>.1 in your browser:


Congratulations! Now you customize the example to add your custom logic on top of it or explore one of the advanced samples provided by the ESP-IDF project subsystem. You can use all other GPIO pins on the ESP-WROOM-32 module to control your peripherals as long as you reserve the MTDI, MTDO, MTMS and MTCK pins for JTAG.