Finding Memory Leaks in Linux Programs with VisualGDB
This tutorial shows how to find memory leaks in Linux programs using the VisualGDB integration with valgrind. Before you begin, install VisualGDB 5.3 or later.
We will create a basic projectthat will randomly leak memory and will then use the Dynamic Analysis feature of VisualGDB to automatically run the program under Valgrind and produce a detailed report on memory leaks.
- Start Visual Studio and open the VisualGDB Linux Project Wizard:
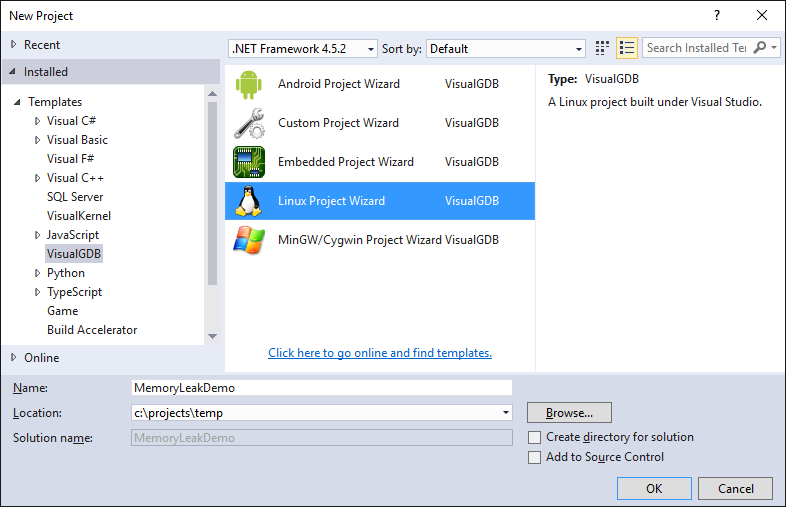
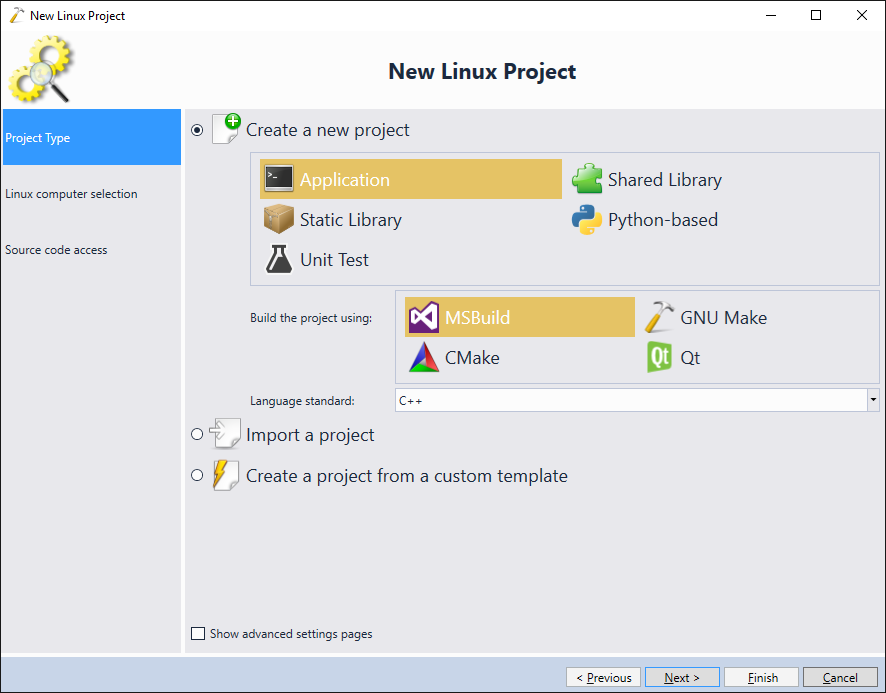
- Select “Create a new project” -> “Application” -> “MSBuild”:
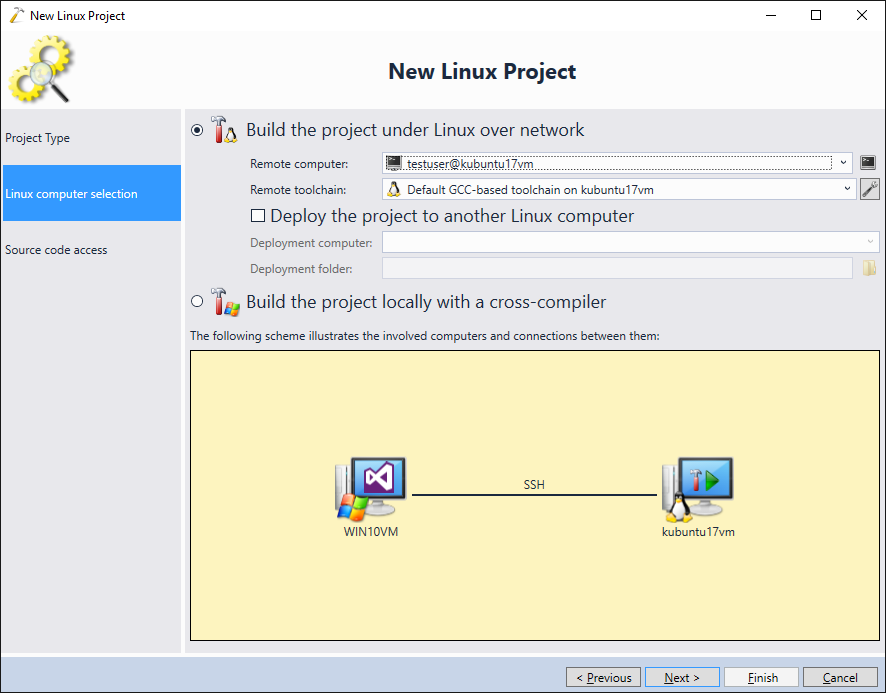
- Select the Linux computer you would like to target. VisualGDB will automatically check that it has all necessary tools and will install the missing ones:
- Proceed with the default option of keeping all source files on the Windows machine and uploading them during builds:
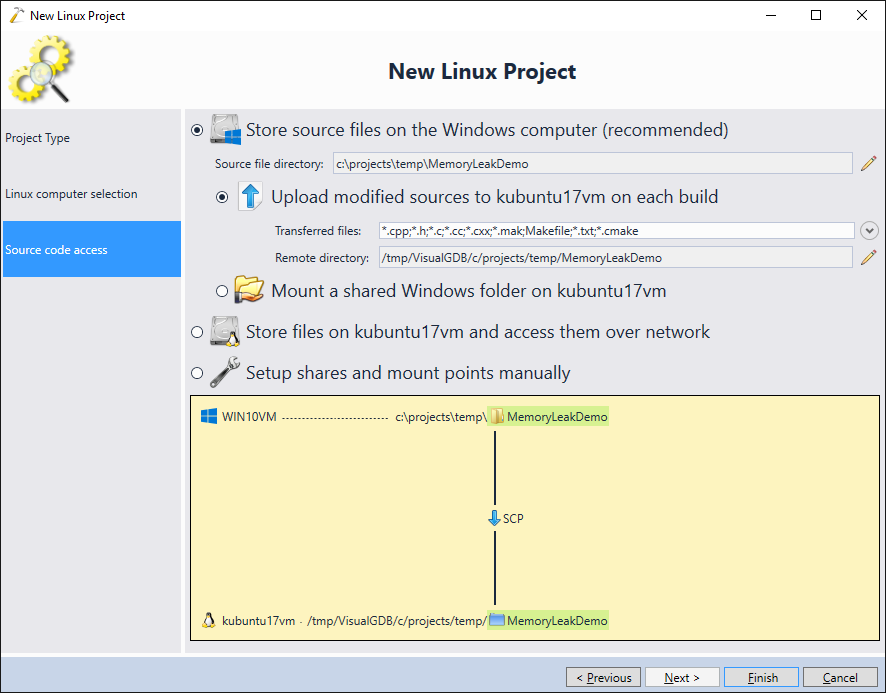
- Press “Finish” to create your project. Replace the contents of the main source file with the following code demonstrating memory leaks:
#include <iostream>
#include <stdlib.h>
#include <string>

template <int X> void AllocAndMaybeFree()
{
    char *pTest = new char[X];
    if (rand() % 5)
        delete[] pTest;
}

int main(int argc, char *argv[])
{
    AllocAndMaybeFree<1>();
    AllocAndMaybeFree<2>();
    AllocAndMaybeFree<3>();
    AllocAndMaybeFree<4>();
    AllocAndMaybeFree<5>();
    AllocAndMaybeFree<6>();
    AllocAndMaybeFree<7>();
    AllocAndMaybeFree<8>();
    AllocAndMaybeFree<9>();
    AllocAndMaybeFree<10>();
    return 0;
}
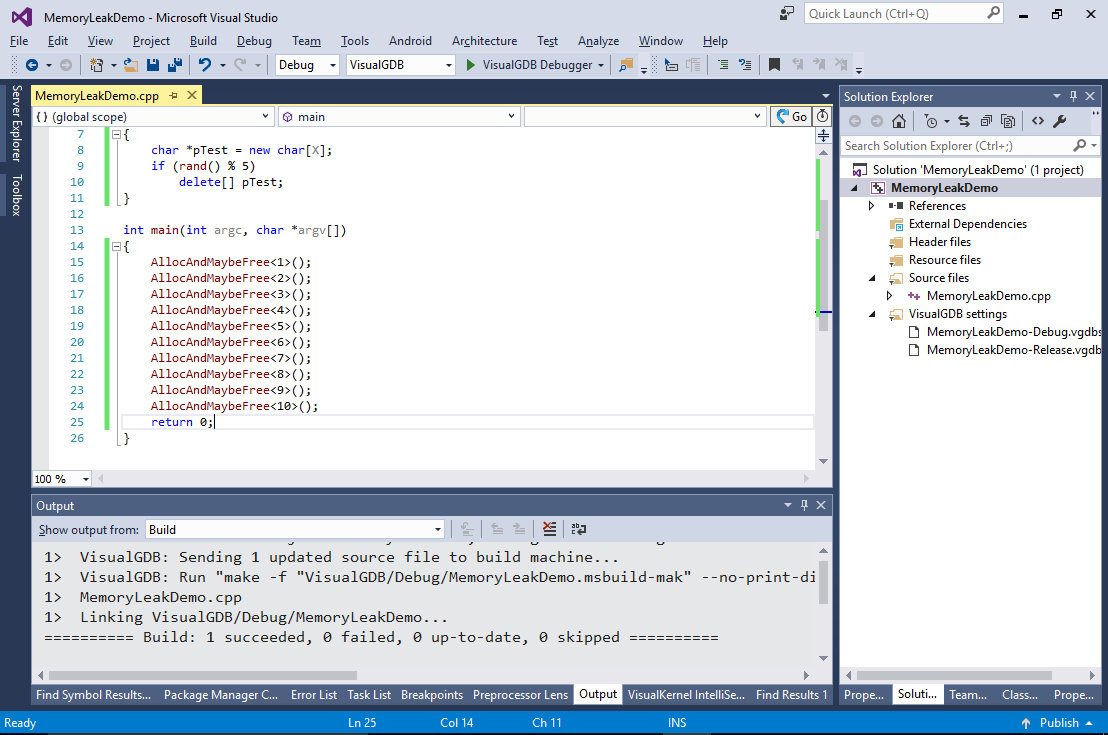
In real-world scenarios the memory is allocated in multiple different parts of the program, and if some of those allocations are not released, the memory leaks. We are simulating this with the AllocAndMaybeFree() function that will “forget” to free the allocated memory block with a 20% probability. We use the template argument to make different invocations of the function appear differently in the call stack, as if we had 10 distinct functions potentially leaking memory. Build the project and ensure is results in no errors:
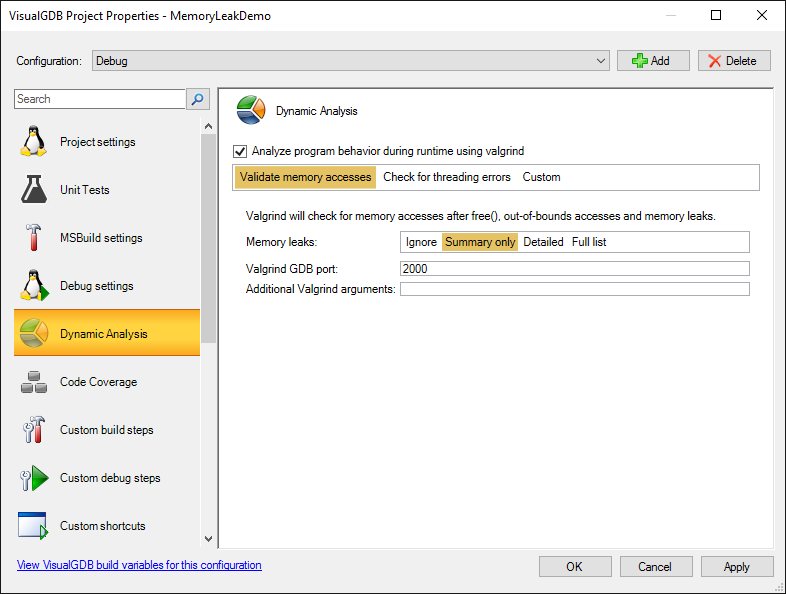
- Now we will show how to run the program under Valgrind. Open VisualGDB Project Properties, go to the Dynamic Analysis page and enable the “Analyze program behavior during runtime” checkbox:
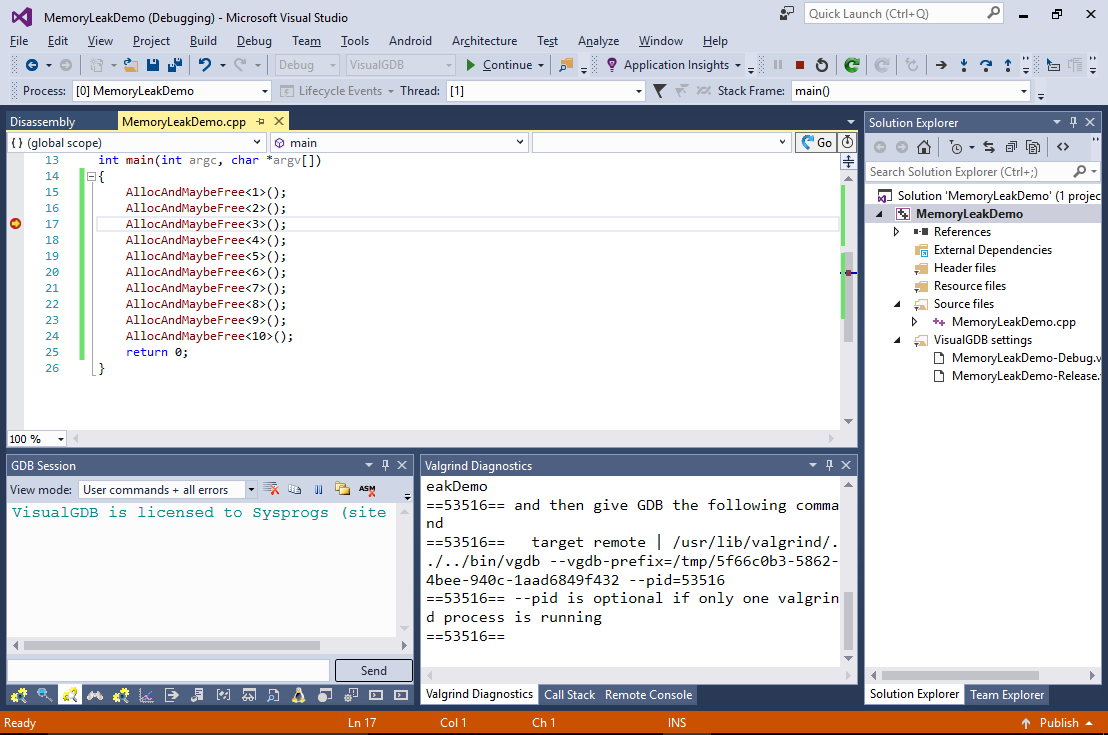
- Press OK and start debugging your program. VisualGDB will automatically launch valgrind and attach gdb to it. You will see the diagnostic output in the Valgrind Diagnostics window, but the rest of the debugging experience will be the same as if you were debugging your program regularly:
- Once the program exits, Valgrind will display the summary of the discovered memory leaks:
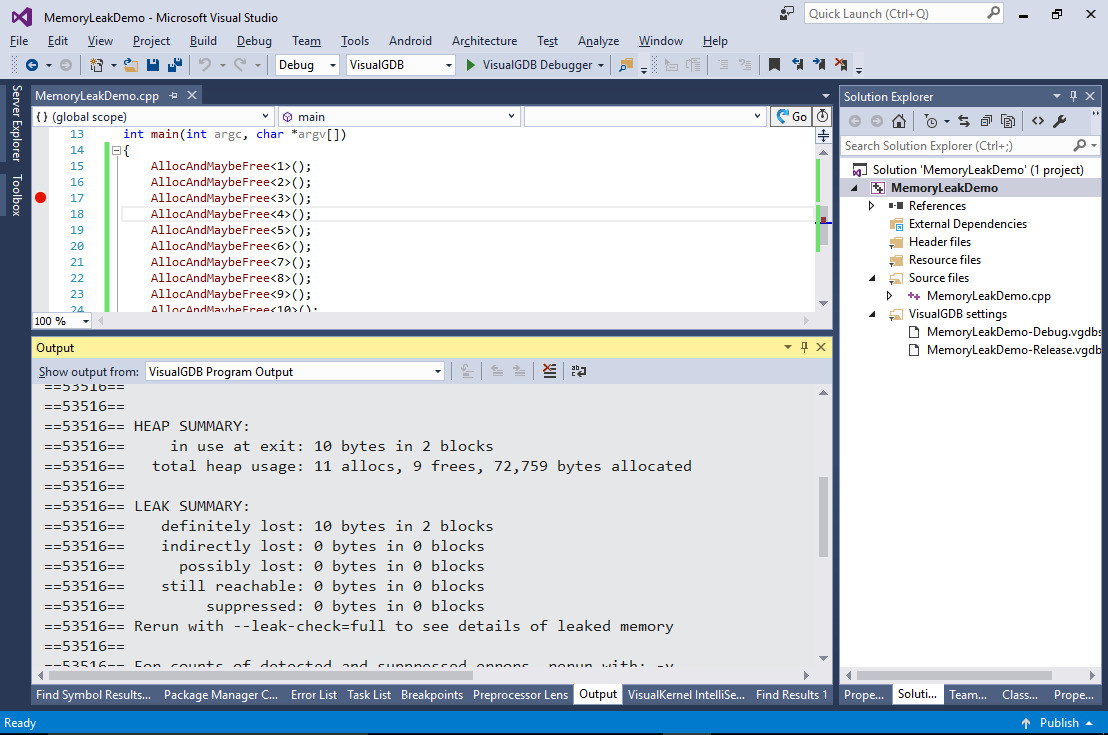
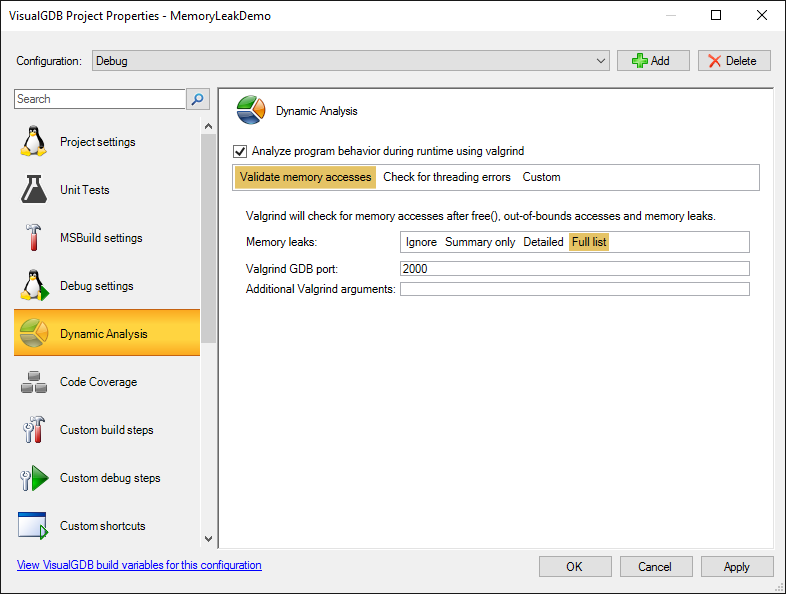
- Open VisualGDB Project Properties again and switch the “Memory leaks” setting to “Full list”:
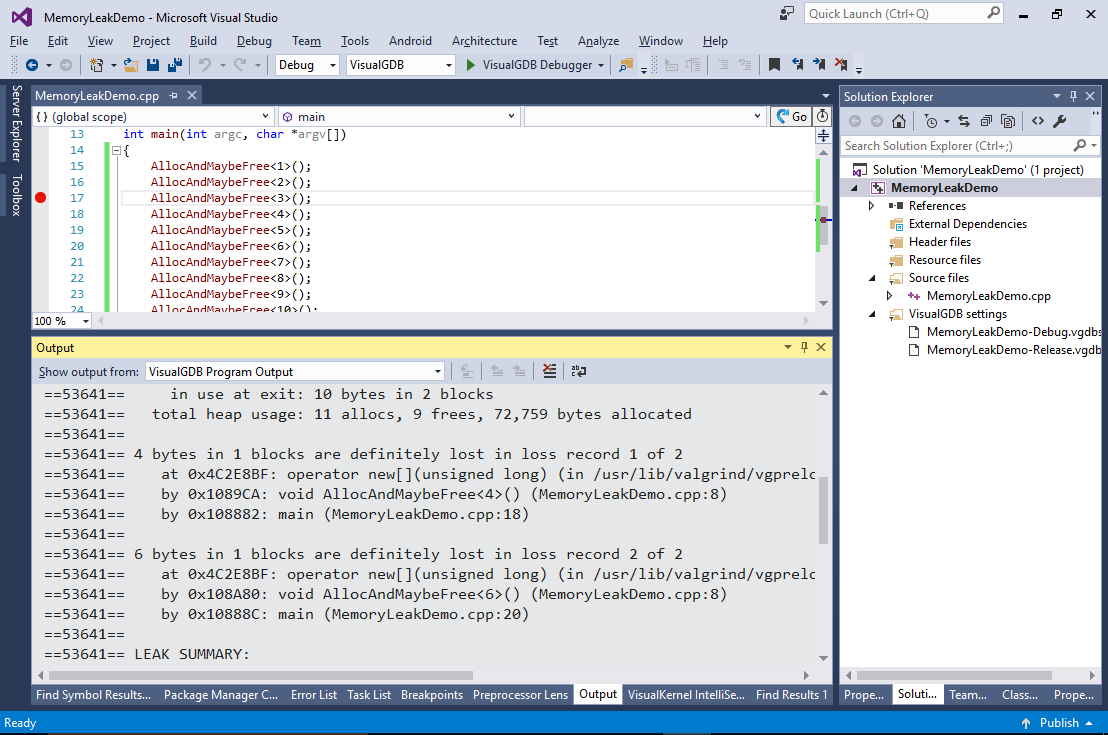
- Run the program again. Valgrind will now report full call stacks of the allocations that were never freed, showing how calls #4 and #6 resulted in memory leaks:
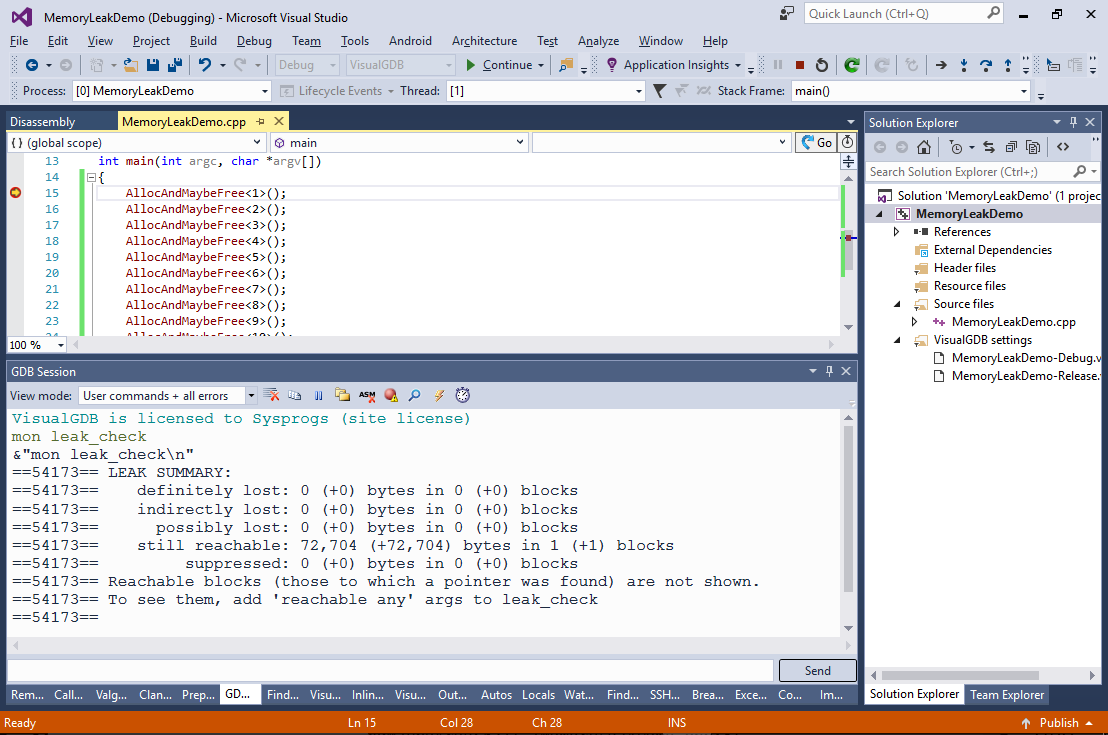
- You can also analyze the leaks in real time using the GDB Session window in VisualGDB. Simply run the “mon leak_check” command while debugging under valgrind:
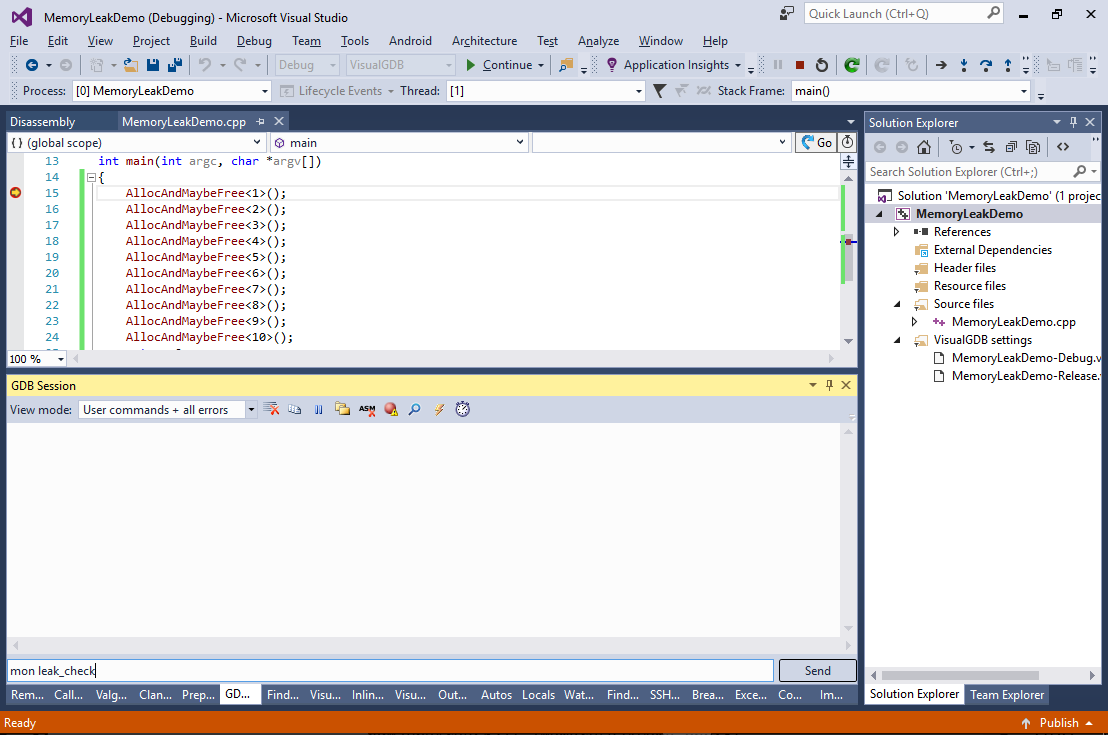
- Valgrind will output the summary of the current allocations:
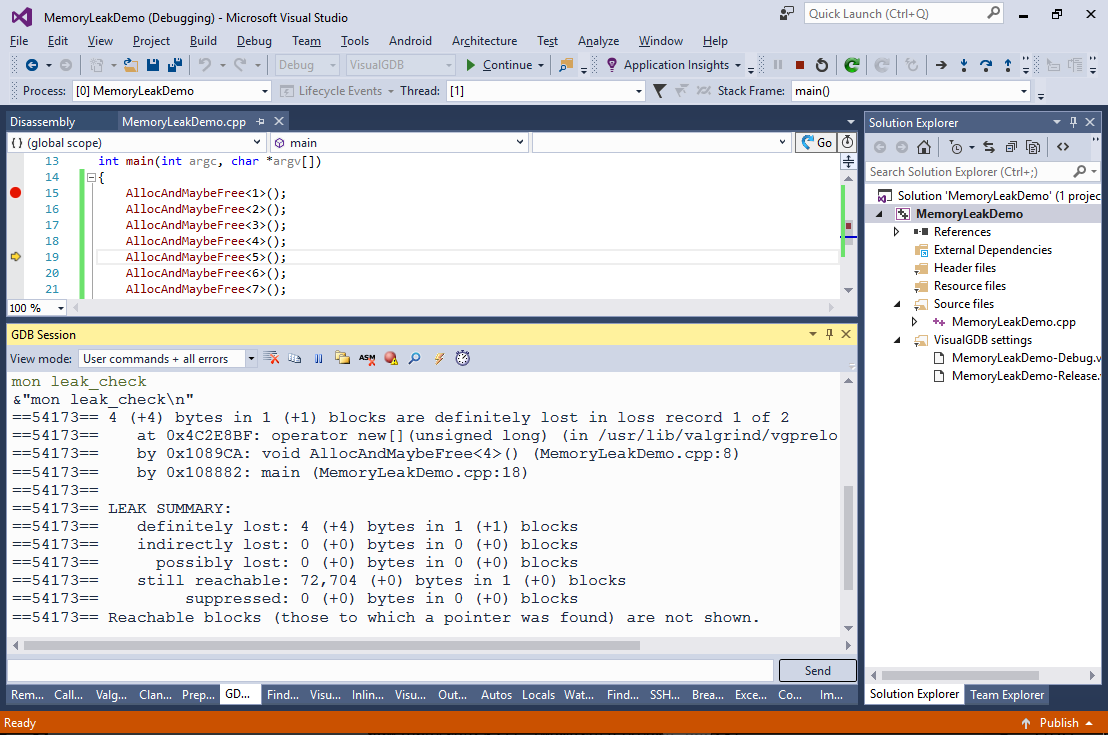
- If you re-run the command after a memory block is allocated, not freed and not pointed by any other block, the “mon leak_check” command will report it as “definitely lost” showing the allocation stack:
- Valgrind will also automatically handle references between the blocks. We will demonstrate this by allocating an instance of a class that includes an STL string. Replace the main file contents with the following code:
#include <iostream>
#include <stdlib.h>
#include <string>

using namespace std;

class DemoClass
{
public:
    std::string Test = "xxxxxxxxxxxxxxxxxxxxxxxxxxxxxxxxxxxxxxxxxxxxxxxxxxxxxxxx";
};

void func()
{
    DemoClass *p = new DemoClass();
}

int main(int argc, char *argv[])
{
    func();
    return 0;
}
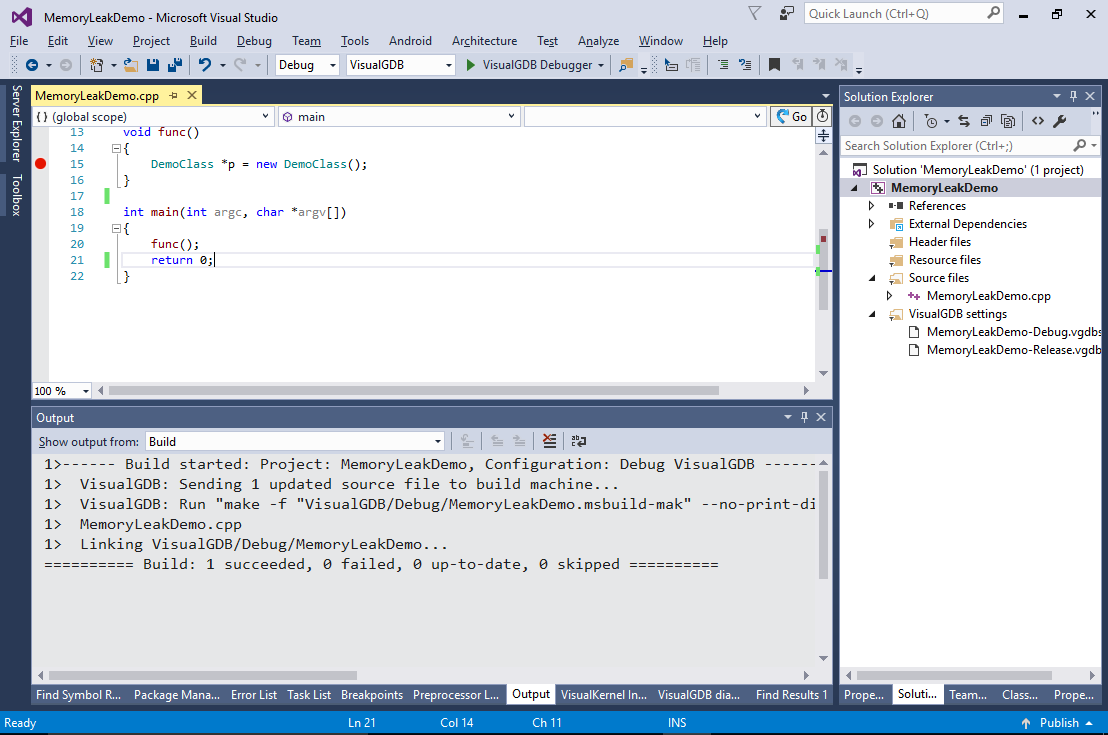
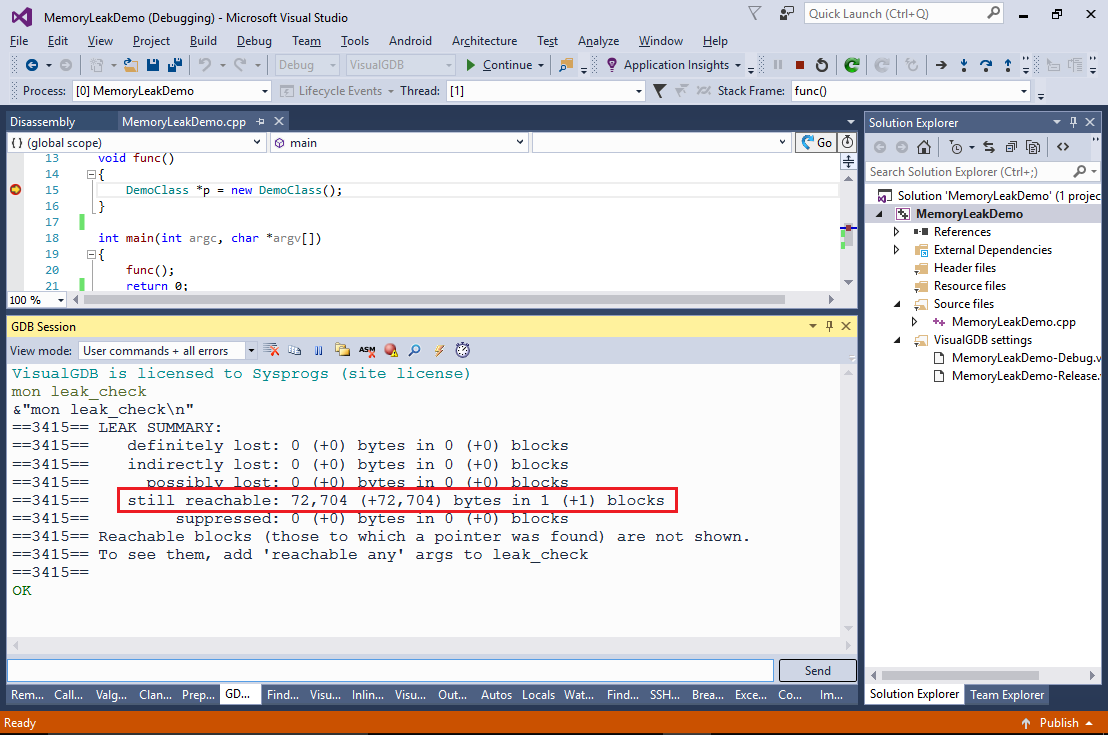
- Set a breakpoint in the func() function and start debugging. Once the breakpoint is hit, run the “mon leak_check” command (use the ‘up’ button in the GDB Session window to repeat the previous command instead of re-typing it):
- Step over the allocation line and re-run the “mon leak_check” command:
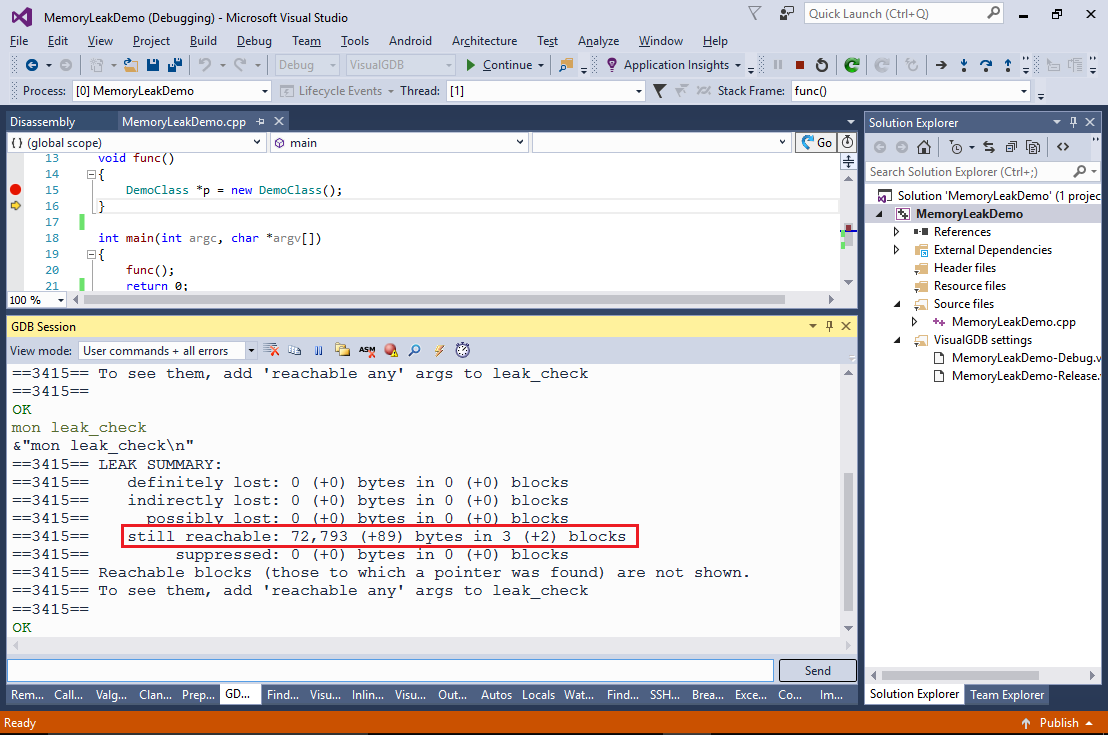 Note how the “still reachable” blocks have grown by 2 and no leak is reported yet. This happens because the ‘p’ variable still points to the newly allocated memory and valgrind assumes it might be freed later.
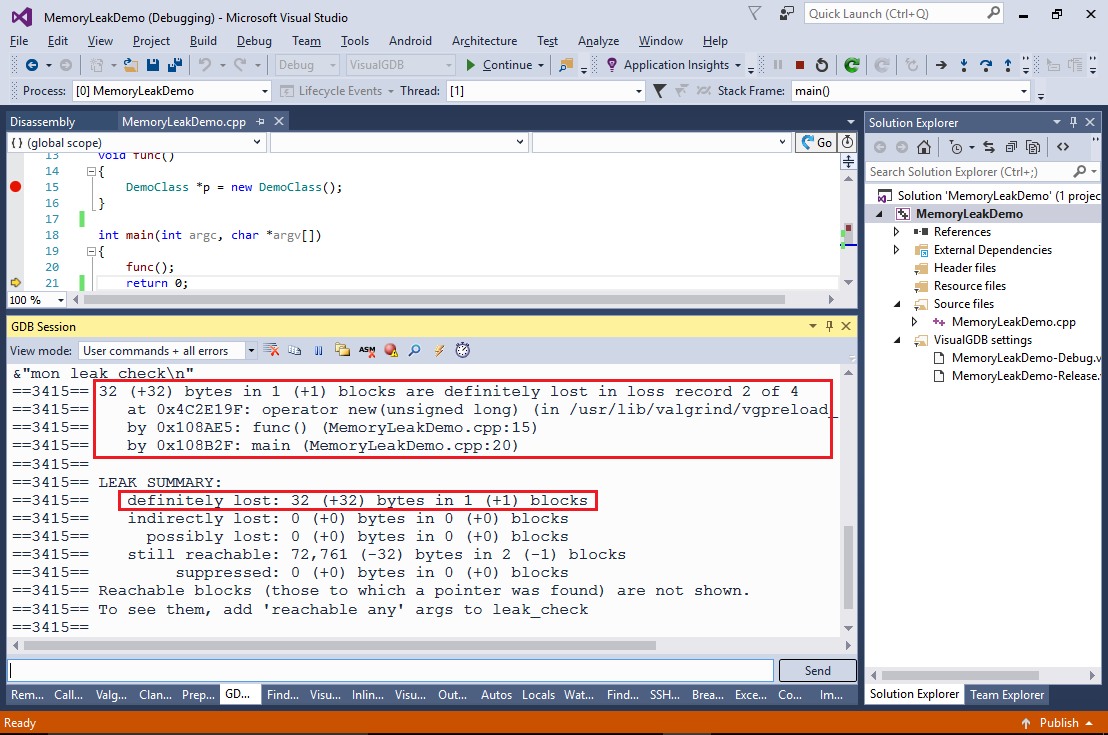
 - Step out of the func() function and re-run “mon leak_check”. Now valgrind will report a memory leak. Note how the memory block allocated by the STL string is not reported separately (it is shown as +1) as it is only referenced by the already reported block:
VisualGDB also provides a convenient way to analyze your program performance using Valgrind. See our Linux Profiling Tutorial for a detailed step-by-step guide.

