Unresponsive GDB Commands
VisualGDB relies on the GDB debugger to handle the low-level aspects of the debug session (e.g. translate C/C++ expressions to addresses in memory). This is done by automatically sending various commands to it. If GDB does not respond to a command, VisualGDB displays the following message with the problem details: 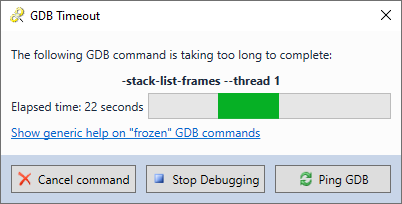 The problem is typically caused by intermittent network connection (when the command or reply never gets delivered), or by gdb itself (e.g. failing to parse debugging symbols). You can generally understand more context of the problem by enabling GDB logging (VisualGDB Project Properties -> Advanced GDB Settings -> Save all low-level interaction):
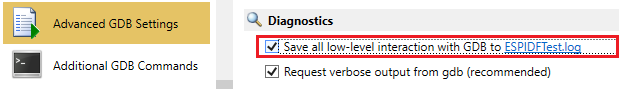 Although VisualGDB cannot prevent GDB from working incorrectly sometimes, it does provide several mechanisms to work around common issues:
- If your GDB executable runs on a remote machine, network or terminal buffering might be preventing command replies from reaching VisualGDB. Pressing the “Ping GDB” button will send an empty command to GDB, flushing the buffers.
- If it doesn’t help, pressing the “Cancel Command” button will send a Ctrl-C event to GDB, and will try to continue debugging session, while skipping this specific command.
Common Unresponsive Commands
This section provides a list of GDB commands that often take too long to complete, along with the recommended ways of speeding them up.
-target-select/target
Context: This command is used by GDB to connect to the remote system (e.g. gdbserver running on Linux) or to a gdb stub that handles low-level interaction with JTAG hardware (e.g. OpenOCD).
Cause: If this command takes too long time and eventually fails, the gdbserver/gdb stub used for debugging might be terminating before GDB gets a chance to connect to it. Another common cause of this is error is when the firewall prevents GDB from connecting to the stub.
Workaround: VisualGDB generally displays the gdb stub output in a separate view under Debug->Windows->VisualGDB Output, so you can double-check it for errors. Another way to troubleshoot it would be to run the GDB stub and gdb via command line, and try connecting them manually.
-file-list-exec-source-files
Context: This command is used by VisualGDB to list all source files known to gdb. VisualGDB does it when it attempts to repair the GDB path mapping (i.e. when GDB fails to set breakpoints using the normal paths).
Cause: GDB uses suboptimal logic for formatting the reply to the -file-list-exec-source-files command. The reply time grows quickly with the number of source files reported, resulting in considerable times for large projects.
Workaround: You can completely prevent VisualGDB from issuing this command by setting VisualGDB Project Properties -> Advanced GDB Settings -> Common Workarounds -> Use file names only when setting breakpoints. Note that it will cause confusion of your project contains multiple files with the same name (e.g. source.cpp and subdir/source.cpp).
-stack-list-frames
Context: This command is used by VisualGDB to query the current call stack (i.e. the function calling the current function and so on).
Cause: Some optimization settings, RTOSes, or corrupt stack may trigger an infinite loop in gdb when unwinding the stack (i.e. determining the callers of the functions). This command can be also memory-intense and could take considerable time on targets with slow memory access.
Workaround: There are several workarounds to issues with -stack-list-frames:
- If the problems happen rarely, you can simply press the “Cancel Command” button. VisualGDB will report an empty stack trace to Visual Studio, and will continue as usual.
- If you do not care about the call stack, closing the Call Stack and Threads windows in Visual Studio will prevent VisualGDB from issuing this command.
- You can also explicitly limit this command to a couple of outermost frames by adding the set backtrace limit command to VisualGDB Project Properties -> Additional GDB Commands.