Code Explorer – Globals
This page provides a detailed description of the Globals view of Solution Explorer.
Contents
Overview
Details
Filters
Settings
C++ Templates
Overview
The Globals View of Code Explorer displays various information about the C/C++ symbols from the entire solution. The symbols can be displayed either as a list (1) or a tree (2).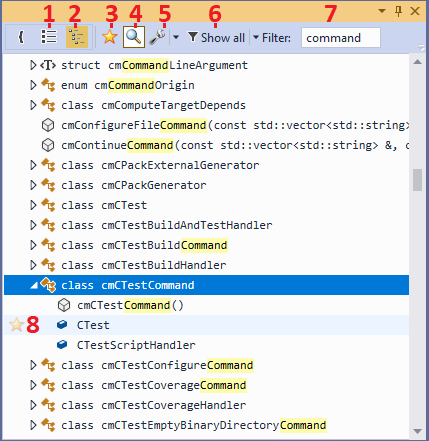 The following controls can be used to customize the view:
- The Show Favorites Only button (3) can restrict the view to symbols marked as favorite (8) via any of the Code Explorer views.
- The Details button (4) allows showing or hiding the Details view
- The Settings button (5) allows customizing various settings
- The Type filters (6) allow restricting the view to the specific types of symbols (e.g. only virtual methods)
- The Filter box (7) allows quickly locating the items that contain the entered string. Press Enter in the filter box to quickly expand paths to all matching nodes.
Filters
You can use the Type filters to only show the symbols of the selected types: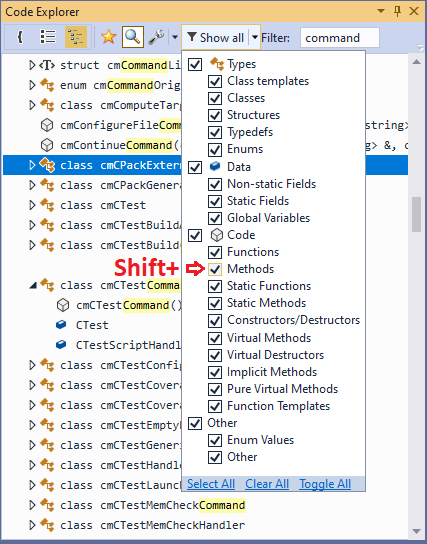 Note that holding Shift while clicking on a filter automatically disables all other filters.
Details View
The Details view is shown in a separate dockable window (see Outline Details). It provides detailed information about the currently selected Code Explorer entity (1). You can also hold Shift or Ctrl to select multiple entities at the same time.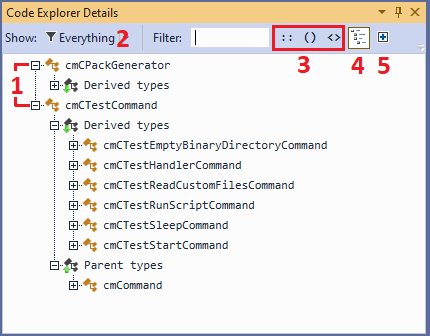 The Details view can be customized to show all relations, or specific relations only (2), filtered by entity name, and configured (3) to display the fully qualified names of the entities, function argument types, and template arguments. You can also control whether the top-level detail nodes are expanded by default. The Load One Level button (5) allows quickly loading details for all unexpanded nodes:
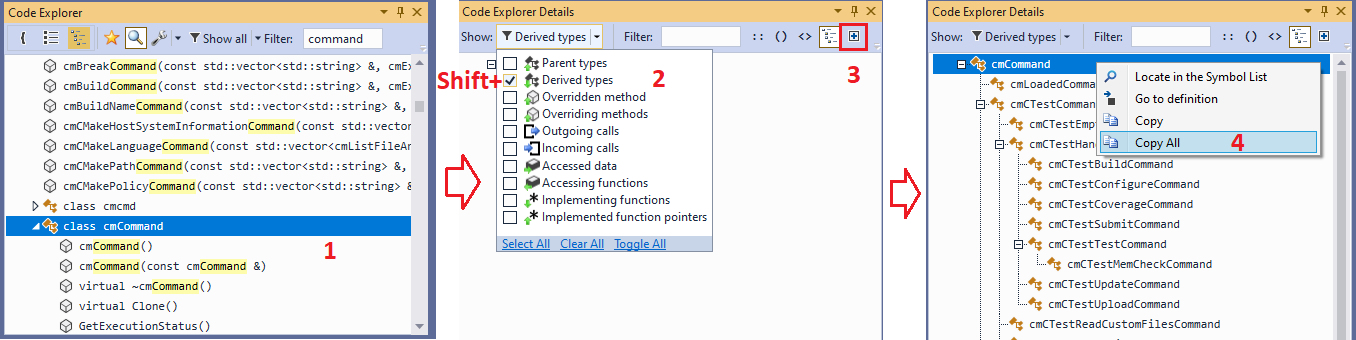 You can use it to select a particular entity in Code Explorer (1), quickly pick the desired relation type (2), expand it multiple times until all the nodes have been loaded (3) and quickly copy the found relations to Clipboard.
Settings
The Globals view in Code Explorer allows configuring the following settings: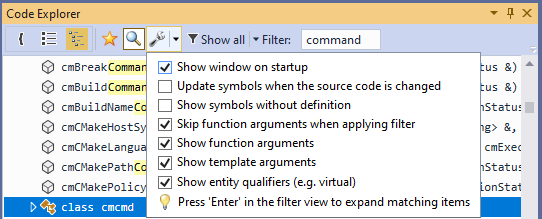
| Setting | When enabled | When disabled |
| Show window on startup | The Code Explorer window will automatically appear when loading VisualGDB-based projects. | The Code Explorer will only appear when opened via View->VisualGDB Code Explorer. |
| Update symbols when the source code is changed | Changing a source code and clicking on Code Explorer will automatically rebuild the symbol cache. This may take considerable time if a commonly used header file was modified. | Changing a source file and going back to Code Explorer will display the outdated information from the previous cache. Code Explorer will show a warning that the cache is out of date. |
| Show symbols without definition | Functions/classes that are declared, but not defined in the code (e.g. _exit()) will be shown. | Only functions/classes that have definitions/implementations in the code will appear in the symbol list. |
| Skip function arguments when applying filter | E.g. “sum(int, int)” will not match the “int” filter | E.g. “sum(int, int)” will match the “int” filter |
| Show function arguments | E.g. “sum(int, int)” will be shown as “sum(int, int)” | E.g. “sum(int, int)” will be shown as “sum()” |
| Show entity qualifiers | Classes, structures, unions, static/virtual methods, namespaces and typedefs will be prefixed by the corresponding keyword. | Only const methods, will be shown with a special keyword. |
You can also find an automatically updated detailed list of VisualGDB settings on this page.
C++ Templates
Because different template specializations can behave completely differently, VisualGDB tracks the relations for each specialization separately. E.g. searching for incoming calls to the constructor of std::vector (1) will show the discovered calls for each specialization (2) separately:  Note that in order to meaningfully distinguish different specializations, you would need to enable to specialization display (4) in the Details view. Enabling scope display (3) is recommended to understand the scope of the discovered callers.
You can quickly reveal the entire call tree by repeatedly using the Load One Level button (5). It works reasonably fast. E.g. searching the entire CMake code base (~64K symbols) for incoming calls to 1000 different methods only takes about a second. You can then quickly navigate the results using the Filter view, or export them to Clipboard using the Copy All context menu command.