Code Explorer – Outline
This page provides an overview of the Outline view in Code Explorer.
Contents
Overview
Navigating the Outline
Favorite Items
Included Files
Comments
Filters
Settings
Details View
Overview
Outline view is the default Code Explorer view. It displays 3 kinds of information about the current source file:
- A tree of all headers included by the current source file (A)
- All classes, methods, and other C/C++ entities declared in the file (B)
- Structural blocks from the code (e.g. #ifdef, for{}, special comments) (C)
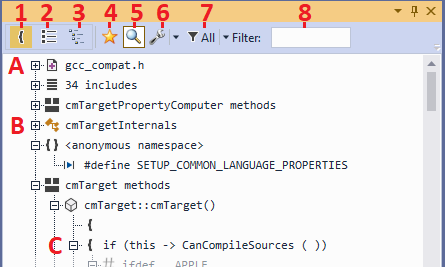 The Code Explorer toolbar provides the following controls:
- View mode selector that allows selecting:
- Outline view (1)
- Global symbol list view (2)
- Global symbol tree view (3)
- Favorites only mode (4) that allows only displaying favorite items.
- Detail view button (5) that shows or hides the details view.
- Outline settings button (6)
- Entity type filters (7)
- Quick name-based filter (8). Pressing Enter in the filter view expands paths to all matching nodes.
Favorite Items
Any item that corresponds to a C/C++ entity (e.g. a class or method, but not a for() statement) can be marked favorite by clicking on the star icon in the left part of any view: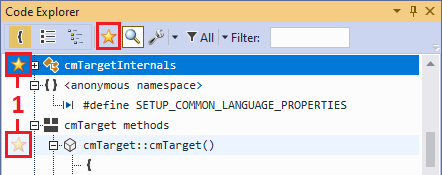 Favorite flags are remembered on solution level (stored in <Solution Directory>.visualgdb\CodeExplorer\NodeFlags.dat) and affect both Outline/Globals view, as well as the detail view. You can use them to tag relevant items and quickly find them later.
Non-entity items (e.g. #ifdef statements) cannot be flagged favorite, however VisualGDB will keep a track on whether the corresponding node in the Outline view was collapsed or expanded.
Included Files
If enabled via settings, the outline view will show tree of header files (1) processed while parsing the main source file. This includes forced includes referenced via command line, and the gcc_compat.h file used by VisualGDB to improve IntelliSense compatibility with GCC.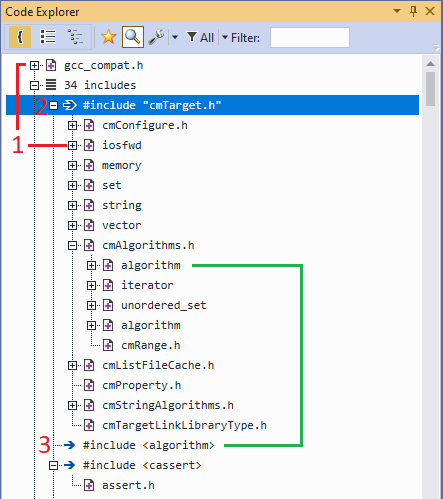 The included files are shown in the order they were actually included during the parsing (the “show included file tree” setting must be turned on).
The Code Explorer can also show all #include directives found in the source file (controlled by the “show include directives” setting). If the include directive was processed and the including file included other files, they will be attached to the directive (2). If included file did not include any other files, or was skipped to avoid duplicate inclusion, the corresponding #include node will not have any children (3).
Double-clicking on the include directive (or file) node opens the location of the directive. You can open the included file by selecting the “Open included file” command from the context menu.
Navigating the Outline
The Outline view is designed to be easy to navigate. VisualGDB will remember the state of each node for each file when you close the solution, and will restore it next time you open it.
Pressing ‘Enter’ after entering a filter automatically expand all parent nodes of the matches, making sure the matches are visible. Additionally, you can quickly expand or collapse various nodes using context menu commands: The following collapsing/expanding commands are supported:
| Command | Affects |
| Direct children | All immediate children of the selected node (not recursively) |
| Children (recursively) | All children of the node, and their children (recursively) |
| All siblings | All nearby nodes at the same level (e.g. other members of the same class) excluding the selected node |
| Nodes at this level | Same as “All siblings”, but includes the selected node |
| Nodes of the same type | All nodes in the entire Outline with the same icon |
| Nodes above | All nodes in the entire outline, that are above the selected node |
| Nodes below | All nodes in the entire outline, that are below the selected node |
If you are investigating an error message inside a large source file with numerous nested blocks, understanding the current context (e.g. an 5 levels of if() blocks inside a method of a nested class) could be non-trivial. To simplify this task, the bottom of the outline view always shows the scope of the currently selected node: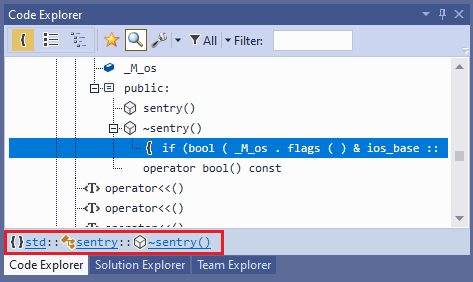 The scope only includes valid C/C++ entities (e.g. namespaces or classes) and does not show code blocks. Use the “Collapse->Nodes Above” context menu command to quickly see all parents of the current node, including the code blocks.
Comments
The Outline view can recognize special comments as dividers between parts of the source file, and show them as collapsible blocks: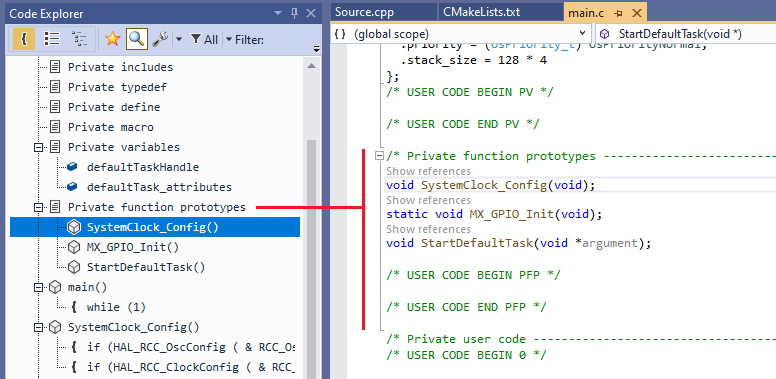 The regular expressions for comment groups are defined in the %VISUALGDB_DIR%\CppEngineTuningInfo.xml file. You can define additional groups by either editing the file (will be replaced next time you update VisualGDB), or by copying the file in the %LOCALAPPDATA%\VisualGDB directory and removing all other contents from it. E.g. saving the following file under %LOCALAPPDATA%\VisualGDB\CppEngineTuningInfo.xml will make VisualGDB recognize “//////” as code separators:
<?xml version="1.0"?> <ClangEngineTuningInfo xmlns:xsi="http://www.w3.org/2001/XMLSchema-instance" xmlns:xsd="http://www.w3.org/2001/XMLSchema"> <CommentGroupingRules> <CommentGroupingRule> <ID>cpp.long.slash</ID> <DisplayText>///////</DisplayText> <MinLines>3</MinLines> <Variants> <CommentVariant> <Regex>/{10,}</Regex> <NameFormat>More code</NameFormat> </CommentVariant> </Variants> </CommentGroupingRule> </CommentGroupingRules> </ClangEngineTuningInfo> |
Note that each CommentGroupingRule element must contain the following parts:
- The ID element specifies a unique ID used to turn off individual rules via settings
- The MinLines element controls the minimum number of lines between the matching comments, in order to create an outlien block
- DisplayText specifies the name that appears in Outline settings
- CommentVariant elements specify different variants of the separator comment, that are considered interchangeable
Comment groups can be nested. E.g. consider the following file:
// Test Group: Group 1 // Test: Test 1 void Test1(); // Test: Test 2 void Test2(); // Test Group: Group 2 |
If “Test Group:” and “Test:” comments match two different rules, VisualGDB will automatically place the “Test” blocks inside the “Test Group” blocks.
Filters
The contents of the Outline view can be filtered by the “favorite” flag (1), entity type (2) and name (3). Items that are not C/C++ entities (e.g. if{} blocks) can be turned off via settings.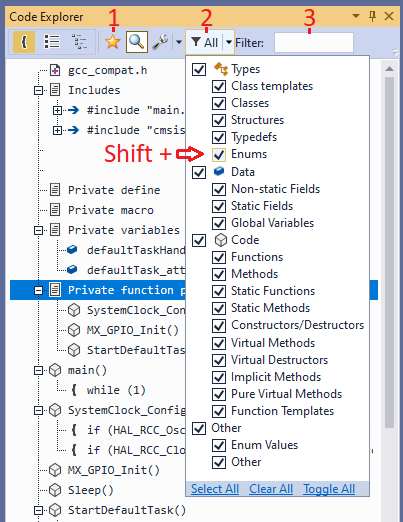
Note that holding Shift while clicking at the entity type filter will instantly uncheck all other entities. Clicking it with Shift again will instantly enable them.
Settings
The outline view can be configured in numerous ways via the Settings drop-down or via Tools->Options->Text Editor->C/C++(VisualGDB)->Code Explorer (see this page for an automatically updated list of settings):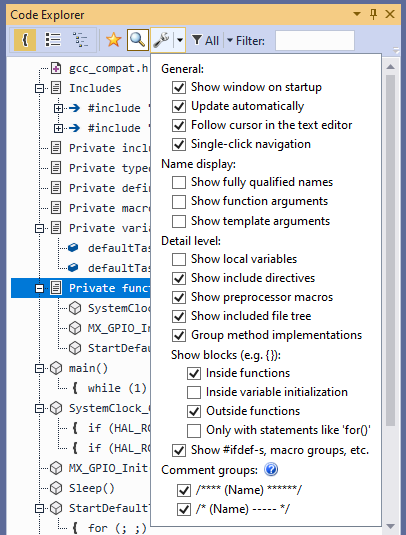 The table below explains most commonly used settings:
| Setting | Meaning |
| Show window on startup | If enabled, the Outline window will be always shown when opening a VisualGDB-based project. If disabled, you would need to open Code Explorer manually via View->VisualGDB Code Explorer. |
| Update automatically | If enabled, the Outline will be automatically updated when the source file is rescanned. Note that saving a source file always triggers a rescan. |
| Follow cursor in the text editor | If enabled, moving the cursor in the next editor will automatically select the outline node that corresponds to it. |
| Single-click navigation | If enabled, clicking on any node in Outline will immediately move the cursor to its location. If disabled, this can be achieved by double-clicking on the node. |
| Show fully qualified names | If enabled, all nested entity nodes (e.g. methods) will show the full name (e.g. Class::Method() instead of just Method()). |
| Show function arguments | If enabled, all function nodes will show the types of arguments (e.g. sum(int, int) instead of sum()). |
| Show template arguments | If enabled, template specialization nodes will show the template arguments (e.g. TypeTraits<int> instead of TypeTraits) |
| Show blocks – inside functions | If enabled, the outline will show separate nodes for each {} blocks inside functions/methods (including the if {} and for {} statements). |
| Show blocks – inside variable initialization | If enabled, the outline view will show separate nodes for variable initialization blocks (e.g. int x[] = { … }). |
| Show blocks – outside functions | If enabled, the outline view will show separate nodes for the “{}” blocks outside functions. This does not affect classes, namespaces and other C/C++ entities, and is only useful when dealing with entities that could be parsed correctly. |
| Show blocks – only with statements | Enabling this will only create the “{}” block nodes if they follow an if-like statement. |
| Comment groups | This section allows individually enabling each comment group rule |
Details View
The details view is enabled using the “Details” button in the Code Explorer toolbar:  See this page for a detailed overview of the outline details.
