Advanced Navigation Bar
VisualGDB 6.0 and newer replaces the regular navigation bar in the upper part of the source editor with its own advanced version: The advanced navigation bar provides a quick and convenient way to see the context of the code being edited:
- The project context (1) shows the current project, included file tree, and allows opening the file from another project’s context.
- The file context (2) shows where exactly in the file you are.
- The data context (3) shows the current function argument or assigned variable.
- The target context (4) shows information about the entity under the caret.
Auxiliary buttons in the right corner provide shortcuts for:
- Going to the definition of the selected entity (5)
- Analyzing the IntelliSense parse timing (6)
- Editing the current clang-format file (7)
- Toggling CodeJumps annotations (8)
Project Context
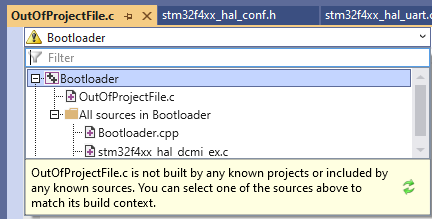
The first drop-down box in the navigation bar shows the project context of the currently edited file: E.g. if both main application and the bootloader use the same UART driver with different sets of #define-s, you can select either of the projects in the project list (1).
Include file tree (2) recursively shows all headers included by the current source file, allowing you to open each of them, or jump to the corresponding #include<> directive (3).
Header files that are included by different source files could have considerably different context depending on the including file. E.g. when included by a .cpp file, the #ifdef __cplusplus blocks will get activated, while including it from a .c file would leave them disabled. When editing headers, VisualGDB automatically takes the context from the most recently viewed source file, showing its name in the bar (4). You can then see and navigate the chain of #include<> directives leading to that header (5) or open it in the context of another source file (6).
If you open a file that is not explicitly included in any of the projects, you can use the project context view to copy the context (i.e. list of header search paths and #define-s) from one of the existing source files:
File Context
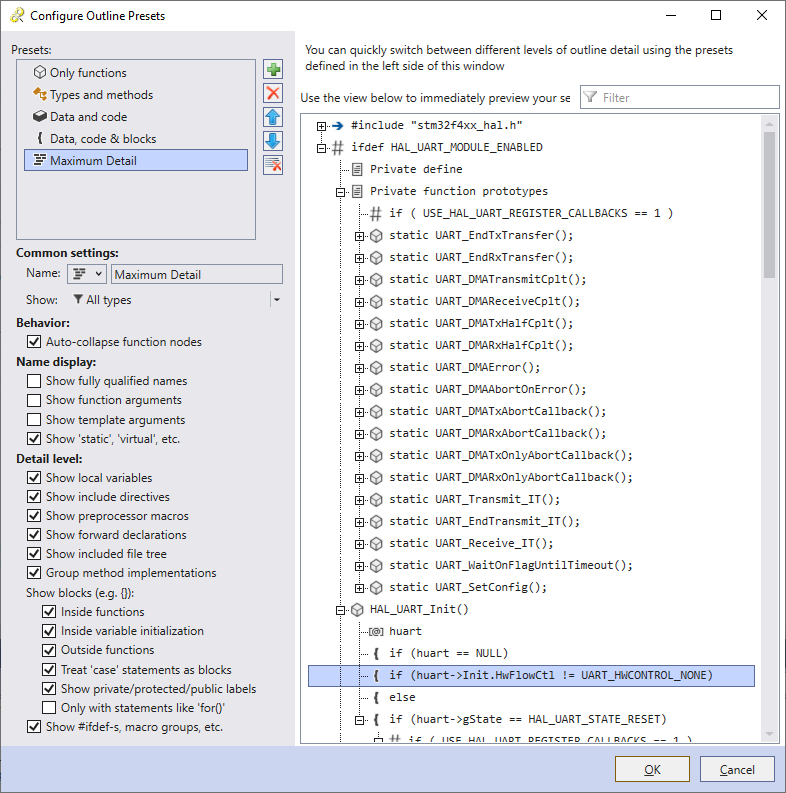
The second drop-down box in the navigation bar is the file context. It shows where exactly in the file you are located. You can configure it to show any detail level from a plain list of functions to a super-detailed tree of all #ifdefs, comment blocks and every single if{} statement: The detail level is controlled via the selector at the bottom of the bar (1) and can be tweaked to the finest detail (2). If you hold Ctrl, the labels in the file context view become clickable, so you can quickly go to the beginning of the current method, class, namespace, or any of the if/for/while statements. The “Explore outline” button opens the file structure in a separate Code Explorer window, so you can keep a track of the structure without having to open the drop-down bar.
The detail levels of the file navigation bar are called outline presets. You can edit them, or define your own ones by clicking the preset configuration button (2) and choose which entity types to show (e.g. functions, classes, variables), whether to show if()/for()/switch()/case statements in the tree, etc: The outline presets are stored in %LOCALAPPDATA%\VisualGDB\OutlinePresets and can be easily deployed to other machines.
Data Context
The Data Context drop-down helps you quickly understand where the currently selected expression is going. Consider the following code:
GPIO_InitTypeDef GPIO_InitStructure = { GPIO_PIN_12, GPIO_MODE_OUTPUT_PP, GPIO_NOPULL, GPIO_SPEED_FREQ_HIGH, 0 }; |
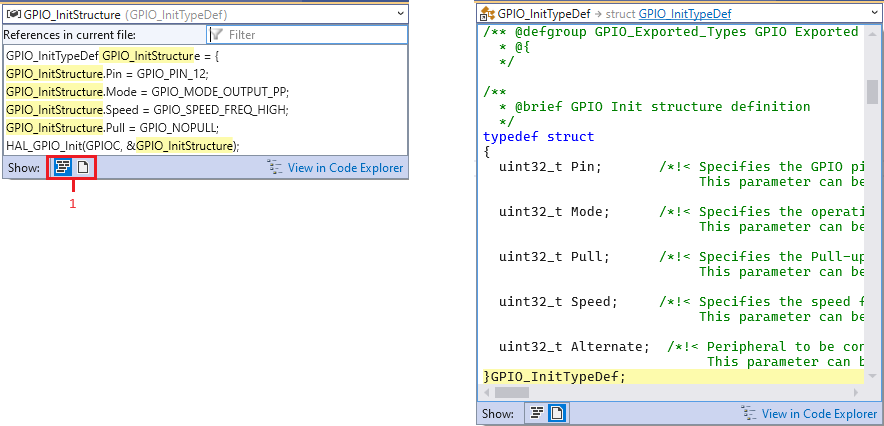
It initializes the fields of GPIO_InitStructure in the order in which they were declared, so getting the exact field corresponding to each line would require looking up the structure definition. Data Context view does exactly that: shows the current structure field or function argument whenever you are editing one, and gives you a convenient table showing how other fields/arguments are initialized:
Target Context
The rightmost drop-down in the navigation bar shows information about the entity that is currently under the caret. Depending on how much can fit in one line, it will show:
- The fully qualified name of the variable or type (e.g. std::string::npos) with each component turning into an individually clickable hyperlink when you hold Ctrl.
- The type of the variable, target type of a typedef, or arguments and return type of a function.
- The value of a preprocessor macro or explicitly defined enum constant.
Opening the drop-down box can show either the local references (all uses of a variable within the current source file) or the definition of a structure/variable that is currently under the caret.
Settings
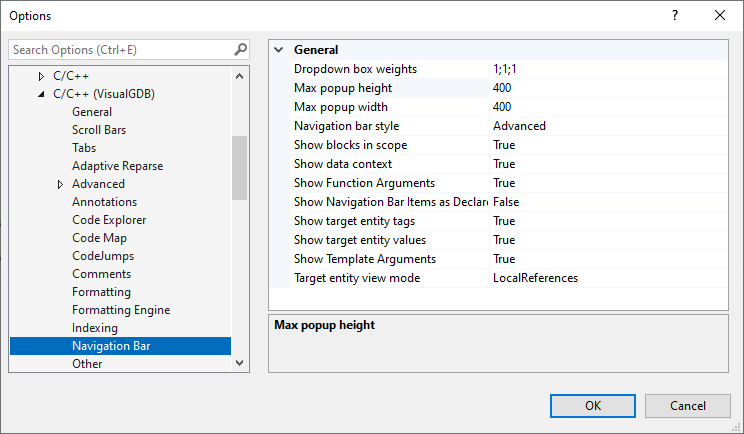
You can configure various settings of the smart navigation bars (e.g. popup size, drop-down box width weights, etc) via Tools->Options->Text Editor->C/C++ (VisualGDB)->Navigation Bar:

