Tracing Externally Built Projects with Quick Debug
This tutorial shows how to use Software Tracing with the Quick Debug feature to record the execution of a project that was built outside VisualGDB on a different machine.
We will first use a Linux machine to build a basic USB-controlled embedded application using the mbed framework, and then will copy the ELF file along with the sources to the Windows machine and will use VisualGDB to create trace of all commands received by it via USB.
Note that if are already using VisualGDB to build your project, you can trace it much easier via the regular debugging GUI (see this tutorial). The steps shown in this tutorial are only needed if you want to trace an existing project without having to change its build process.
Before you begin, install VisualGDB 6.0 or later.
- Install the mbed tools on the Linux machine. For Debian-based distributions, the command below should suffice:
sudo apt install gcc-arm-none-eabi python3-pip git mercurial
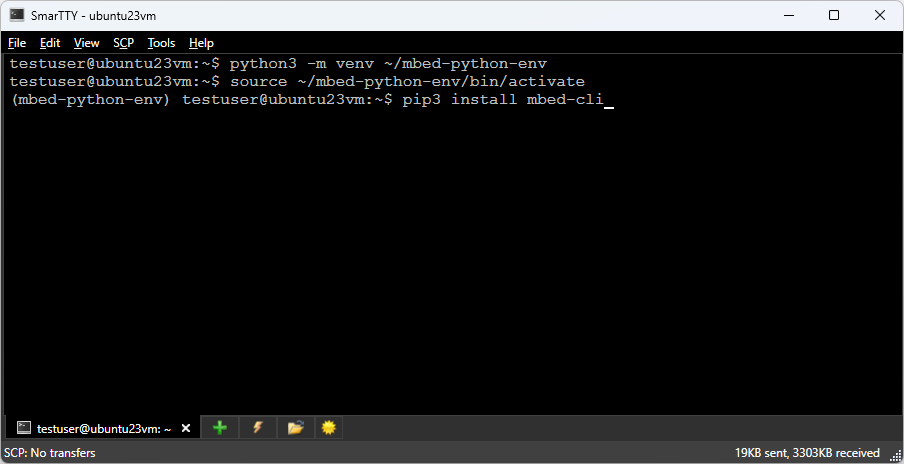
- Create a separate virtual Python environment and install the mbed scripts into it:
python3 -m venv ~/mbed-python-env
source ~/mbed-python-env/bin/activate
pip3 install mbed-cli
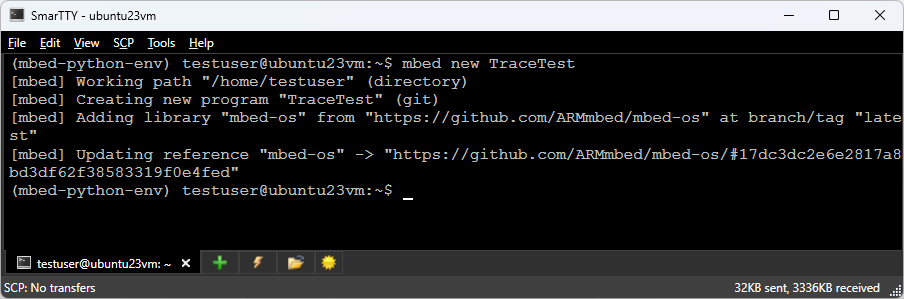
- Once the mbed tools are ready, create a new mbed project by running mbed new <Project Name>:
- Once the project is created, add a file called main.cpp with the following contents to the project directory:
#include "mbed.h"
#include "USBSerial.h"

#if !defined(DEVICE_USBDEVICE) || !DEVICE_USBDEVICE
#error The current target does not support the USB interface
#endif

USBSerial serial;

int main()
{
    DigitalOut led(LED1);

    while (true) {
        char ch = serial._getc();
        if (ch == '1')
        	led = true;
        else if (ch == '0')
        	led = false;
    }
}
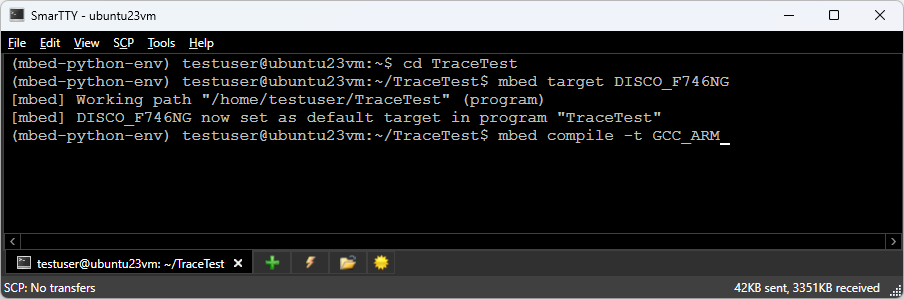
- Select the target board (mbed target <Target name>) and build the project using the ARM toolchain (mbed compile -t GCC_ARM):
- Once the project finished building, take a note of the .bin file:
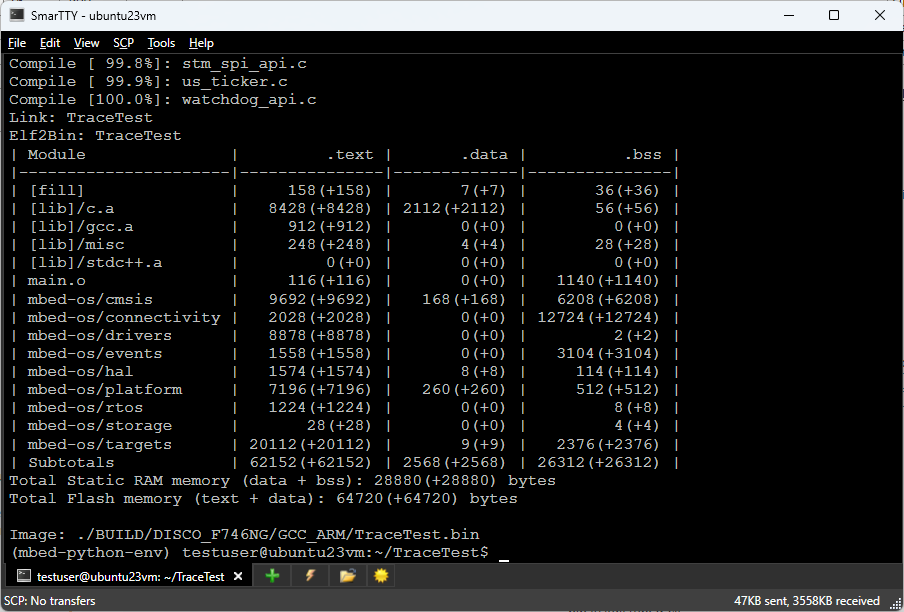 In order to debug and trace the application, you would need to point VisualGDB to the ELF file (containing both the code and debug symbols) that has the same name as the .bin file, and the .elf extension.
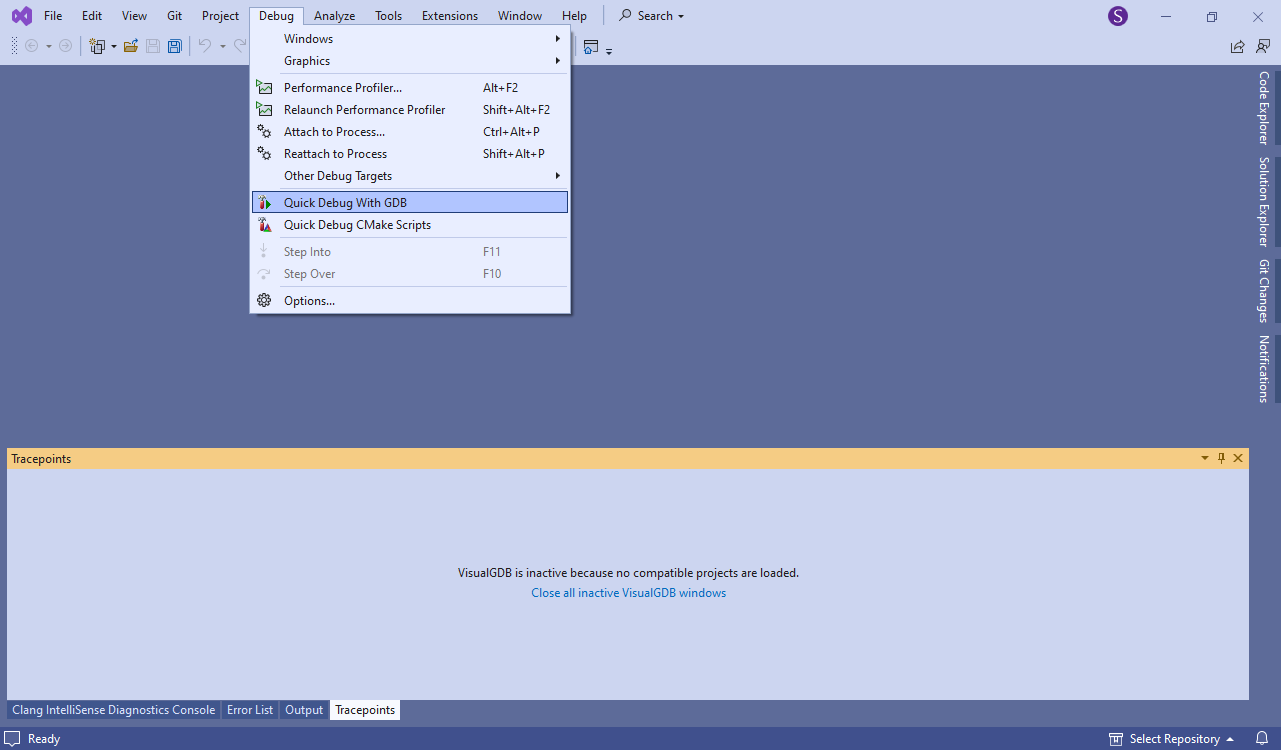
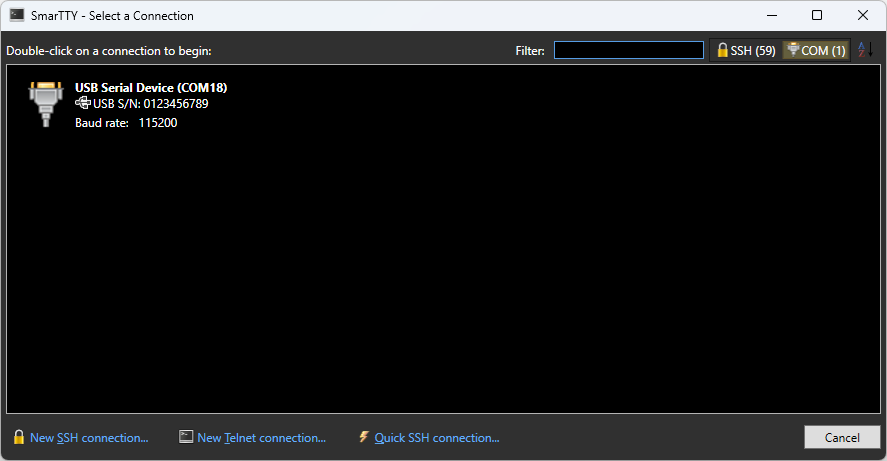
 - Copy the project sources and the ELF file to the Windows machine. Start Visual Studio and select Debug->Quick Debug with GDB:
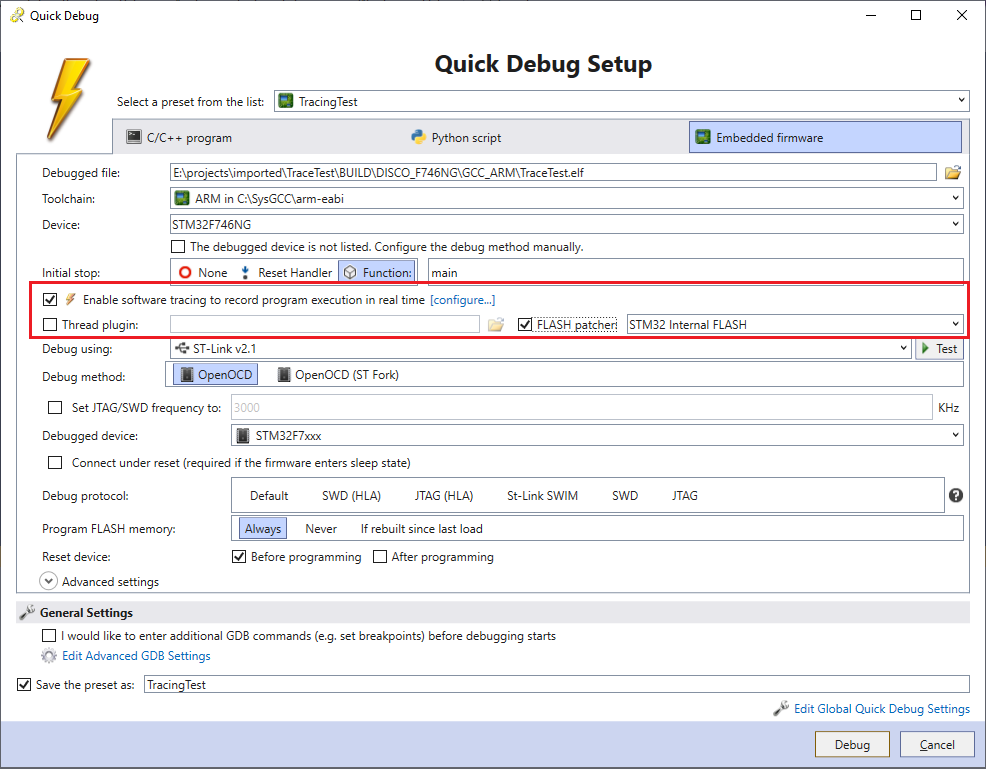
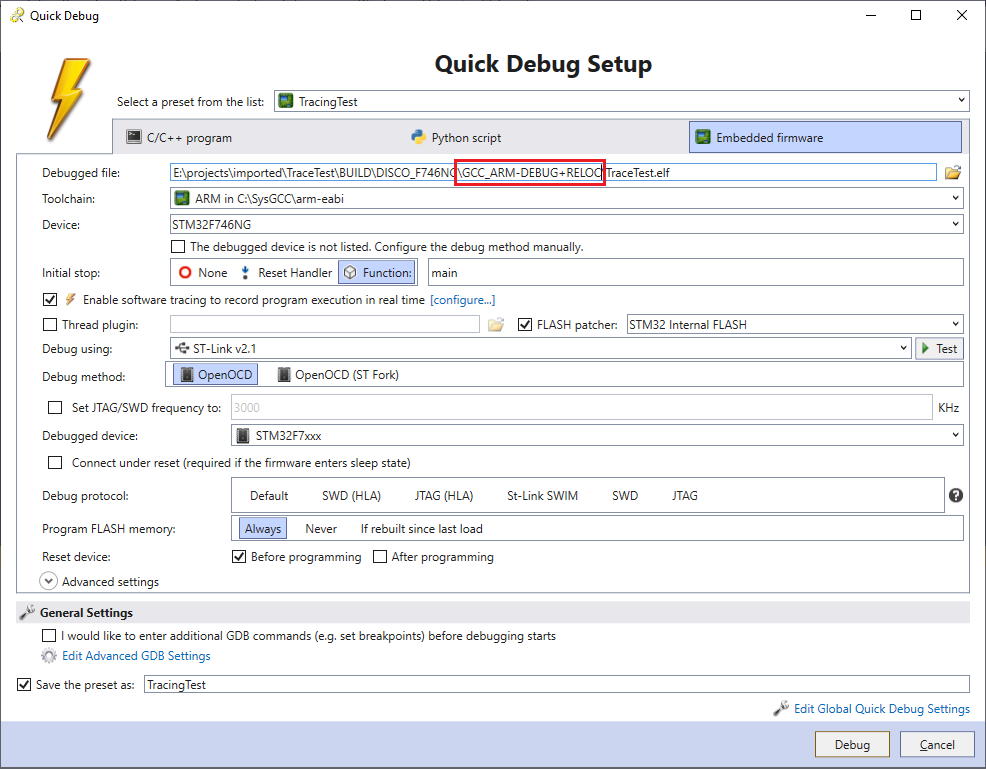
- Create a new embedded Quick Debug preset, point VisualGDB to the ELF file, and enable software tracing. If VisualGDB supports FLASH hotpatching for your device, enable it so you won’t need to restart debugging after changing the tracepoints:
- If you try debugging now, VisualGDB will report missing relocation records inside the ELF file:
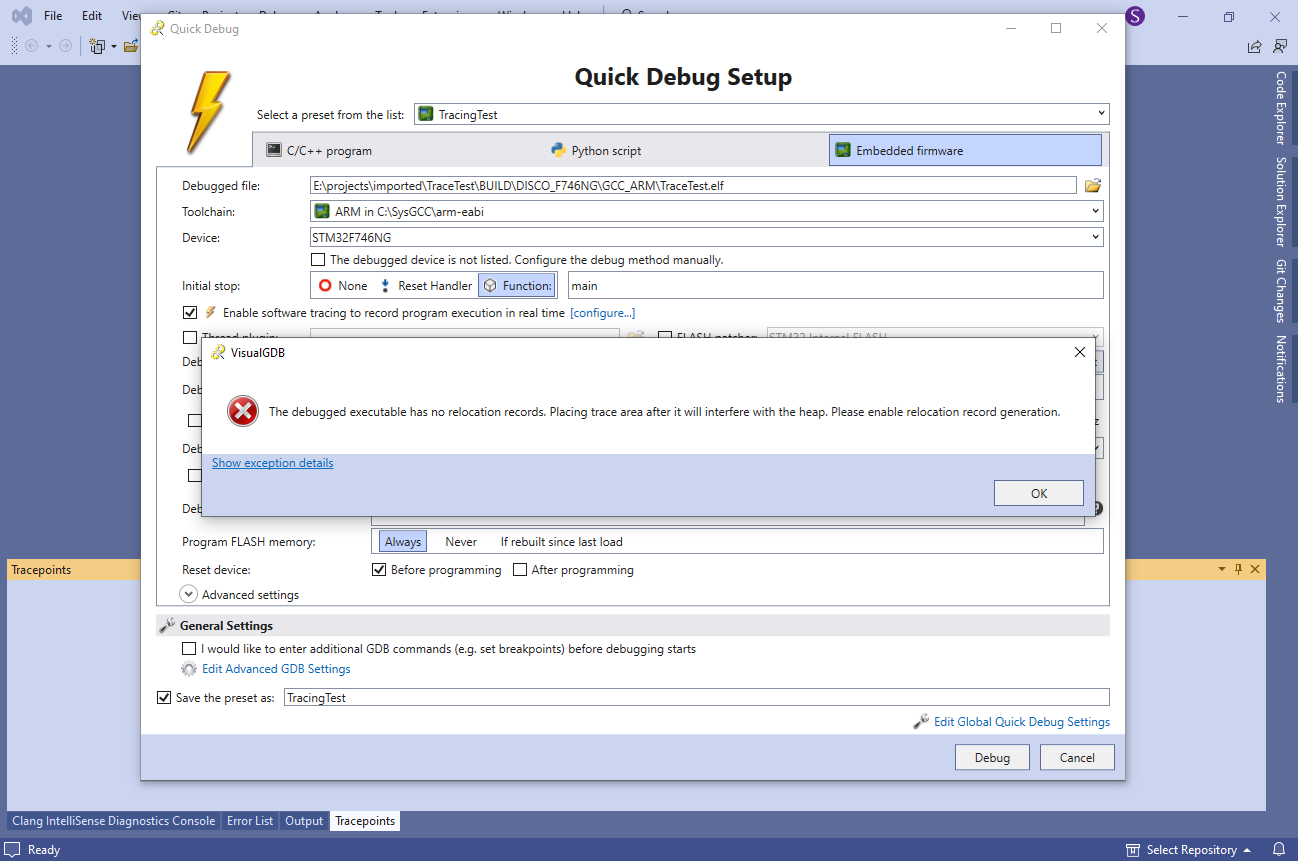 This happens because in order to do software tracing, VisualGDB needs to reserve a part of the target memory for the tracing programs and data. VisualGDB can do it automatically by relocating the heap or stack (thus, requiring the relocation records in the ELF file) or you can do it manually by declaring an otherwise unused buffer variable and pointing VisualGDB to it. In this tutorial we will use the first approach and will enable relocation records on mbed side.
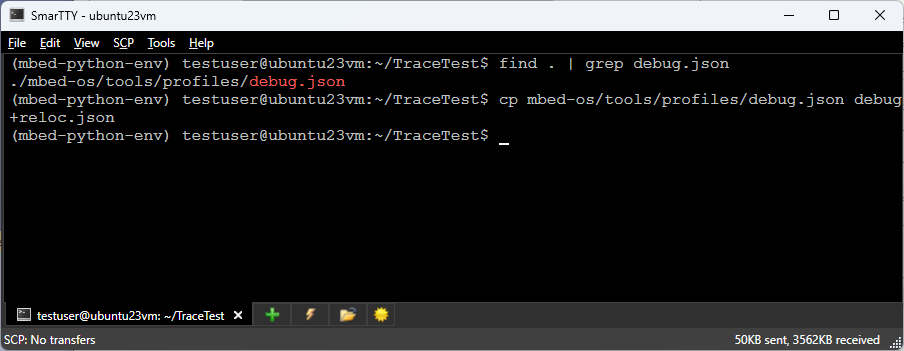
 - In order to produce relocation records, you need to add “-Wl,-q” to the linker command line (LDFLAGS). For mbed this can be done by copying the debug.json profile to the project directory and patching it. You can find the profile path by running “find . | grep debug.json“:
- Patch the local copy of the profile so that ld flags for GCC_ARM will contain “-Wl,-q“:
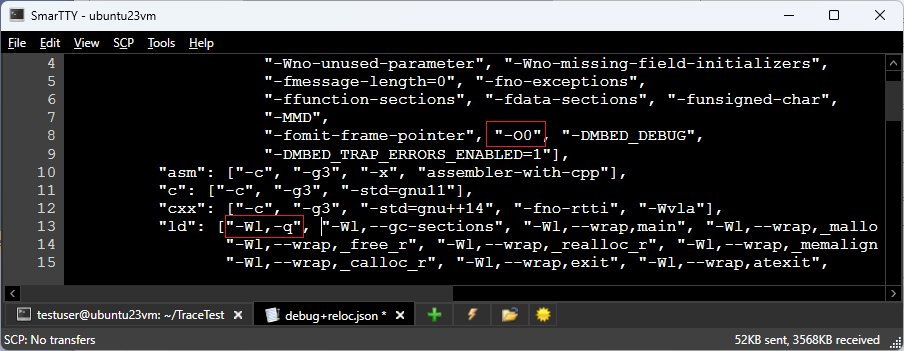 We also recommend replacing “-Og” with “-O0” for better debugging experience.
 - Build the project using the new profile:
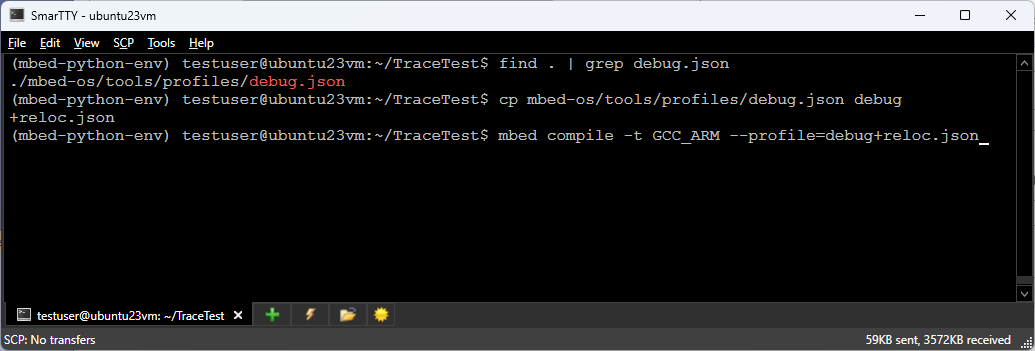
mbed compile -t GCC_ARM --profile=debug+reloc.json
- Copy the new ELF file to the Windows machine and update the path in the Quick Debug window:
 Now you can click Debug to start debugging and tracing the program.
 - The application shown in this tutorial uses the USBSerial class to emulate a serial port via a second USB port (separate from the ST-Link USB port). Make sure that port is connected and open it in a terminal program:
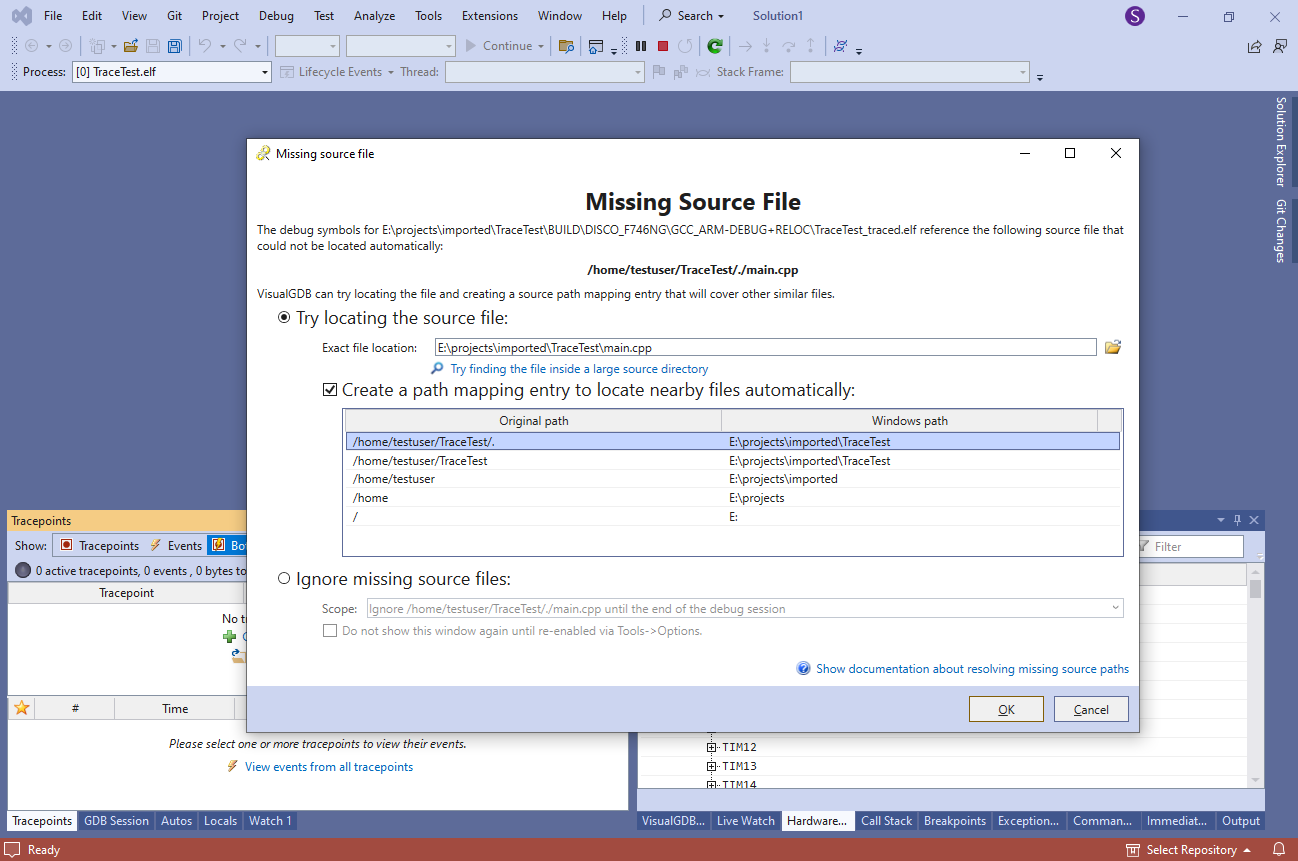
- The initial breakpoint in main() will trigger. However, because the program was built on a different machine, VisualGDB won’t know the location of the main.cpp file on the Windows machine and will ask for it. Locate it manually and create a rule to automatically map other source paths:
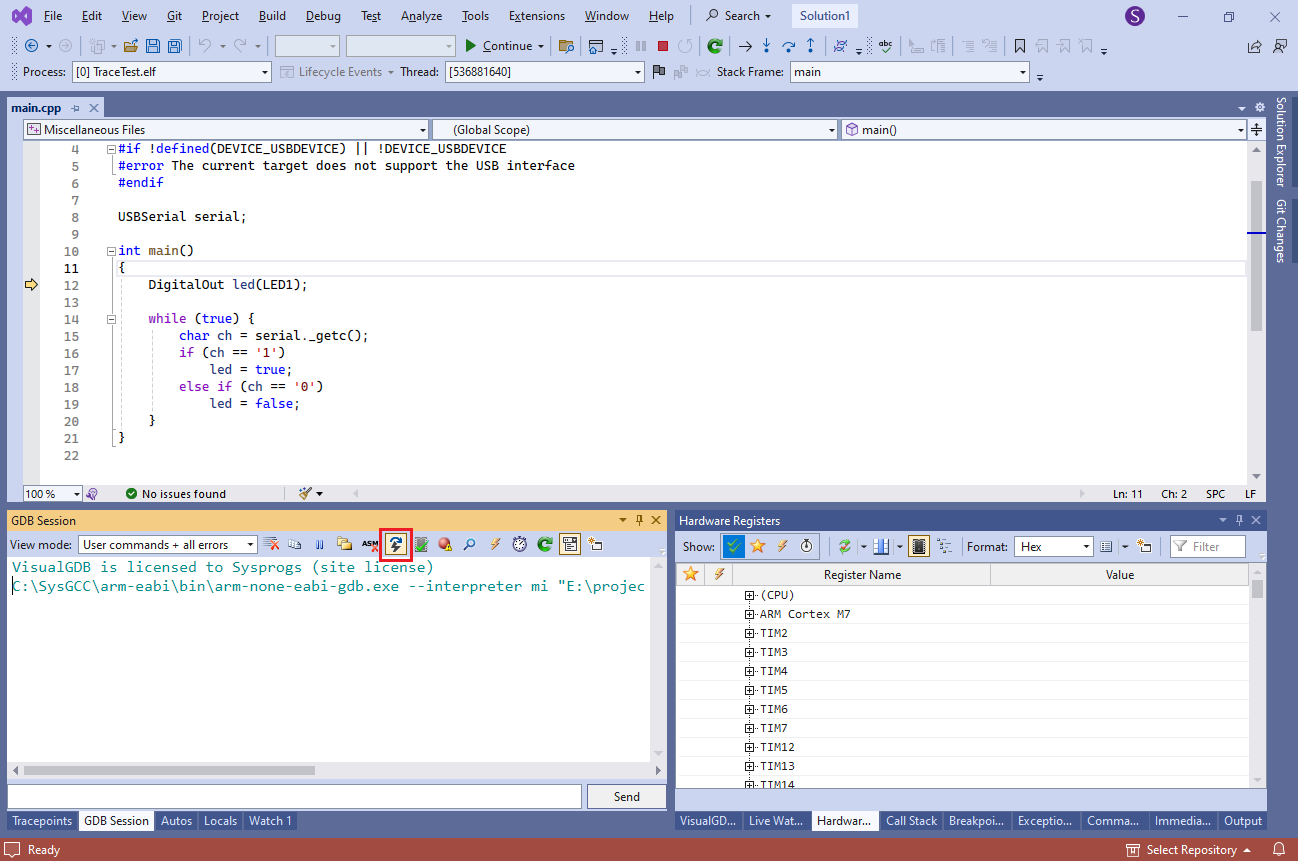
- Try pressing F10 step over the DigitalOut initialization. If GDB ends up stepping into an interrupt handler, you can enable stepping over interrupts in the GDB Session window, step out of it (Shift-F12) and step over again (F10):
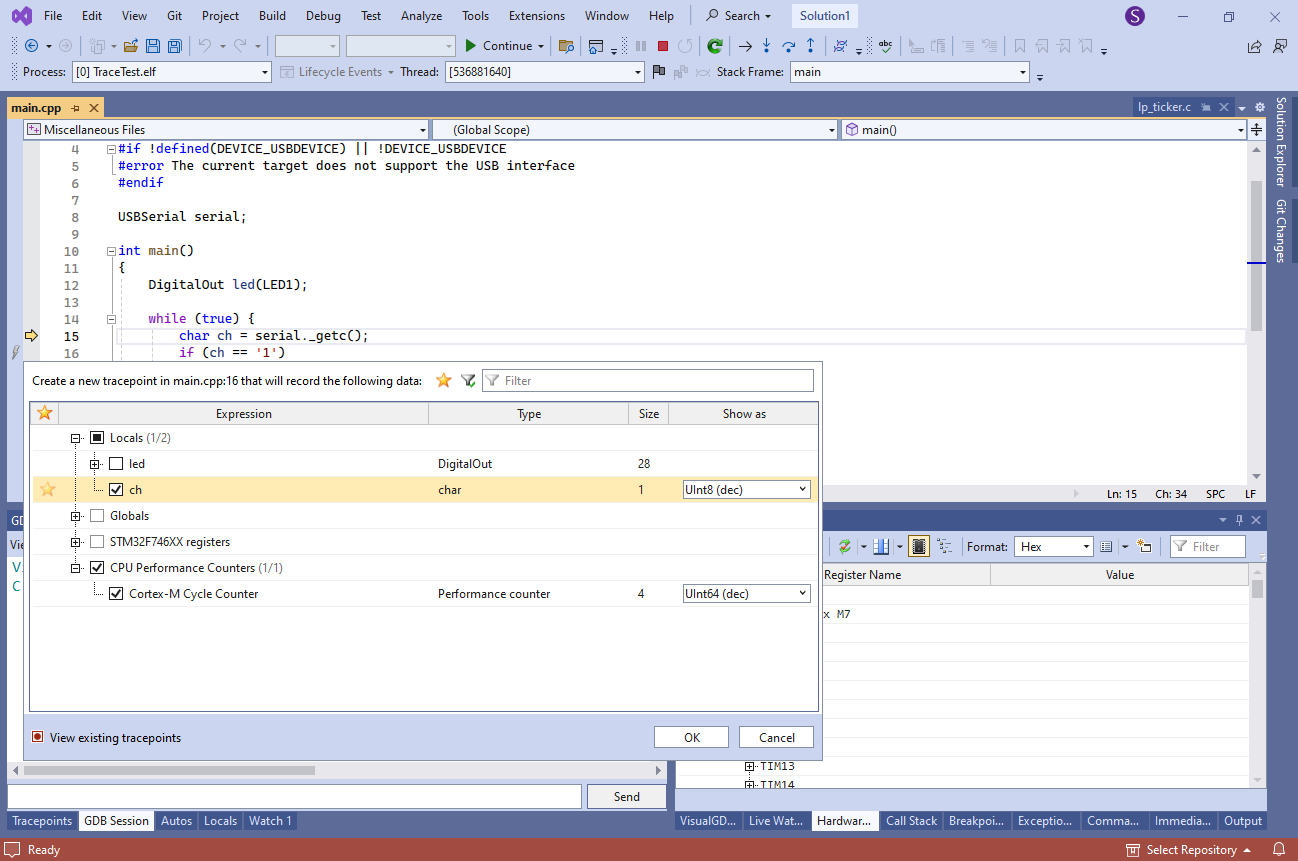
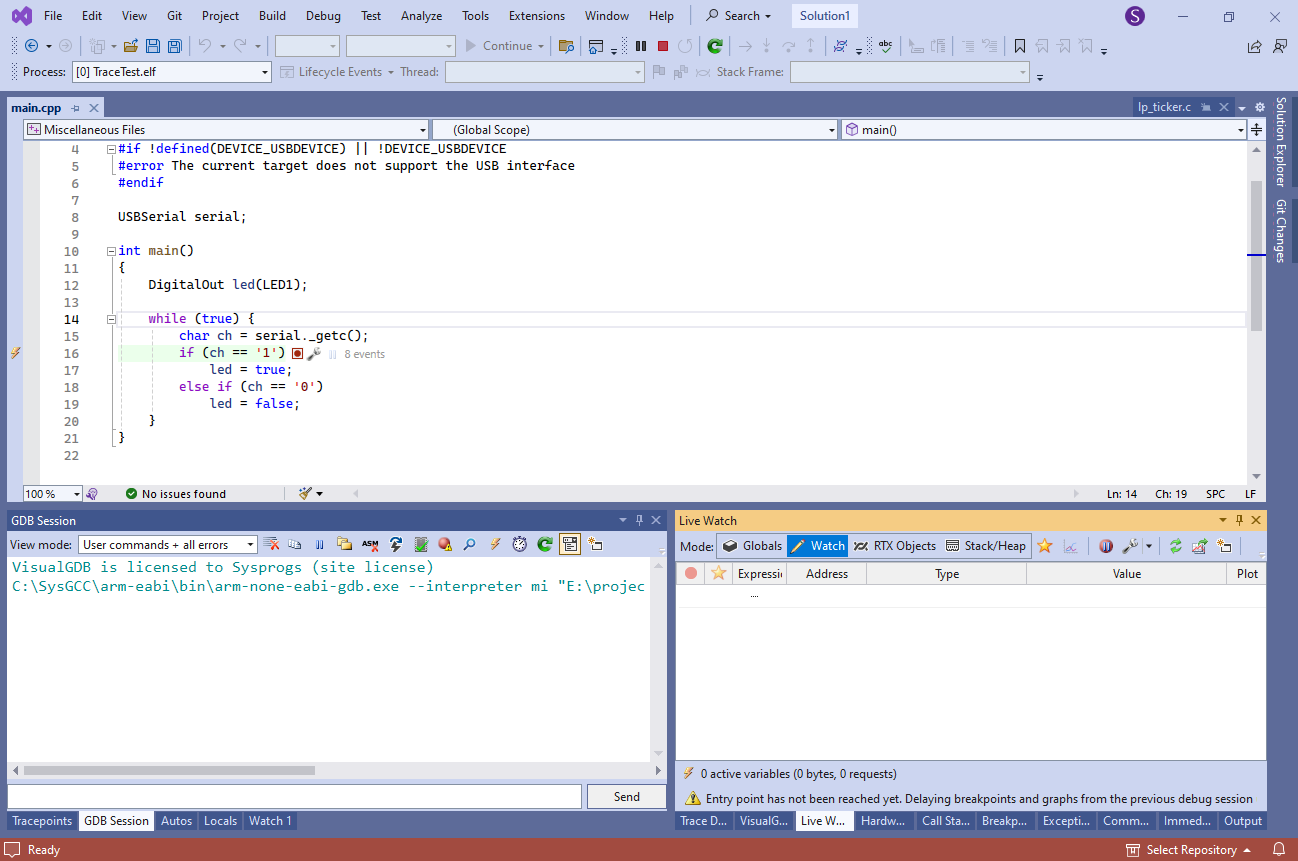
- Try setting a tracepoint at the first line that checks the value of ch. Configure it to trace ch and the Cortex-M cycle counter:
 Then, press F5 to continue debugging.
 - If you are debugging a device supported by the FLASH hotpatching framework, the tracepoint will get applied immediately. Otherwise, it will be stored in the Quick Debug profile and will take effect during the next debug session. Try sending some characters to the virtual COM port and observe how the LED immediately turns on or off, and the trace event count is incremented:
 Tracing works directly on the target without stopping it in a debugger, so it can be used to capture events in real time, and review them later.
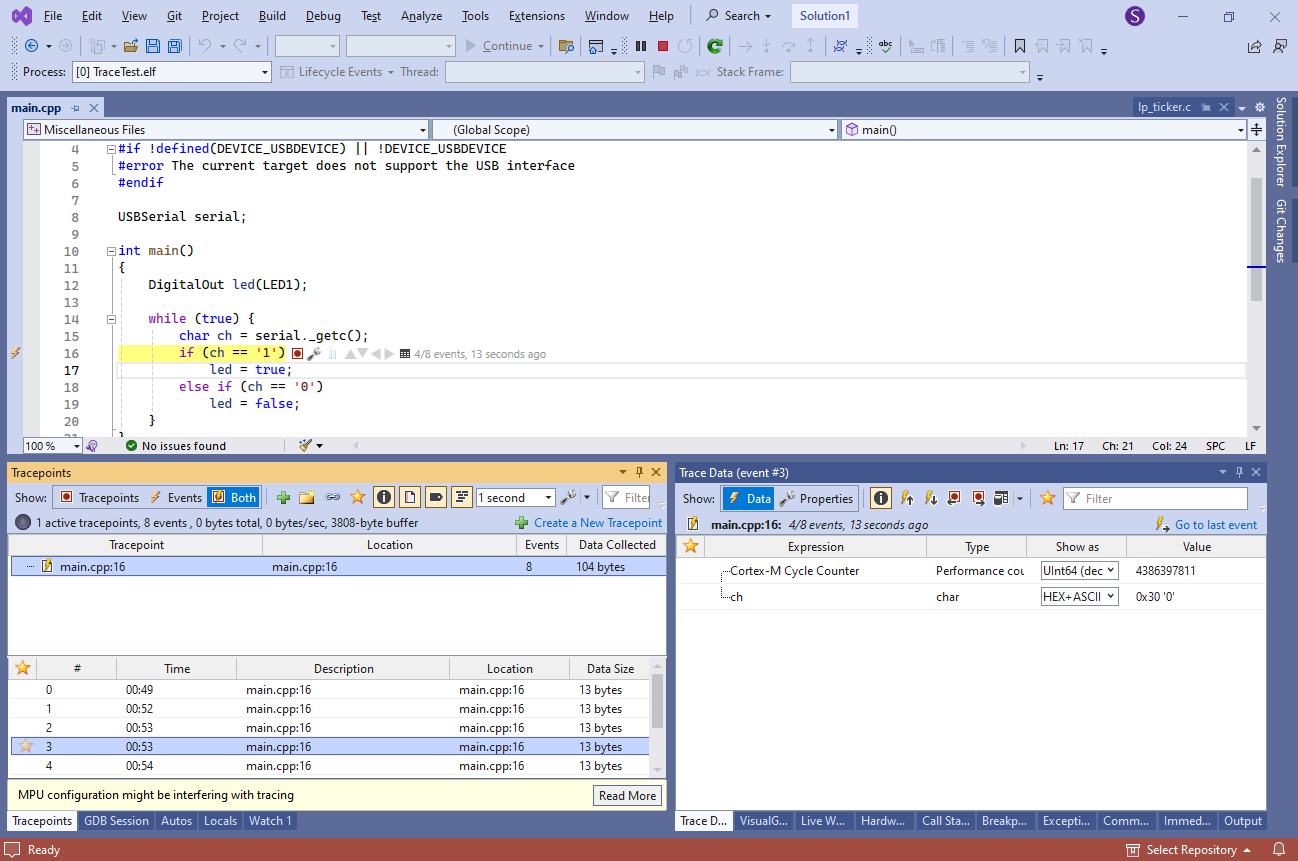
 - Click on the “N events” link or go to Debug->Windows->Tracepoints to review the captured events:
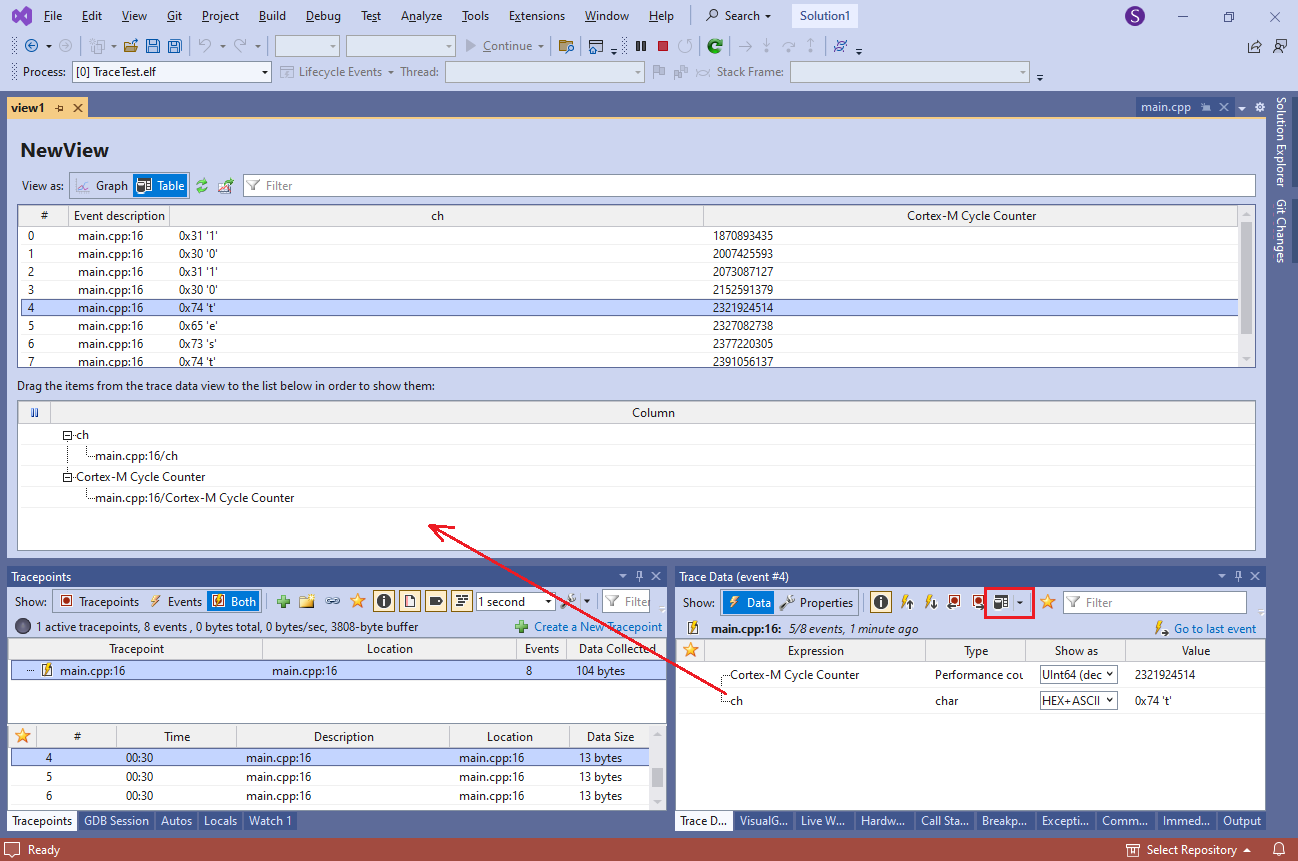
- You can create table views and drag the variables from the Trace Data window to them to quickly see the value of a variable captured at different times. Try adding ‘ch’ and the cycle counter to separate columns to see the exact characters received via the USB port, along with precise timestamps:
 Double-clicking on a row in the table will select that event, allowing you to review other captured data, or step forwards or backwards in time.
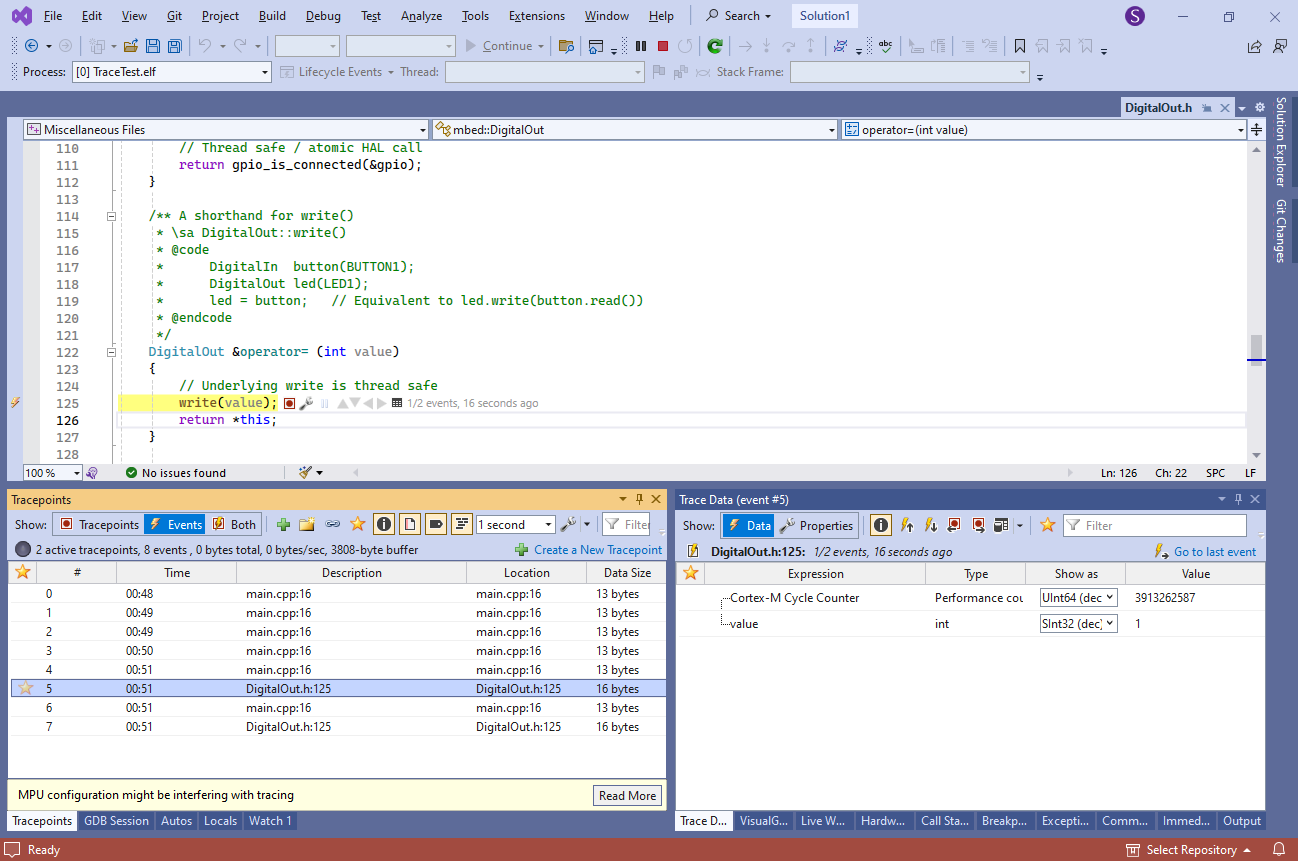
 - Try setting a breakpoint on the “led = true” line and stepping in it. Once inside the operator=() implementation, set another tracepoint capturing the value. The tracepoints window will now show how receiving ‘1’ or ‘0’ via USB immediately triggers the tracepoint in the operator:
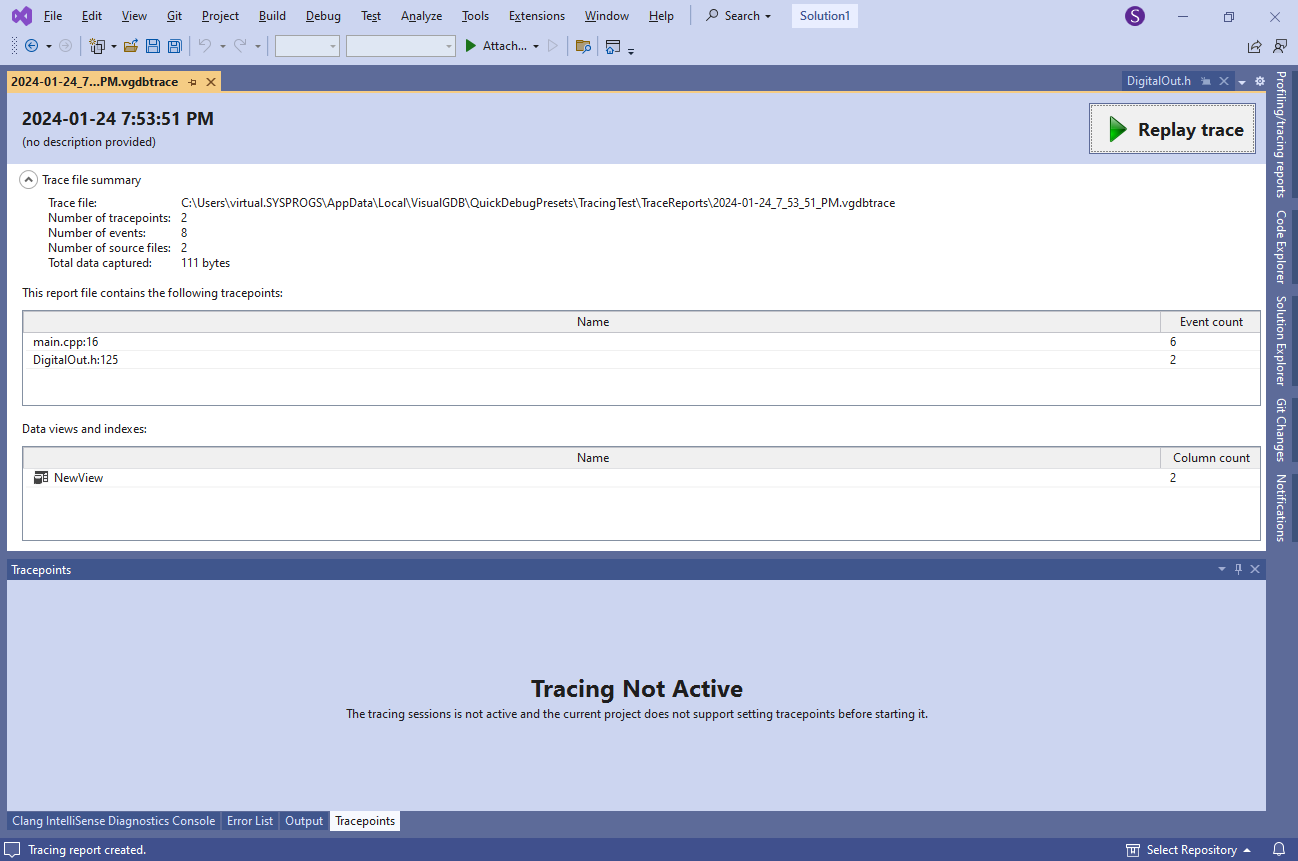
- Once the debug session is over, VisualGDB will save all recorded data into a trace file. You can open it later via File->Open to step through the recorded events or view the tables created via the Trace Data window: