Obtaining Diagnostic Output
This page shows different types of diagnostic output produced by VisualGDB and provides instructions on making the best use of it.
Build Command Lines
Unless you are using MSBuild, building your VisualGDB project typically involves running an external build tool (e.g. Make, CMake, mbed-cli, etc). If you are troubleshooting a build issue, it could be useful to get the exact command line used by VisualGDB to launch it, including the environment. You can do it by locating the command line in the VisualGDB Build window (shown in cyan), right-clicking on it and selecting “Dump Command Line to a Batch File”: This will create a .bat file containing all the relevant environment, working directory and the exact command line:
REM Run "C:\PROGRA~2\Sysprogs\VISUAL~1/ninja.exe " in directory "c:\projects\temp\ESPIDFDemo/VisualGDB/Debug" on local computer cd /d c:\projects\temp\ESPIDFDemo/VisualGDB/Debug set LANG=en_US.UTF-8 set PATH=C:\SysGCC\esp32\opt\xtensa-esp32-elf\bin;C:\SysGCC\esp32\mingw32\bin;C:\SysGCC\esp32\usr\bin;C:\SysGCC\esp32\opt\xtensa-esp32-elf\bin;C:\SysGCC\esp32\mingw32\bin;C:\SysGCC\esp32\usr\bin;%PATH% set TOOLCHAIN_ROOT=C:/SysGCC/esp32 set EFP_BASE=C:/Users/virtual.SYSPROGS/AppData/Local/VisualGDB/EmbeddedEFPs set TESTFW_BASE=C:/Users/virtual.SYSPROGS/AppData/Local/VisualGDB/TestFrameworks set TESTFW_BASE_LOCAL=C:/Users/virtual.SYSPROGS/AppData/Local/VisualGDB/TestFrameworks set IDF_PATH=C:\SysGCC\esp32\esp-idf\v4.0 set SYSPROGS_COMPONENTS_DIR=C:/SysGCC/esp32/esp-idf/SysprogsComponents set CMAKE_MAKE_PROGRAM=C:/Program Files (x86)/Sysprogs/VisualGDB/ninja.exe "C:\PROGRA~2\Sysprogs\VISUAL~1/ninja.exe" |
You can run this batch file outside VisualGDB to reproduce the issue, and then try patching it (e.g. changing the PATH variable or other settings) to see what exactly is triggering the problem.
VisualGDB Diagnostics Console
You can get an extremely detailed log of what VisualGDB is doing behind the scenes by using the View->Other Windows->VisualGDB Diagnostics Console command and enabling the console before trying to troubleshoot an issue. The console will list all remote commands executed via SSH, as well as other diagnostic output that will explain what is going on: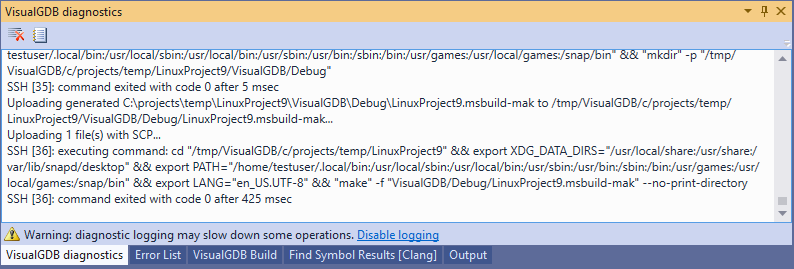
Clang IntelliSense Diagnostics Console
If you are diagnosing an IntelliSense issue, try using View-> Clang IntelliSense Status to get a detailed log: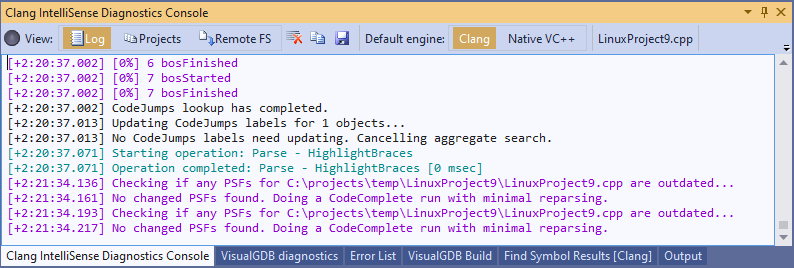 You can use the “Projects” view to see what files and compiler settings were gathered from your project and passed to the IntelliSense engine:
GDB Session Logs
You can troubleshoot many debugging issues by switching the GDB Session window (Debug->Windows->GDB Session) to the “All GDB Interaction” view and optionally enabling the timing view: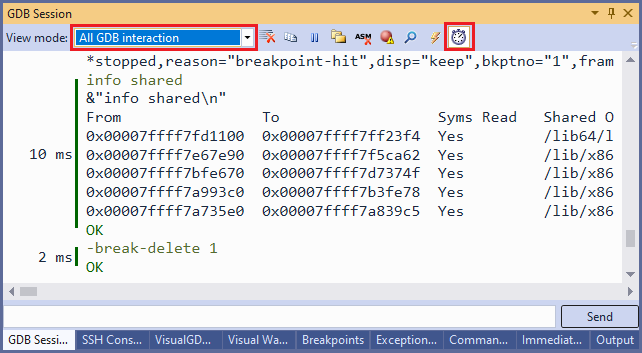 This will show what exactly is going on between VisualGDB and the gdb (or lldb) debugger, and will also simplify narrowing down timing problems.
Alternatively, you can configure VisualGDB to save all gdb interaction to a log file via the Advanced GDB Settings page of VisualGDB Project Properties: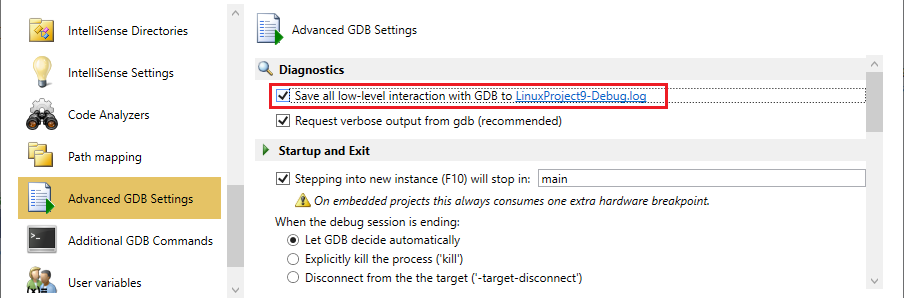
MSBuild Projects
The MSBuild projects are different from many other project types, as their build is managed directly by Visual Studio/MSBuild. You can get a detailed build log from MSBuild via Tools->Options->Projects and Solutions->Build and Run->MSBuild project build output verbosity: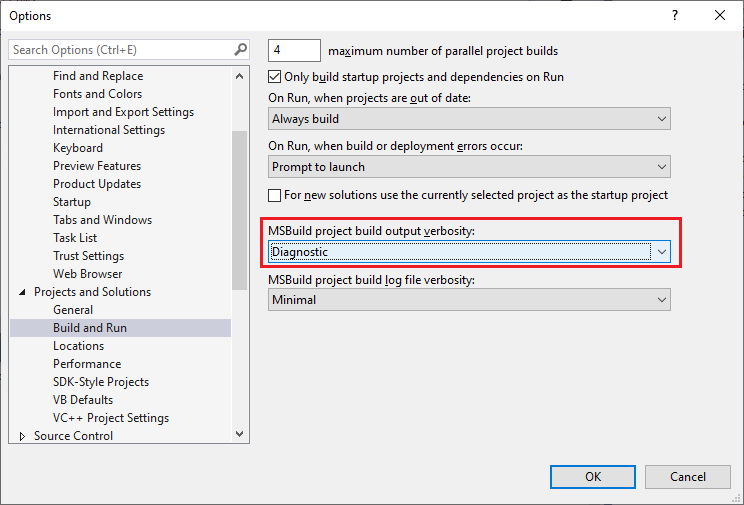 Note that the diagnostic output will appear in the regular Output window and not inside VisualGDB Build.
You can also find out the exact command lines passed to gcc and other tools by examining the .rsp files created by VisualGDB. See our MSBuild documentation for more details.
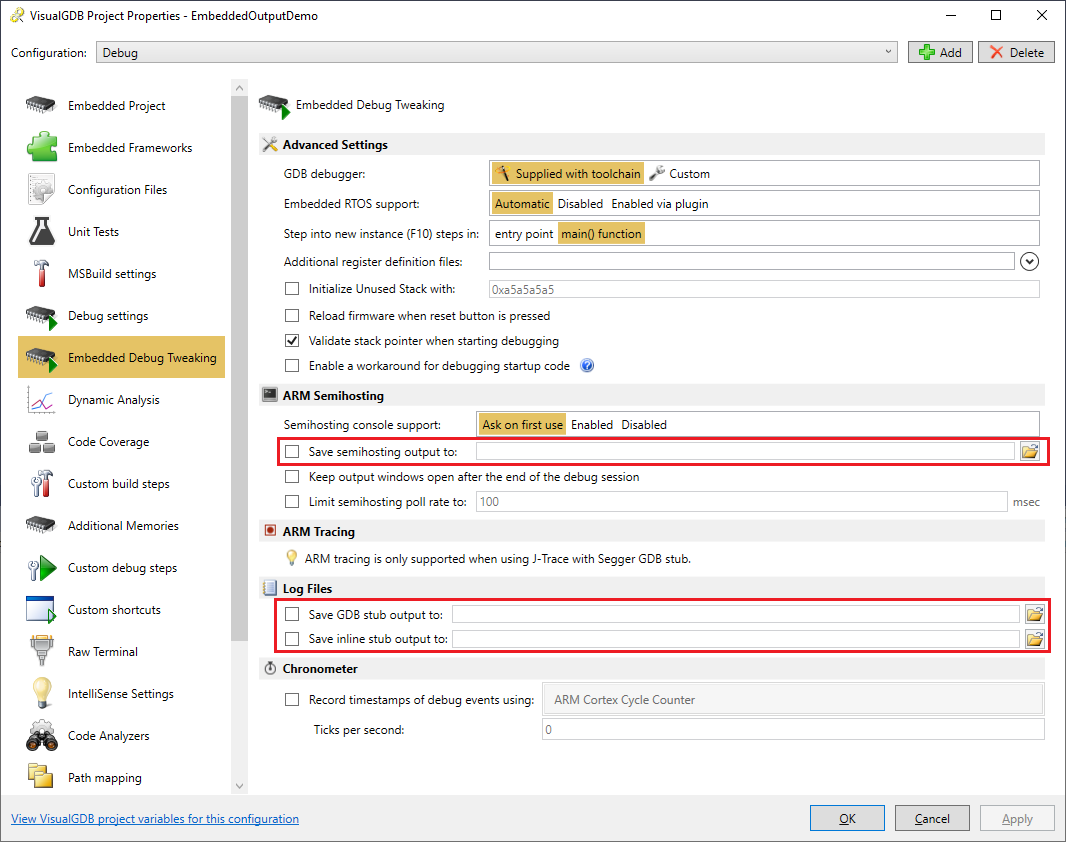
Embedded Debug Sessions
Embedded debug sessions typically utilize a GDB stub (e.g. OpenOCD) that interfaces the GDB debugger to the hardware. You can configure VisualGDB to save the output from the GDB stub (and also the semihosting output and the inline gdb output) via VisualGDB Project Properties -> Embedded Debug Tweaking: