Comparing Memory Footprints of Different Project Versions
This tutorial shows how to use Memory Explorer to do a detailed comparison of the memory footprint between several builds of your project. We will create a basic project for an STM32 microcontroller, will try different combinations of newlib and the advanced profiler/semihosting framework and will show how to quickly analyze the memory footprint differences between those combinations.
Before you begin, install VisualGDB 5.4 or later.
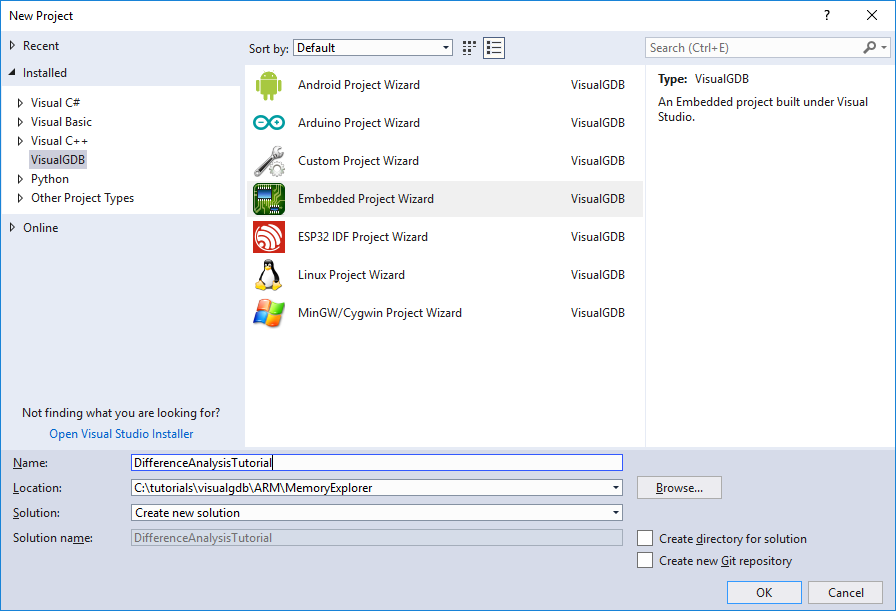
- Start Visual Studio and open the VisualGDB Embedded Project Wizard:
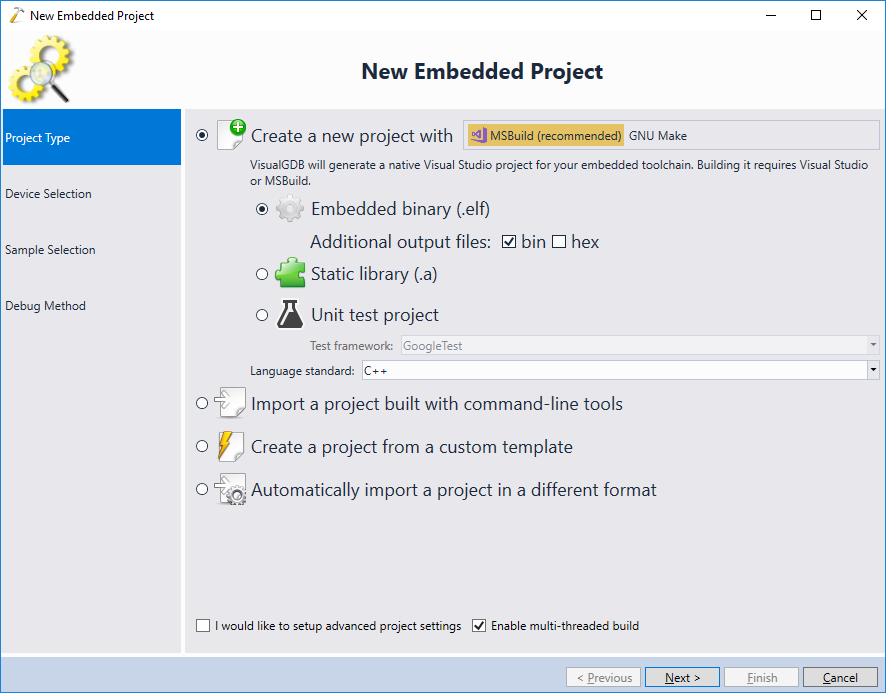
- Proceed with the default settings on the first page:
- On the second page of the wizard select the ARM toolchain and your device. Also switch the C library type to Default:

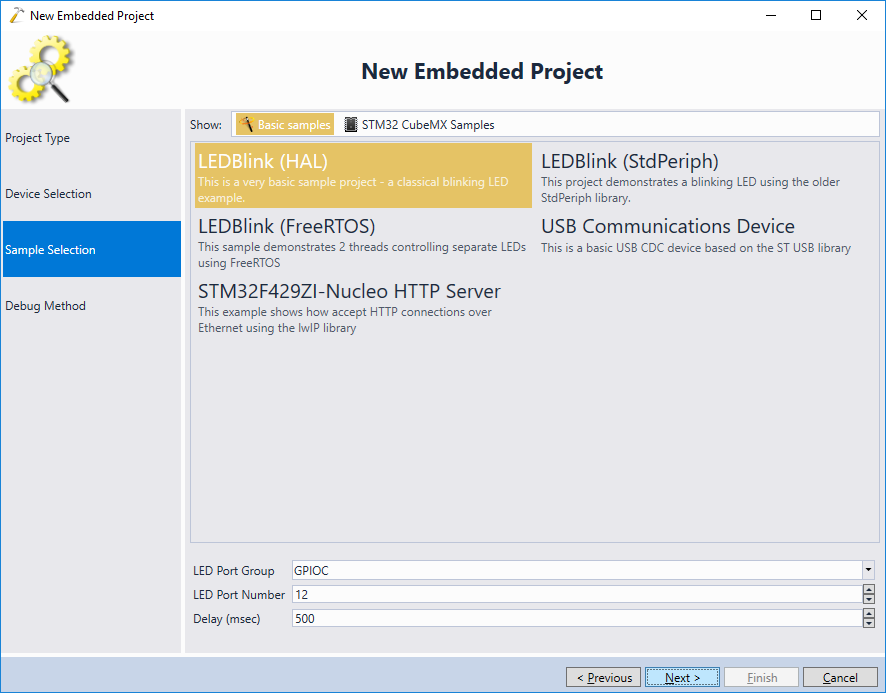
- Pick the “LEDBlink (HAL)” sample and click “Next”:
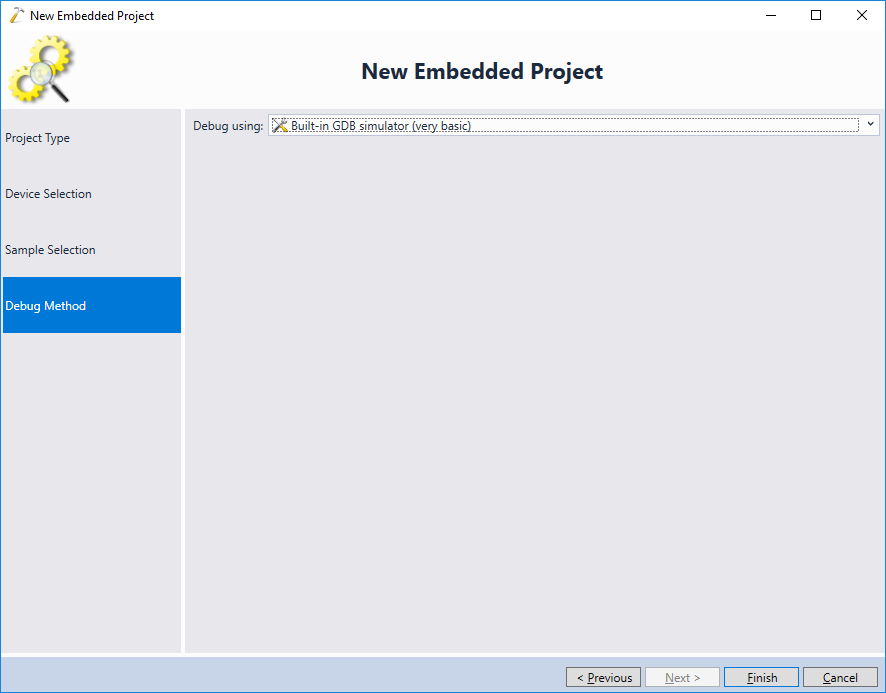
- In this tutorial we will not be debugging any code, so you can simply select “Built-in GDB Simulator” as the debug method and click “Finish” to create the project:
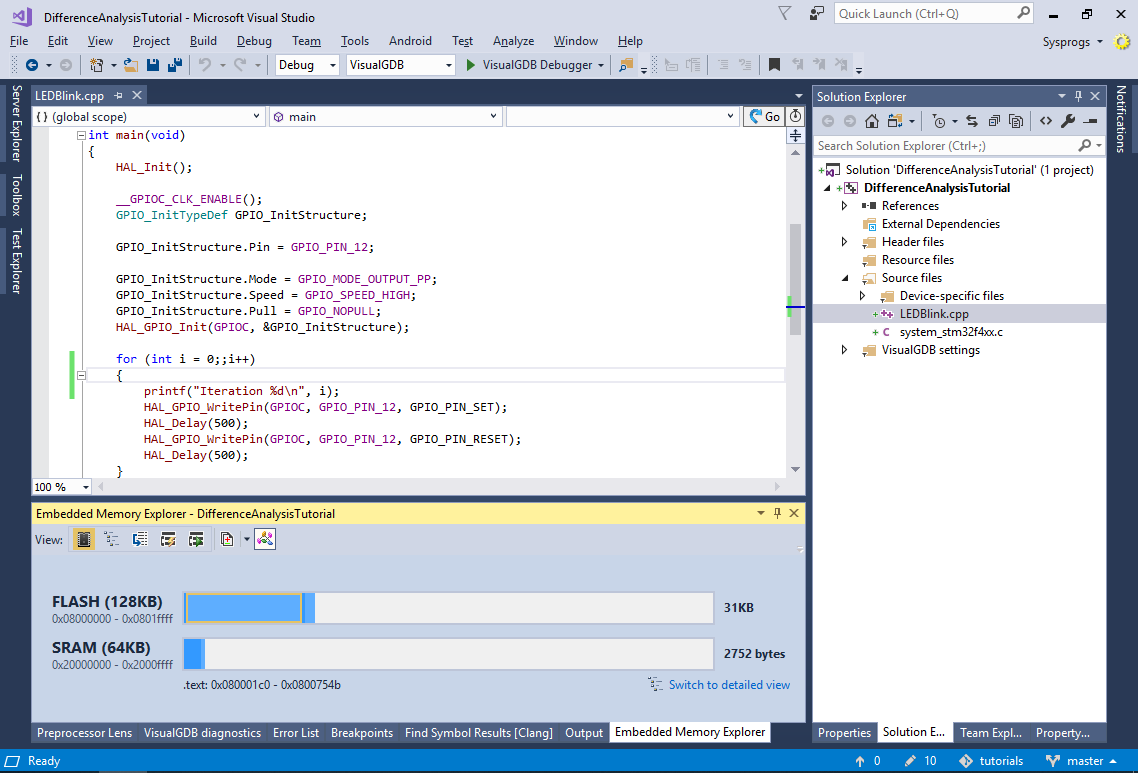
- Once the project is created, add a printf() call to main() as shown below and build the project:
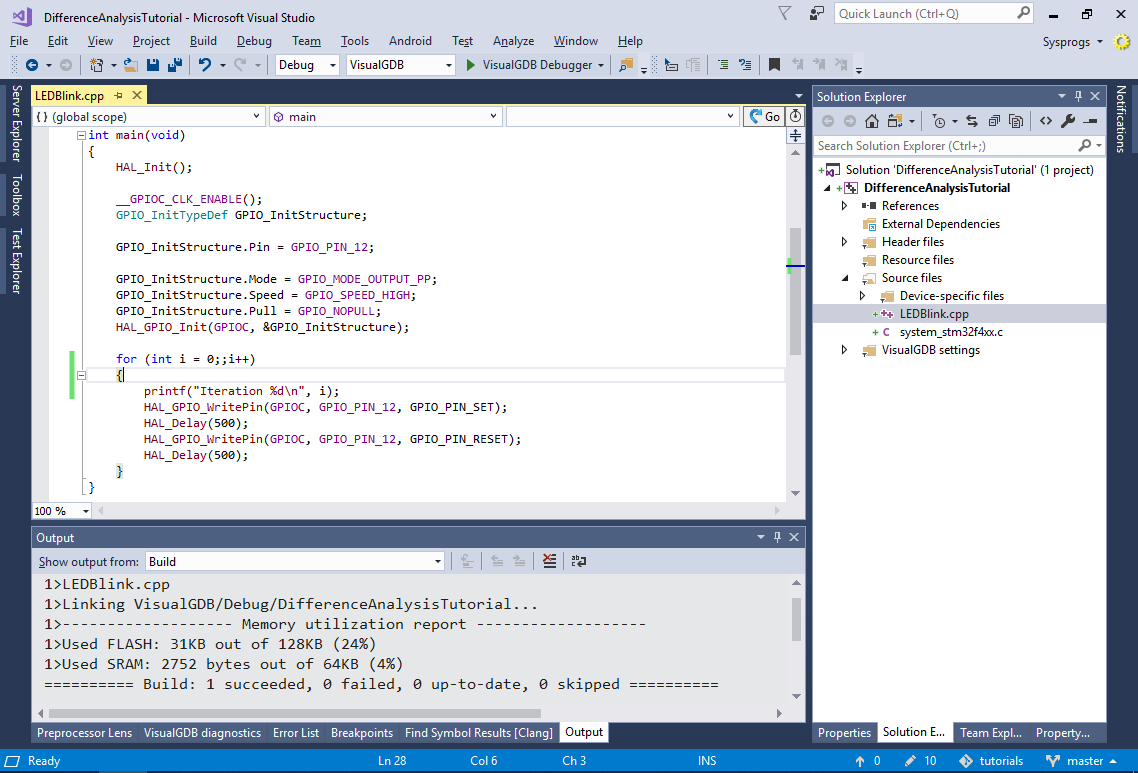
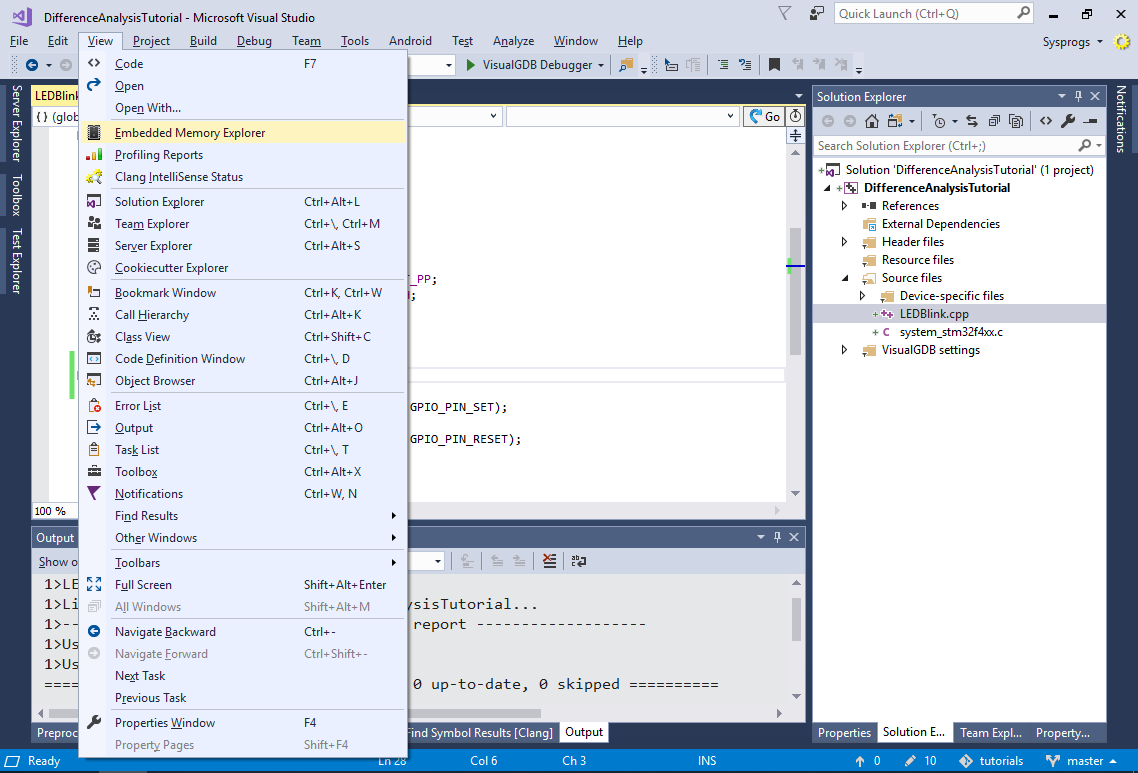
- The build output will display the overall memory utilization, but won’t provide any details about it. To begin looking into details, select View->Embedded Memory Explorer:
- VisualGDB will display an overview of various memories in your project:
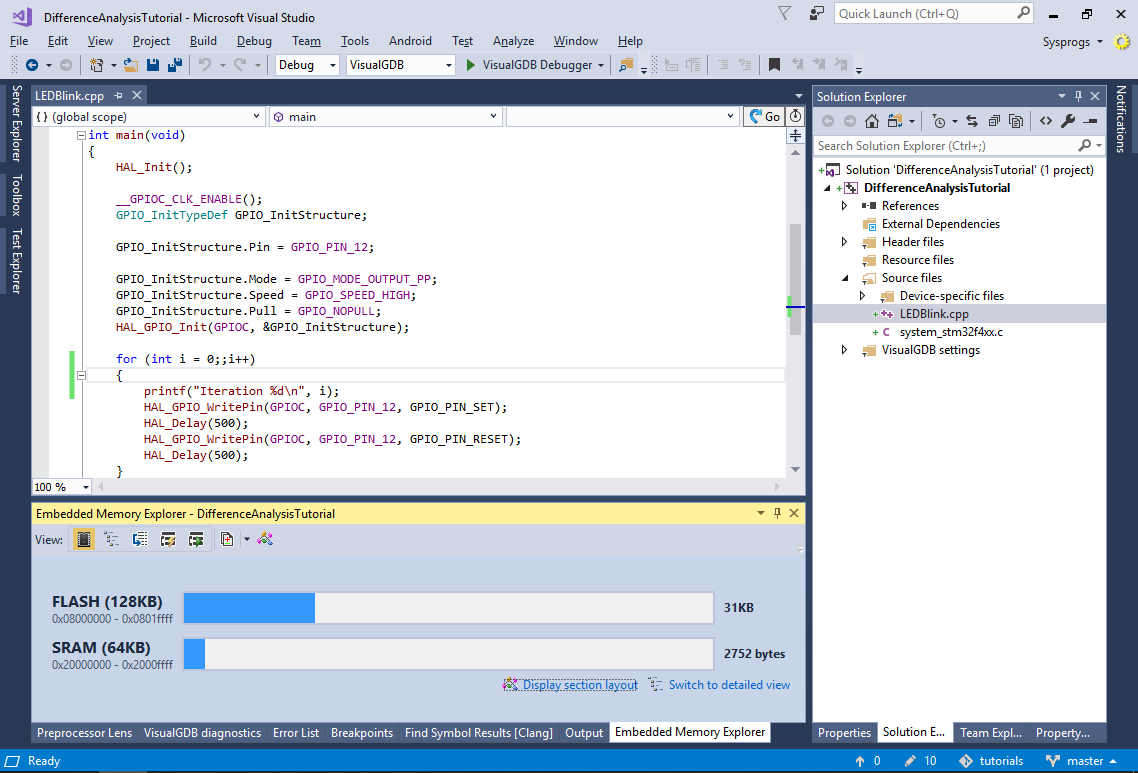
- Click “Display section layout” to view the physical placement of each section inside the corresponding memories:
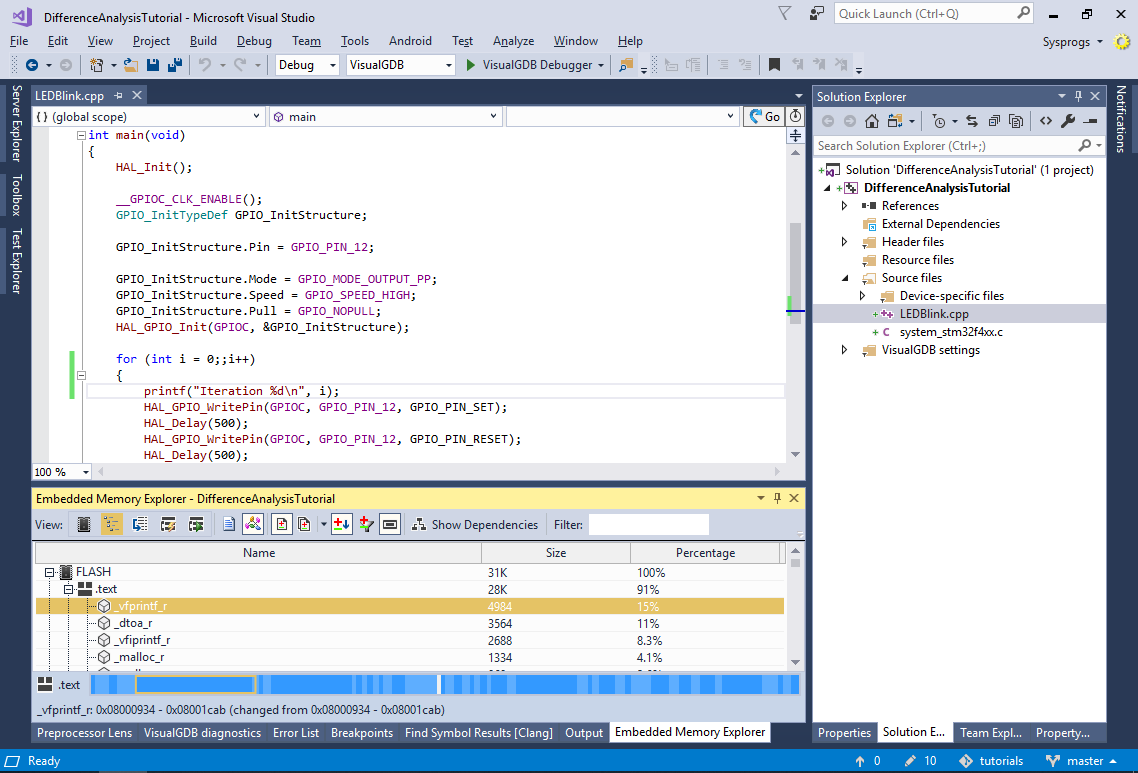
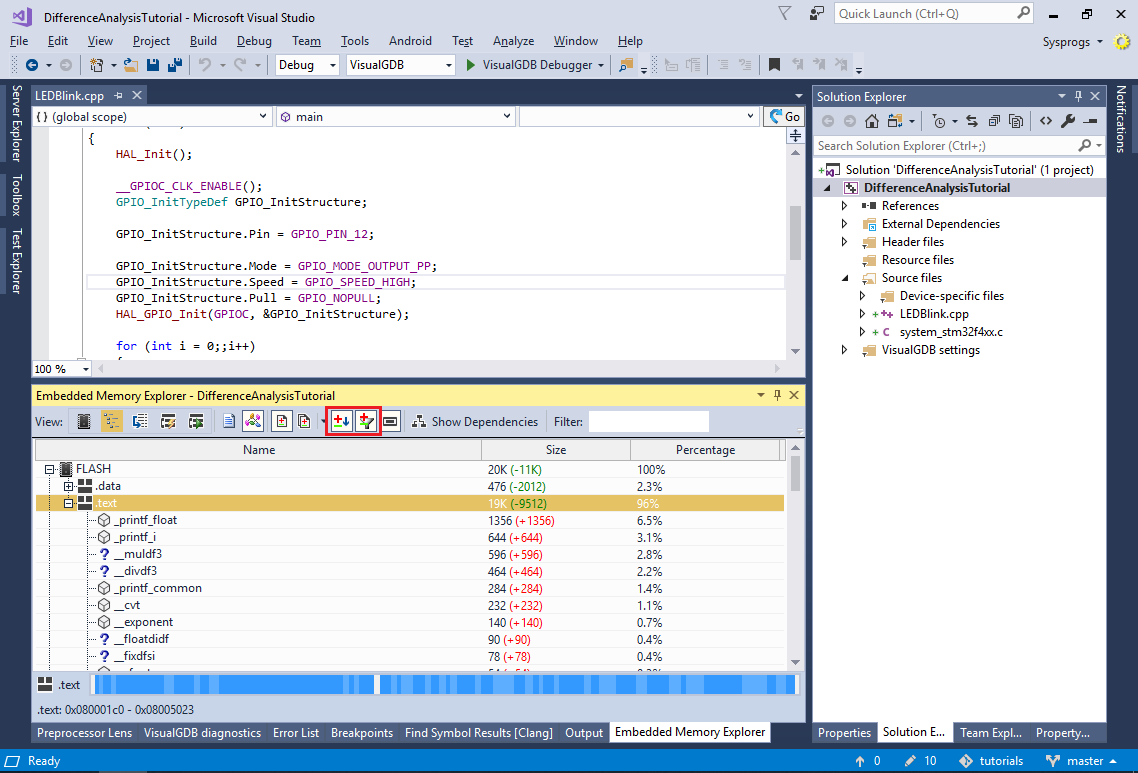
- Now switch to the detailed view and expand the .text section in the FLASH memory. You will see that one major contributor to the FLASH memory use is the _vfprintf_r() function:
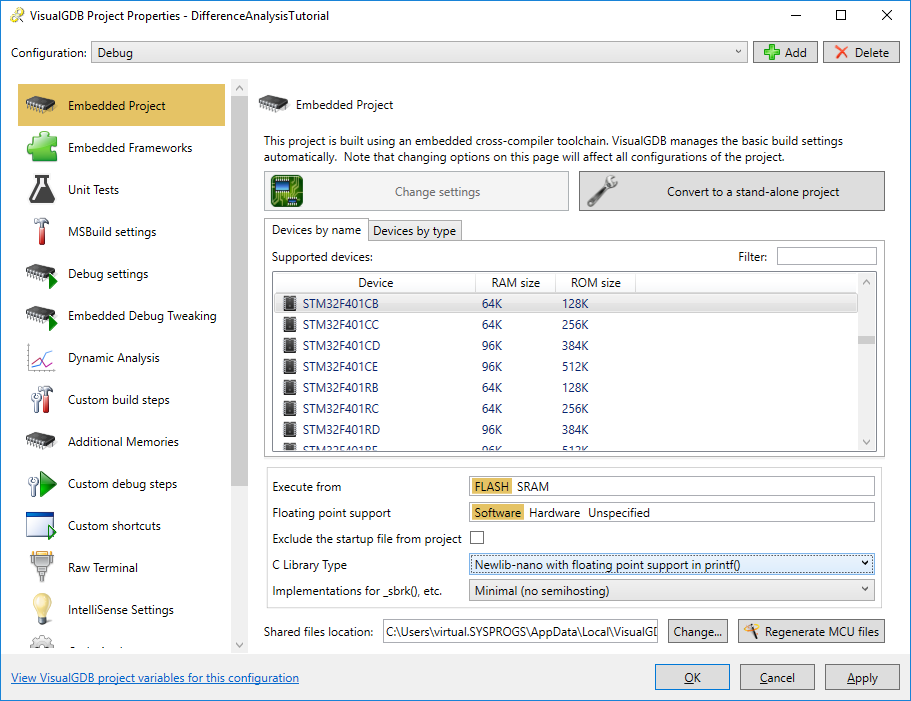
- Open VisualGDB Project Properties and switch the C Library Type to Newlib-nano with FP support:
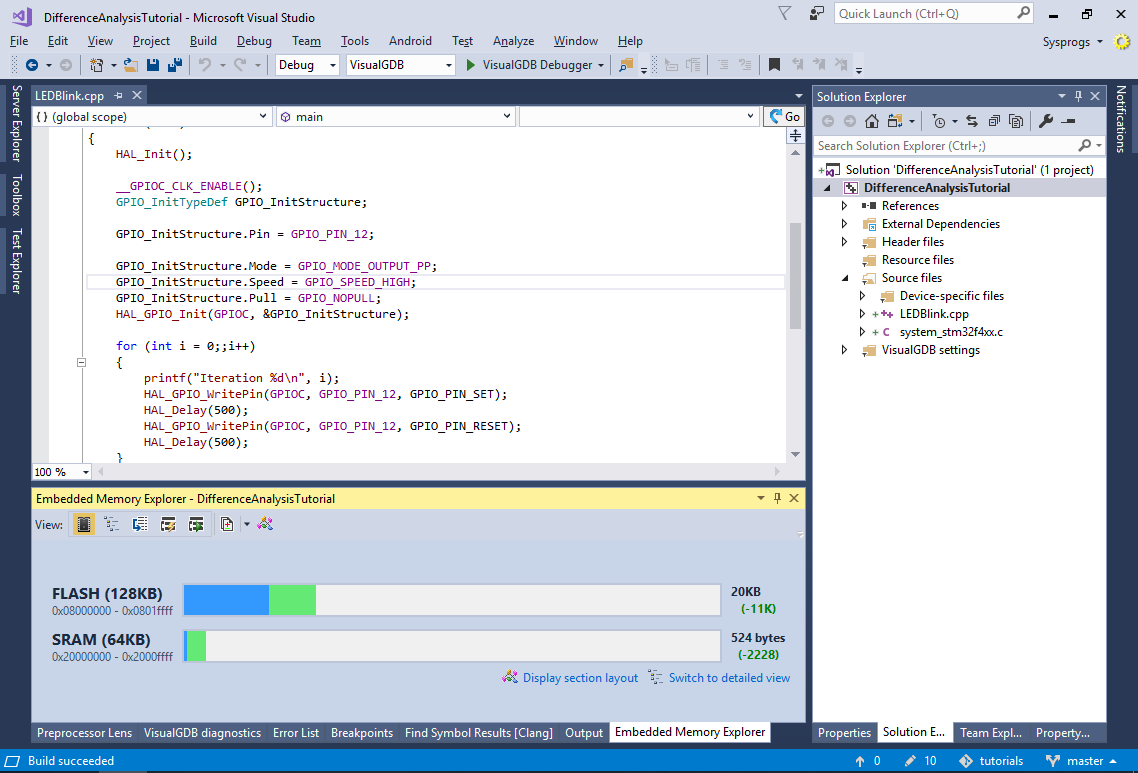
- Build the project. The Memory Explorer will show the amount of memory that was freed up after switching to the lightweight newlib-nano library:
- Switch back to the detailed view. The memory explorer will show the size difference for each symbol in the ELF file (including the new and removed symbols):

- You can use the sorting and filtering buttons to sort the symbols by either the absolute size, or the size difference, or to hide the symbols that were not changed compared to the previous build of your project:
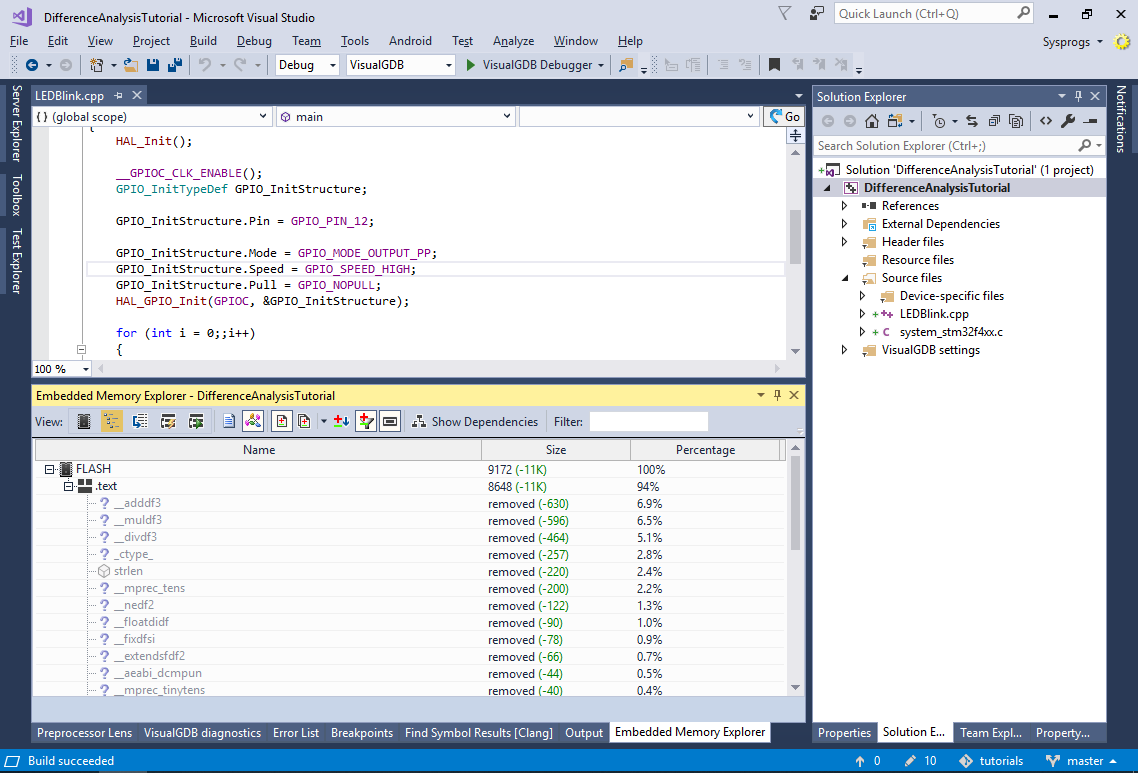
- Change the library type to just newlib-nano (without FP support) and build the project again. The Memory Explorer will show how several FP-related symbols were removed from the project, while most of the other symbols remained unchanged:
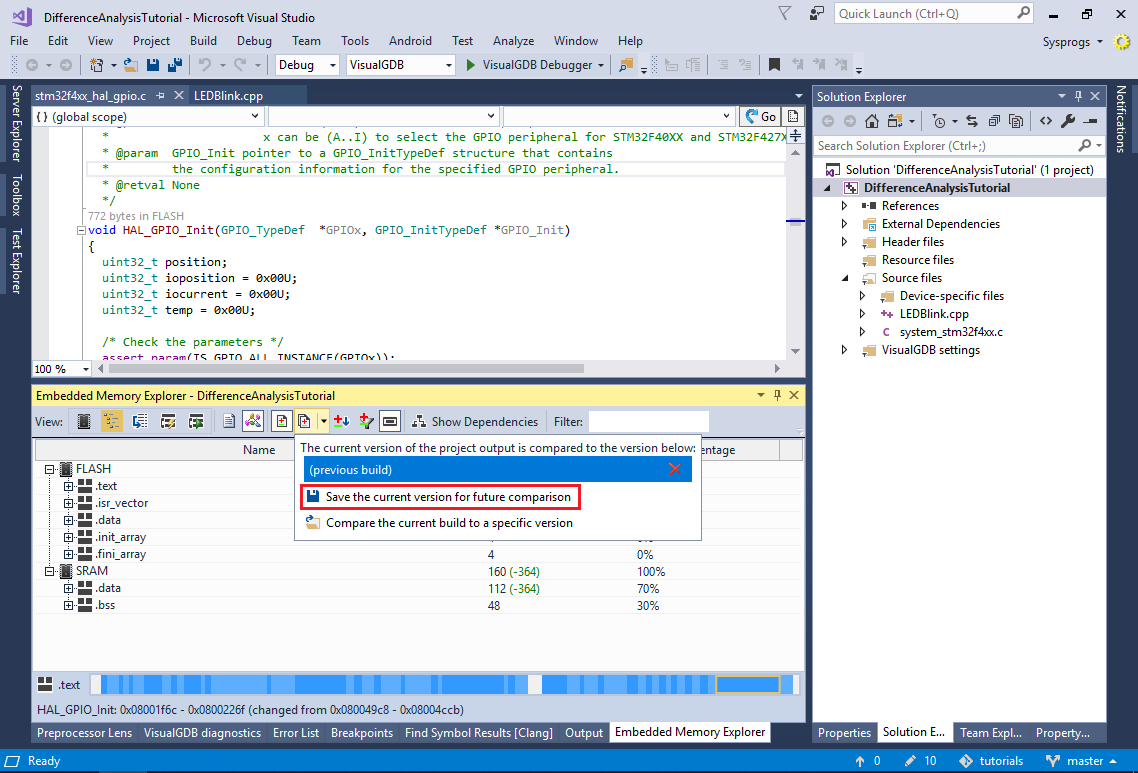
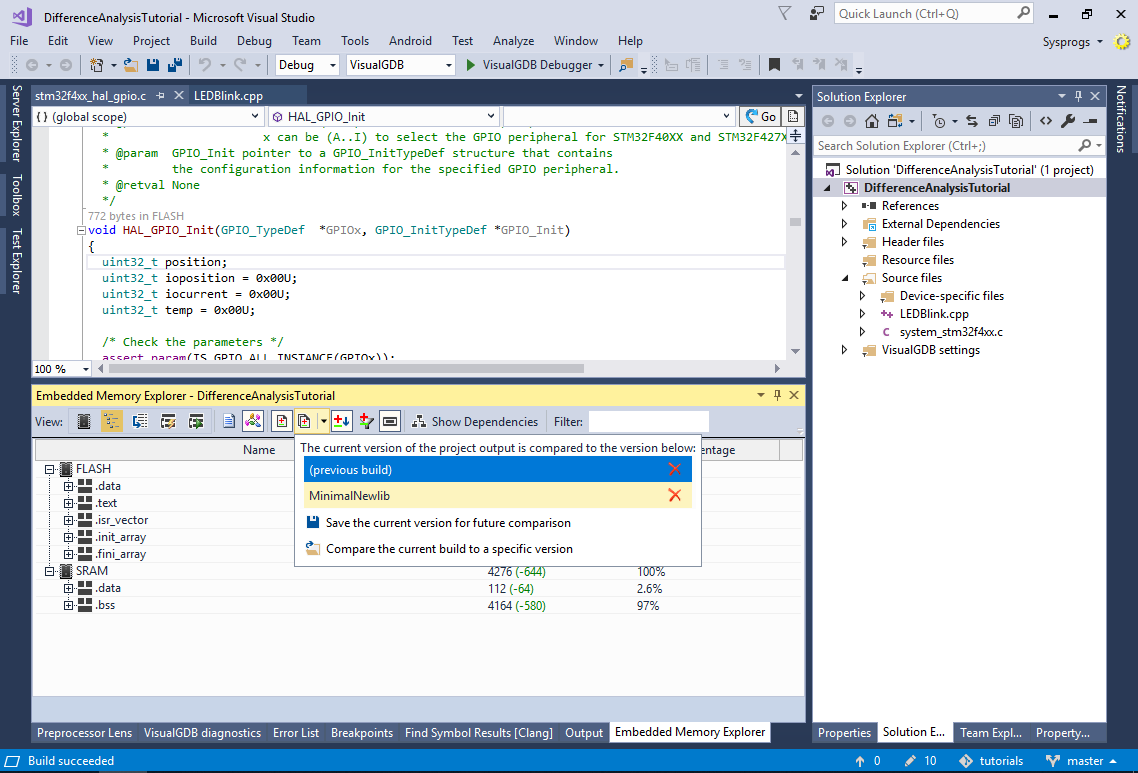
- Normally, the Embedded Memory Explorer will compare the current build of your program to the previous one. Alternatively, you can create checkpoints by saving any build of your choice under a different name and using it as a reference point later. Click “Save the current version for future comparison” and save it under the “MinimalNewlib” name:
- Reference the Fast Semihosting and Profiler framework and build the project. Then set the “Exclude Sampling Profiler Code” checkbox and build it again. The Embedded Memory Explorer will show the effects of removing the sampling profiler from the project:
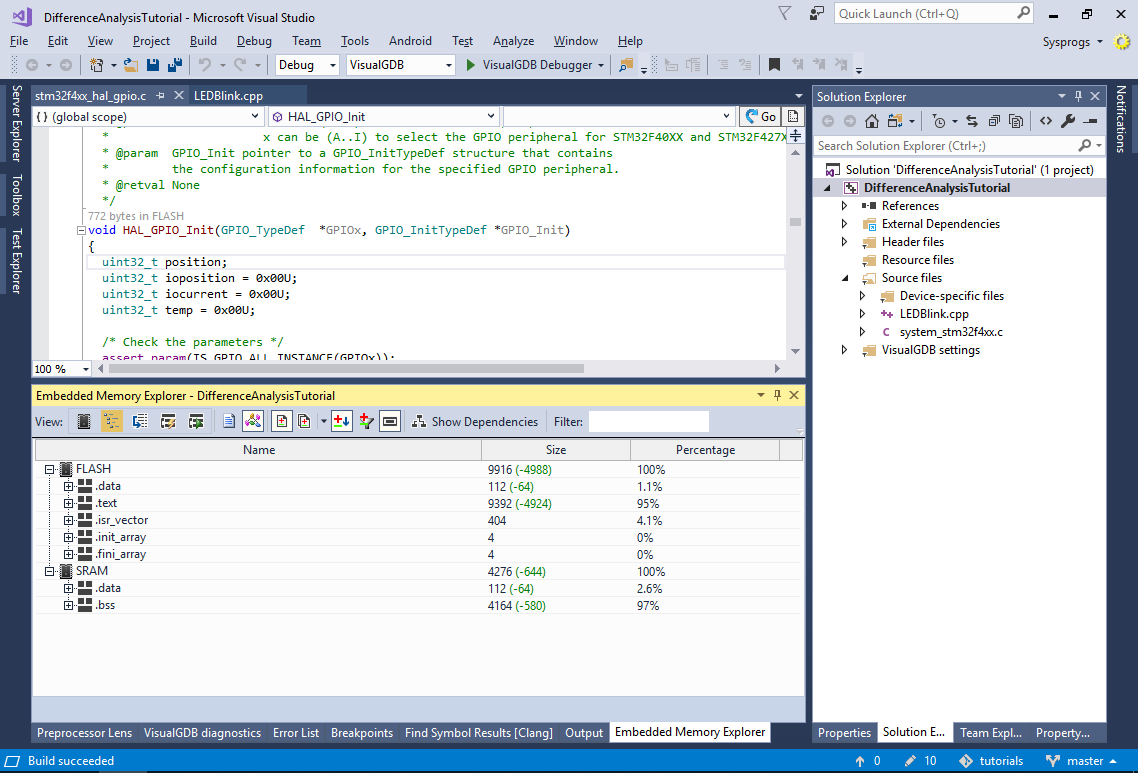
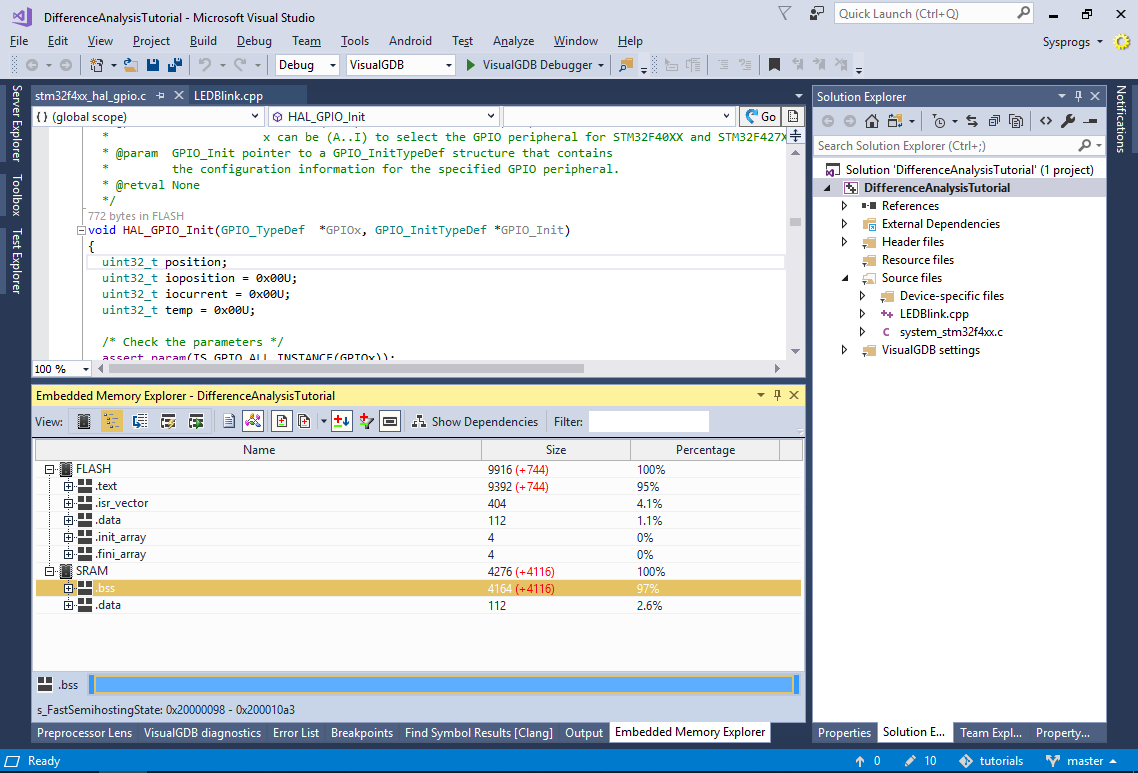
- In order to see the effects of adding the framework without the sampling profiler (i.e. compare the current build to the one with no profiler framework at all), switch the reference build from the previous build to MinimalNewlib:
- The Memory Explorer will now show how much FLASH and RAM is used by the current configuration of the semihosting/profiler framework:
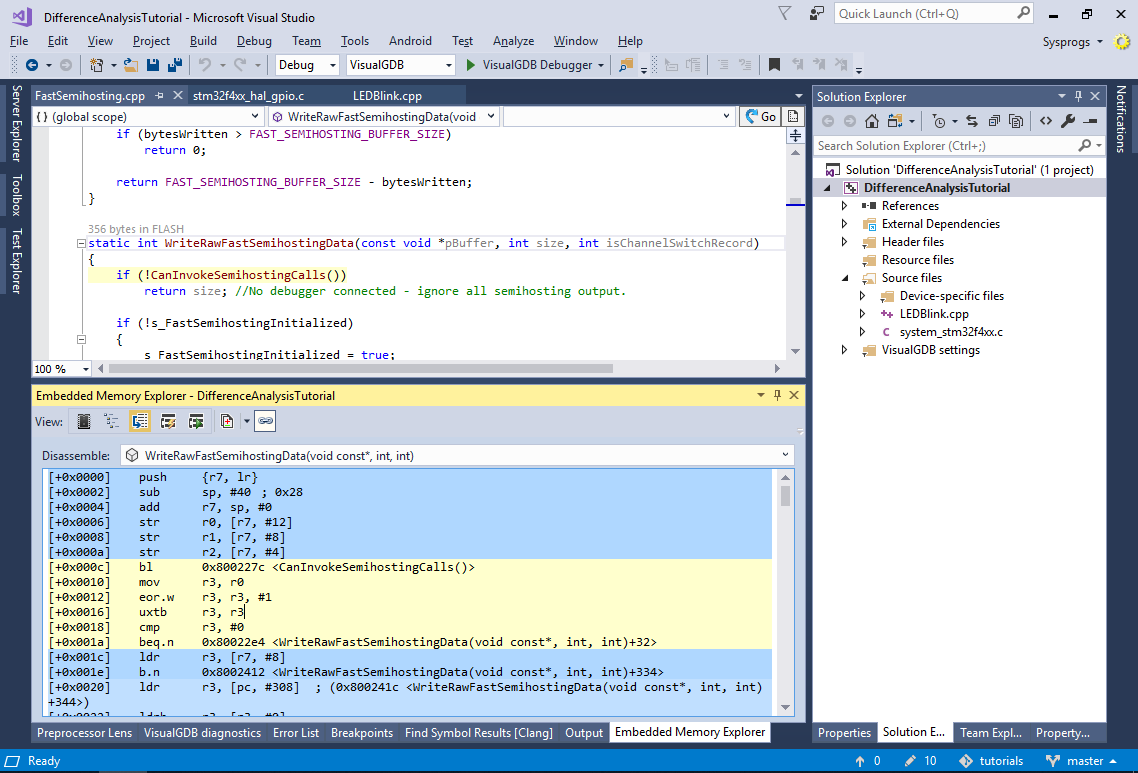
- You can also explore the disassembly of specific functions without starting a debug session. Simply right-click on any function in Memory Explorer and select “Disassemble selected function”:
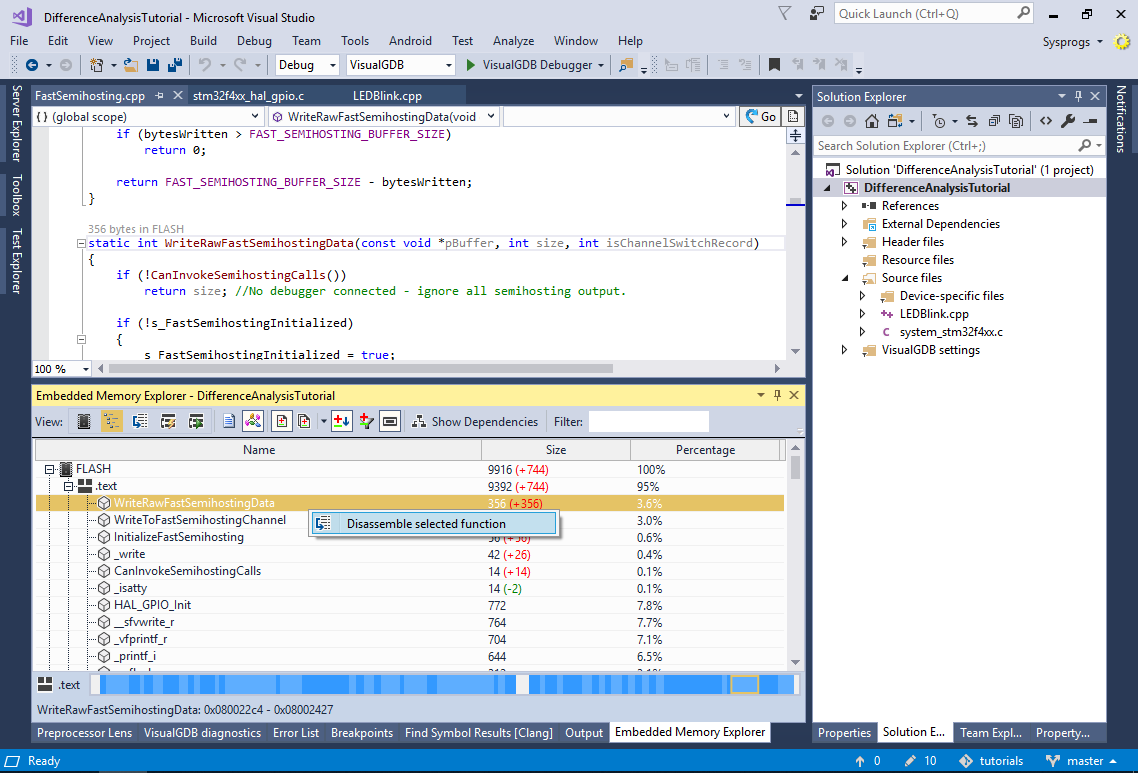
- This will switch the Memory Explorer into the Disassembly view, showing the exact contents of the selected symbol. For your convenience, the instructions are grouped according to the corresponding source lines and selecting a group in the disassembly view will highlight that line in the source view, as long as you are using Clang IntelliSense: