Monitoring Live FreeRTOS State with Live Watch
This tutorial shows how to monitor the live state of the FreeRTOS kernel using the Live Watch feature of VisualGDB. Live Watch works non-intrusively by scanning the target memory as it is running, and reconstructing various information about FreeRTOS. As of VisualGDB 5.5, Live Watch can show the following FreeRTOS parameters:
- Active threads and their state
- Current/maximum stack usage by each thread
- Internal state of queues, mutexes and semaphores
- Mutexes owned by each thread
- Heap statistics and the list of allocated blocks
In this tutorial we will create a basic FreeRTOS project for the STM32F4-Discovery board and will demonstrate various Live Watch views.
Before you begin, install VisualGDB 5.5 and make sure you are using the Custom edition or higher.
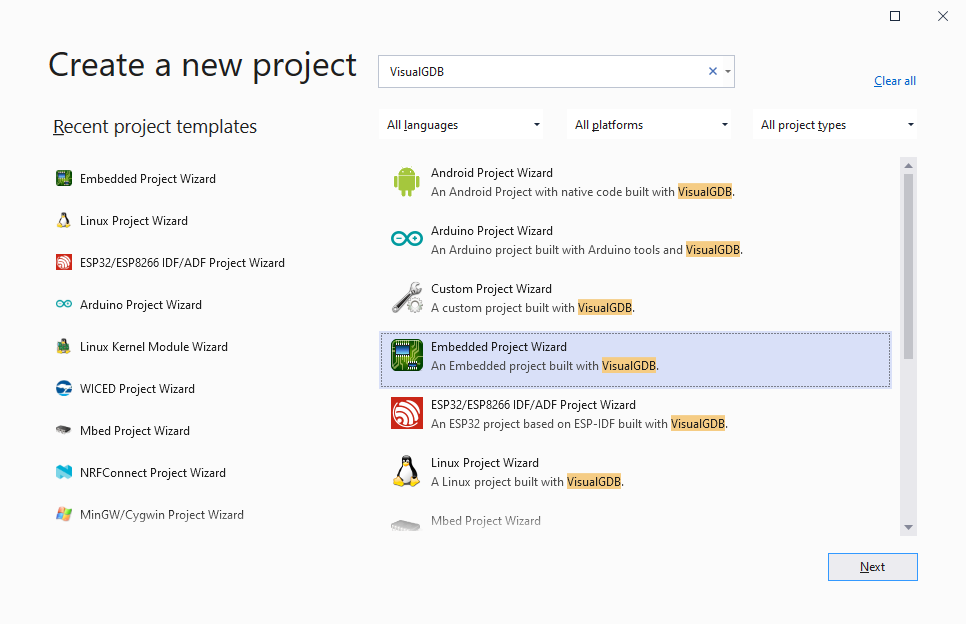
- Start Visual Studio and open the VisualGDB Embedded Project Wizard:
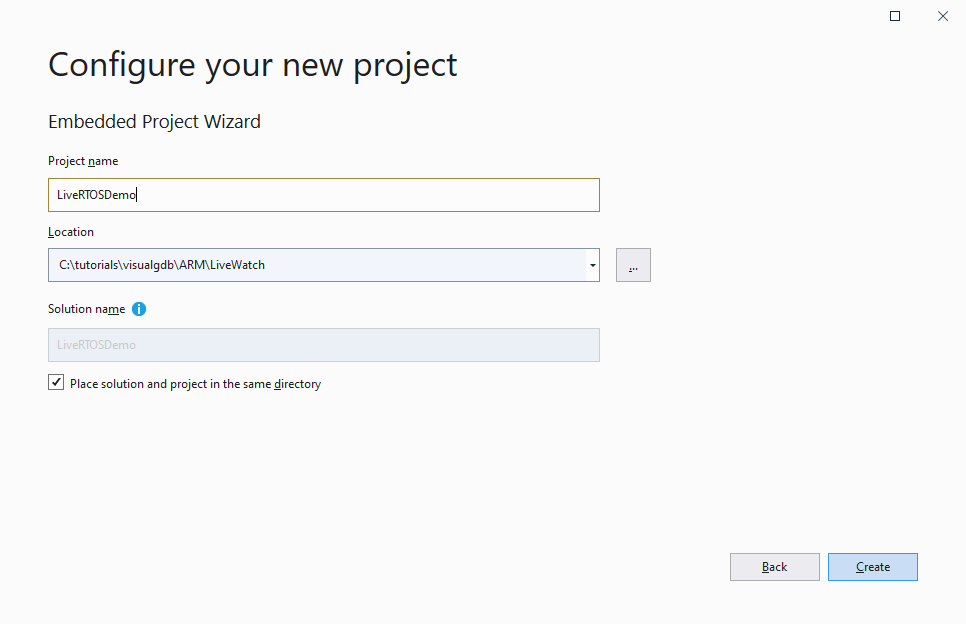
- Enter the name and location of the project you are going to create:
- Proceed with the default settings on the first page of the VisualGDB-specific part of the wizard:

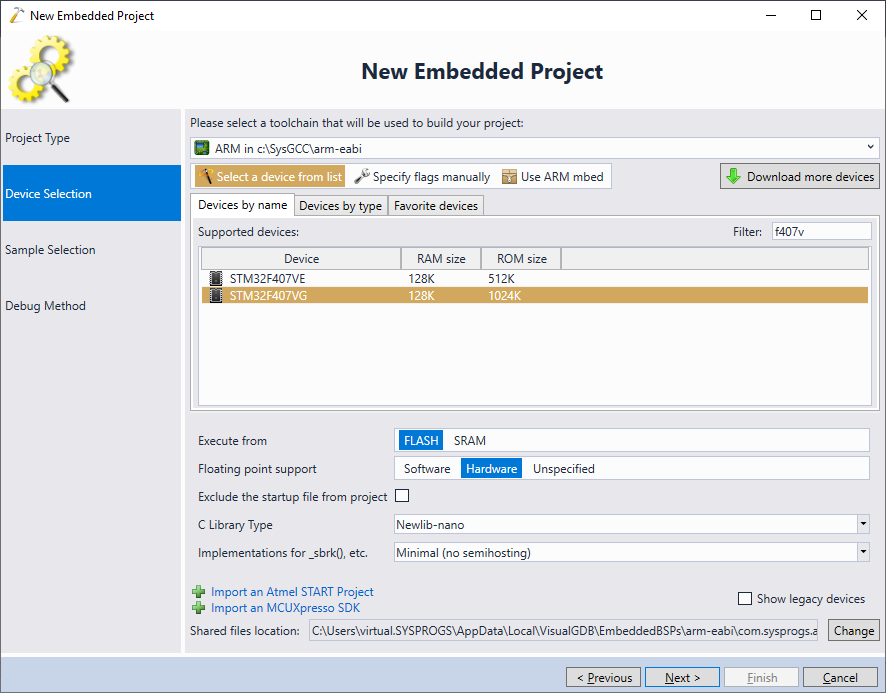
- On the next page, select the ARM toolchain and your target device. In this tutorial we will target the STM32F4-Discovery board, so we select the STM32F407VG device:
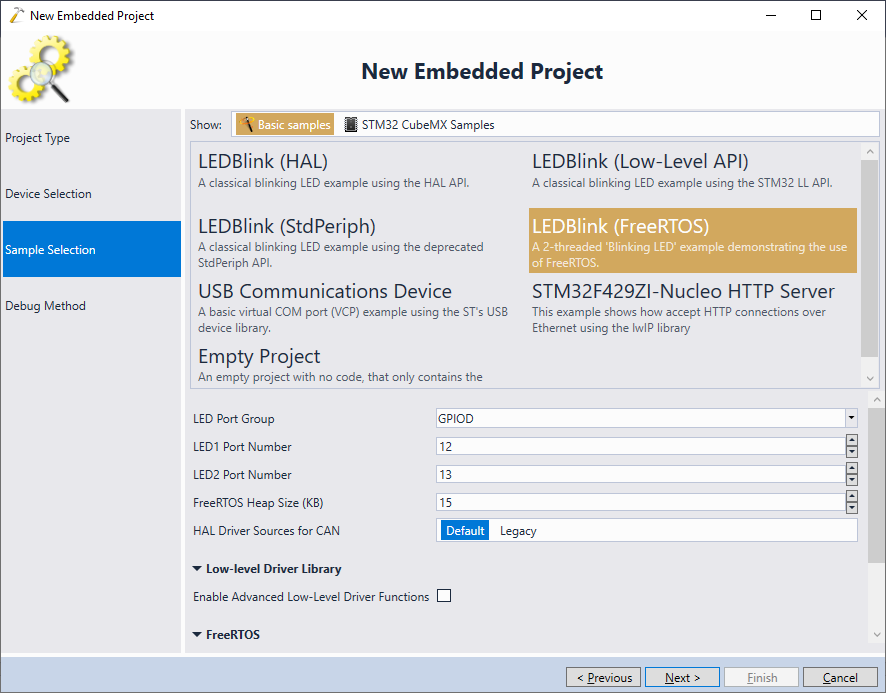
- On the next page, select the LEDBlink (FreeRTOS) sample. You can adjust the LED pins to match your board schematics, or simply proceed with the default settings, as the functionality shown in this tutorial will work without LEDs as well:
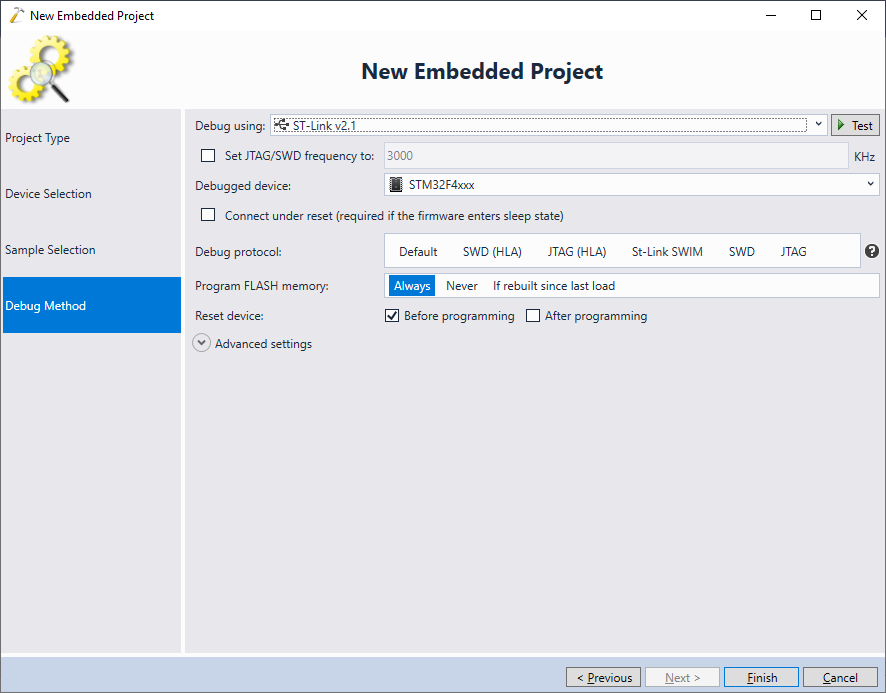
- Finally choose the debugging settings that work with your board and click Finish to create the project:
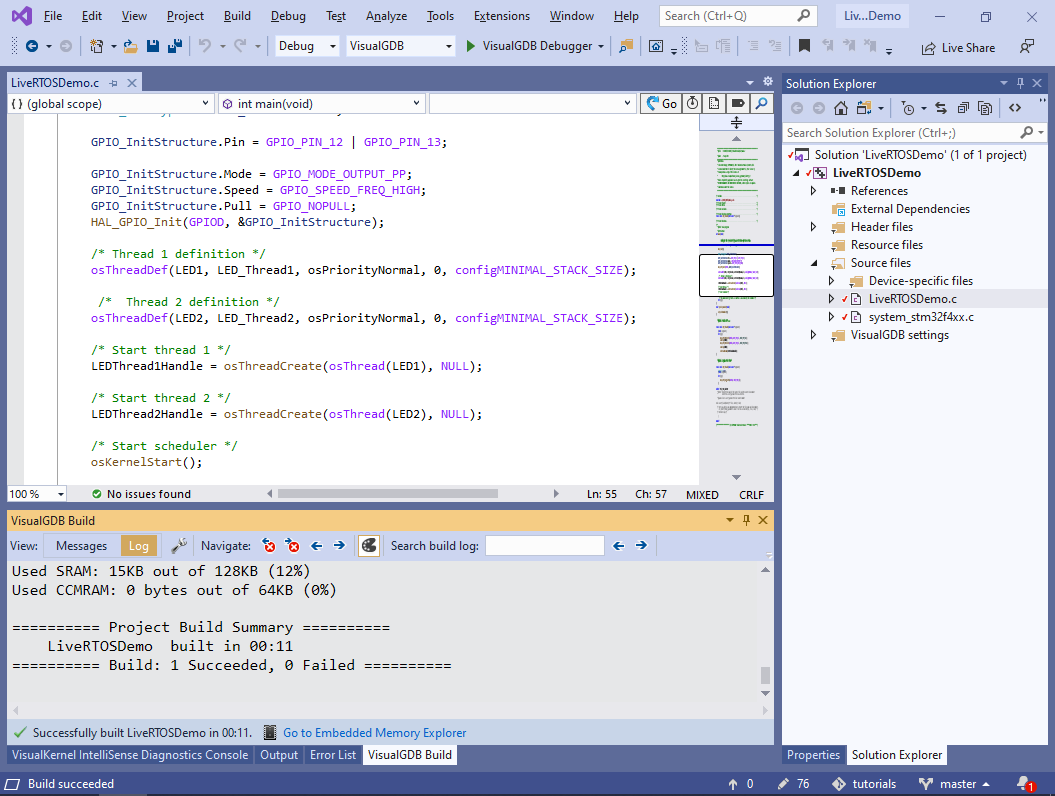
- Once the project is created, press Ctrl-Shift-B to build it:
- Start debugging by pressing F5. Without stopping the project, select Debug->Windows->Live Watch and then switch it to the FreeRTOS mode (requires Custom edition):
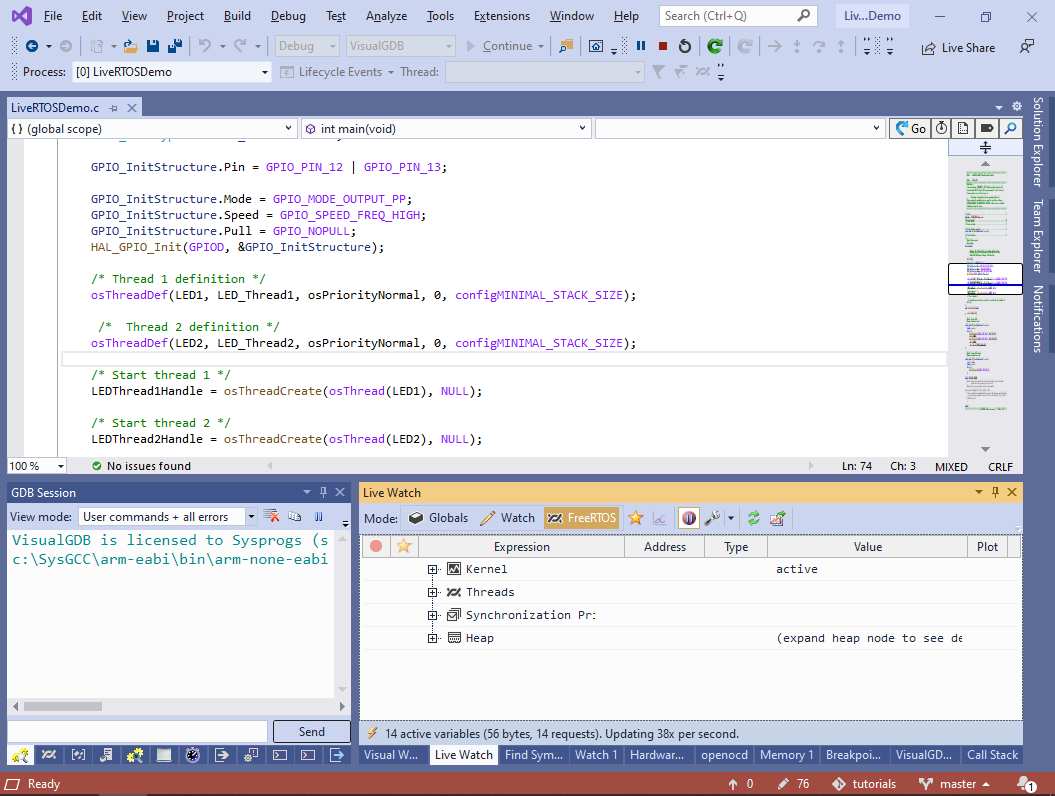
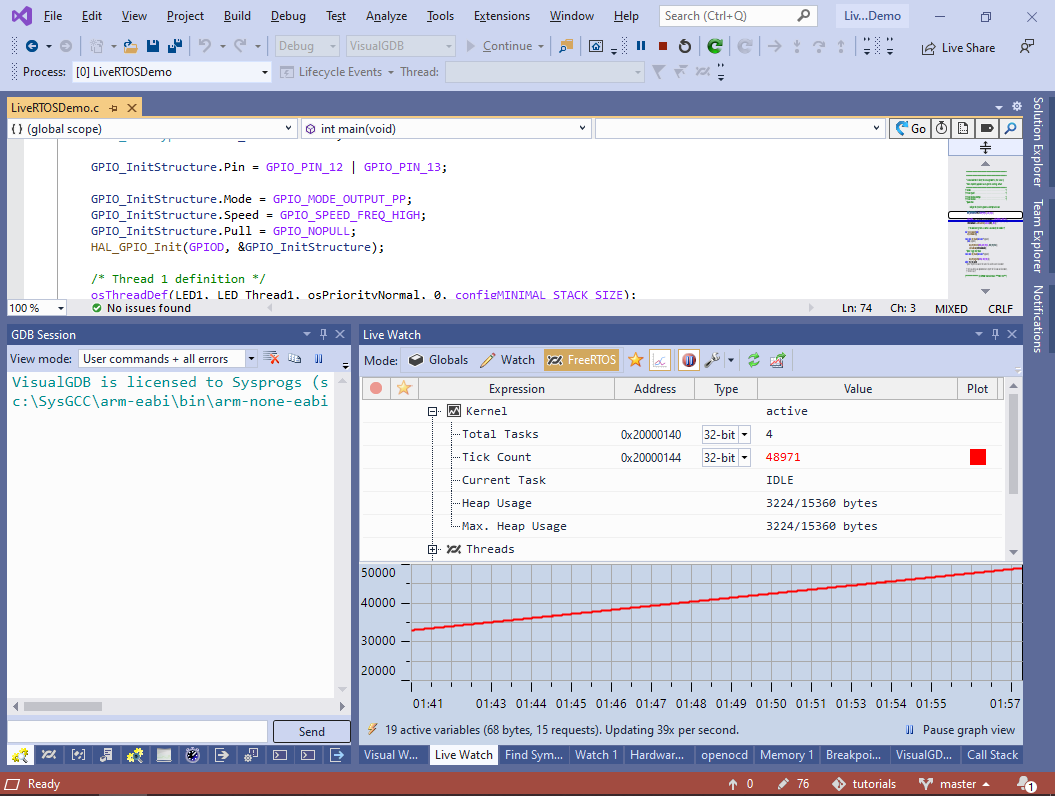
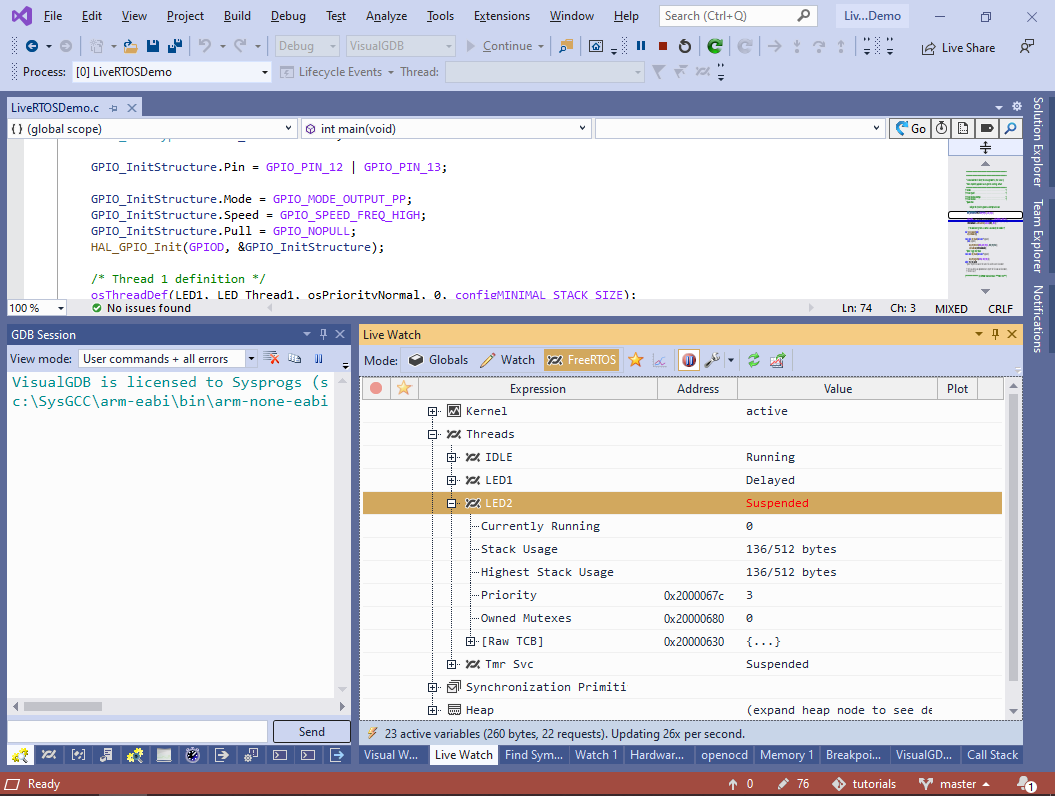
- The FreeRTOS view contains 4 main groups of nodes: Kernel statistics, Threads, Synchronization Primitives and Heap. We will demonstrate each of these items below. Expand the Kernel node and start plotting the Tick Count variable. VisualGDB will show how the tick count is increasing over time:
- Now expand the Threads node and locate LED2 in the list. See how its state changes between Delayed and Suspended as the LED1 thread keeps suspending and resuming it. Note that as none of the threads is doing any heavy computation, the IDLE thread remains active each time VisualGDB samples the thread state:
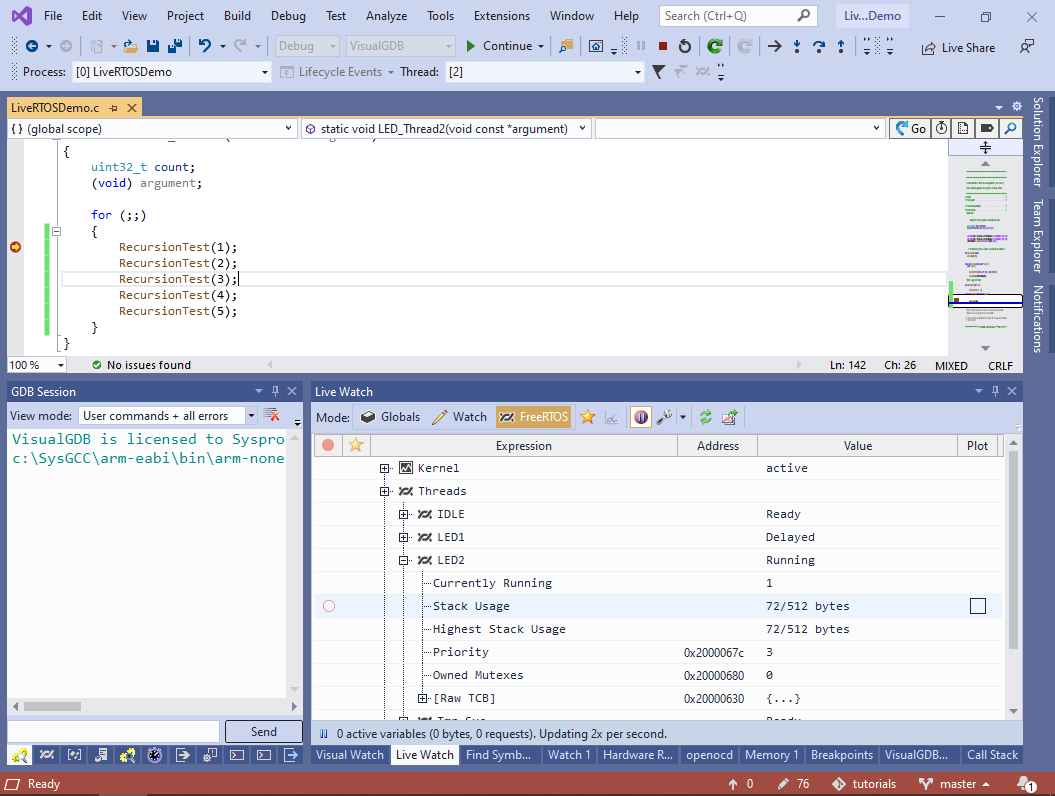
- Now we will show how to monitor the stack usage by FreeRTOS threads. Add a RecursionTest() function and modify LED_Thread2() to call it:
void RecursionTest(int level)
{
    volatile int x[5];
    x[0]++;
    if (level > 0)
        RecursionTest(level - 1);
    else
	osDelay(200);
}

static void LED_Thread2(void const *argument)
{
    uint32_t count;
    (void) argument;

    for (;;)
    {
        RecursionTest(1);
        RecursionTest(2);
        RecursionTest(3);
        RecursionTest(4);
        RecursionTest(5);
    }
}
Then set a breakpoint at the first call to RecursionTest(), start debugging and let the breakpoint trigger:
- Locate the LED2 thread in the Live Watch view and start plotting its stack usage and highest stack usage. See how the stack usage keeps increasing together with the recursion level, and the highest stack usage reaches the maximum and remains the same:
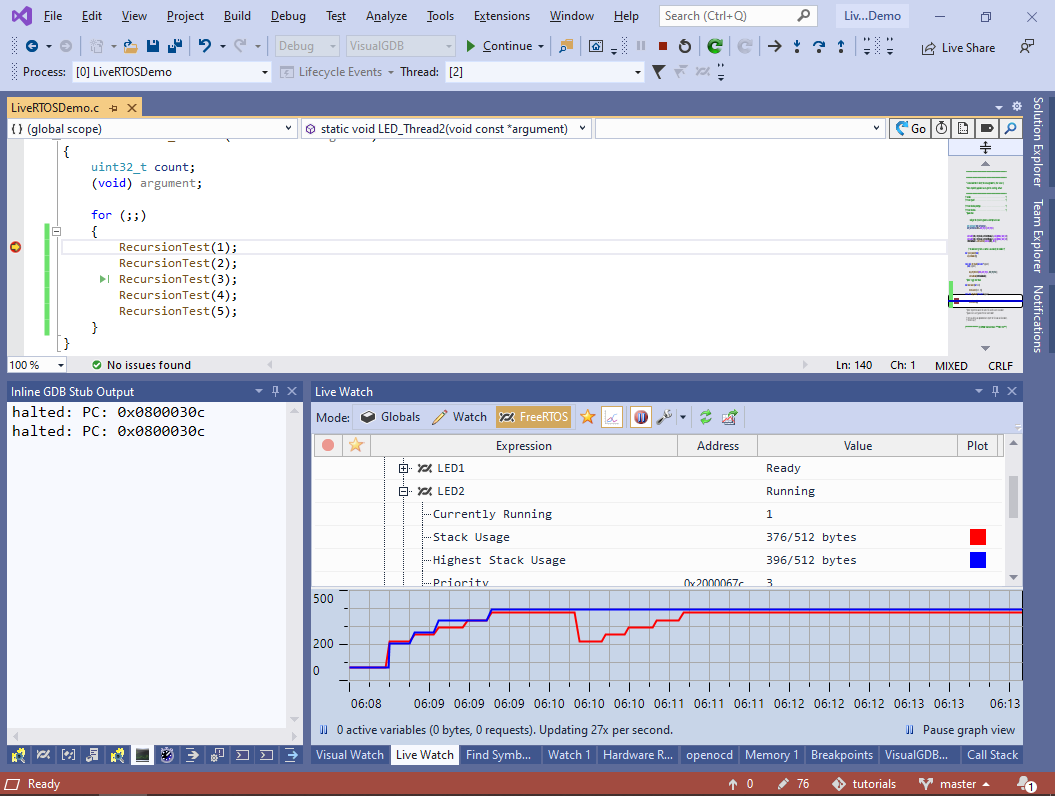 The current stack usage is sampled based from the saved stack pointer in the thread control block, so it will not be accurate while the thread is currently running. The highest stack usage is computed by scanning the memory region allocated for the stack and checking which parts of it have overwritten the initial padding value.
 - Now we will show how to view the state of various synchronization primitives. Add a new Plain C file to the project (e.g. SemaphoreTests.c) and add the following code to it:
#include <cmsis_os.h>
#include <stm32f4xx_hal.h>
static xSemaphoreHandle s_DemoSemaphore;

static void SenderThreadBody()
{
    for (;;)
    {
        for (int i = 0; i < 5; i++)
            xSemaphoreGive(s_DemoSemaphore);
        osDelay(10000);
    }
}

static void ReceiverThreadBody()
{
    for (;;)
    {
        xSemaphoreTake(s_DemoSemaphore, portMAX_DELAY);
        osDelay(1000);
    }
}

void StartSemaphoreTestThreads()
{
    TaskHandle_t task;

    s_DemoSemaphore = xSemaphoreCreateCounting(100, 0);
    xTaskCreate(SenderThreadBody, "Sender", 128, 0, 1, &task);
    xTaskCreate(ReceiverThreadBody, "Receiver", 128, 0, 1, &task);
}
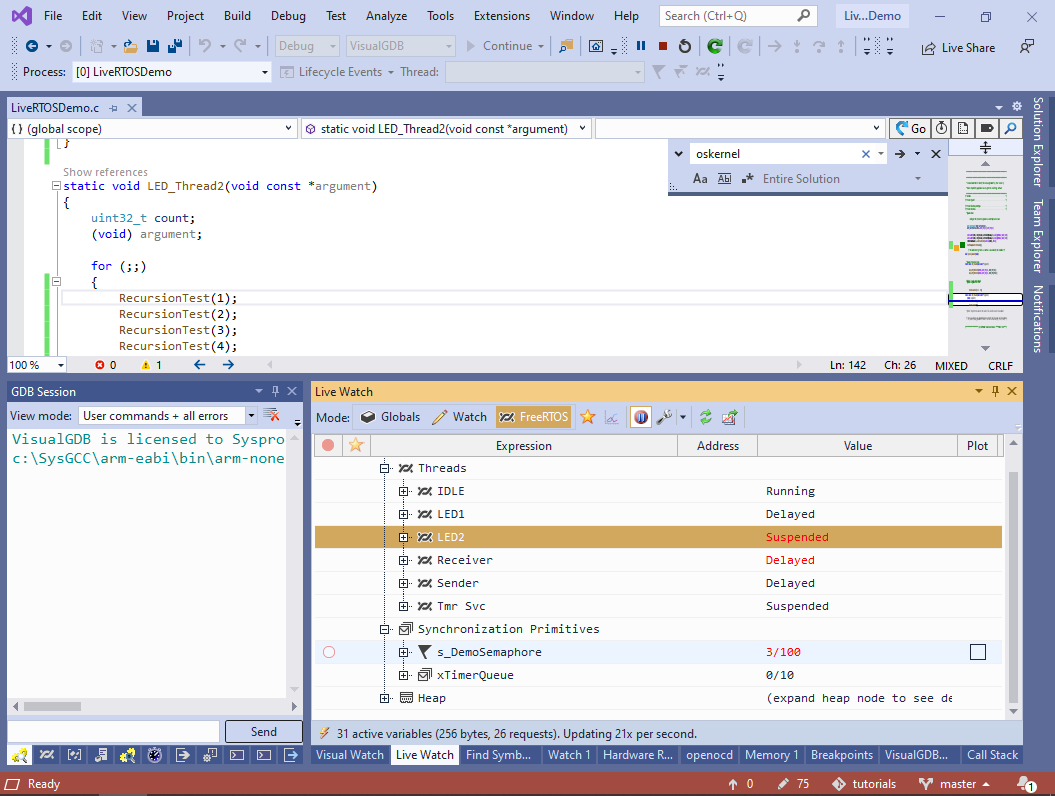
Then call StartSemaphoreTestThreads() from the main source file just before the call to osKernelStart(). If you start debugging now, VisualGDB will show s_DemoSemaphore in the Synchronization Primitives view:
- You can plot the current value of the semaphore. VisualGDB will show how it increases to 4 as the sender thread releases it 5 times (it’s immediately taken by the receiver, so the value of 5 never stays long enough to be sampled) and then slowly drops to 0:
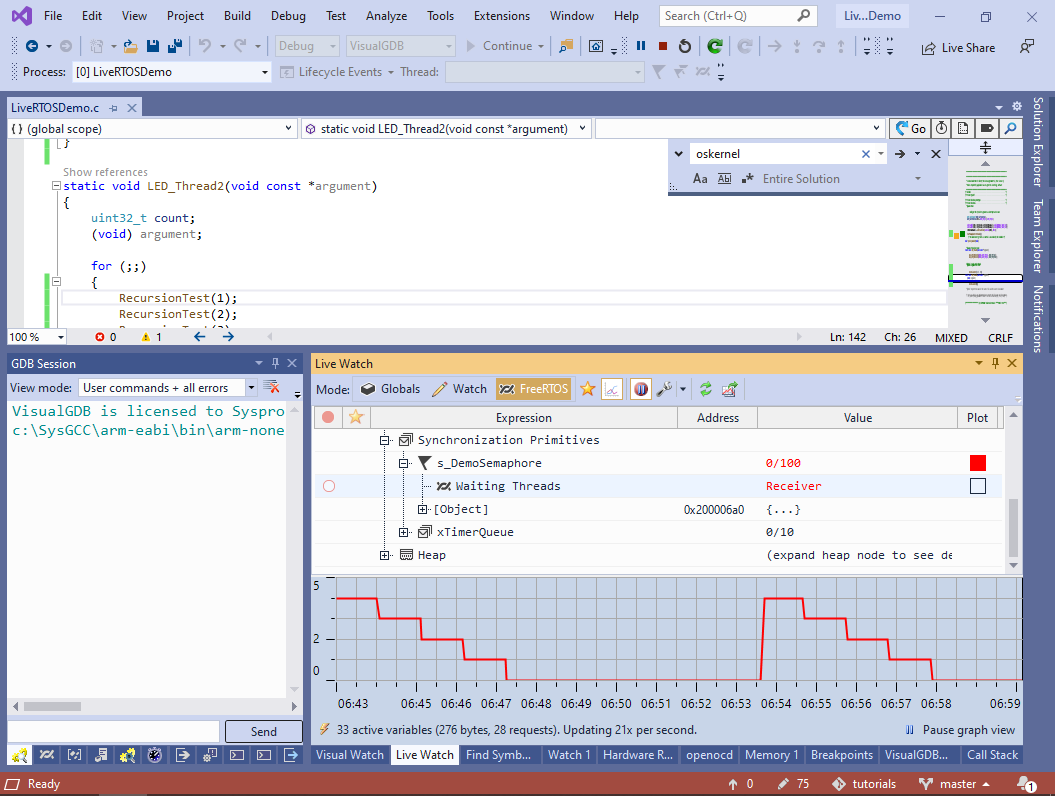 Live Watch will also show the threads waiting for a semaphore or a queue, and the mutexes owning a mutex.
 - Finally, we will show how to observe the state of FreeRTOS heap. Modify LED_Thread1() as shown below:
        char *test = (char *)pvPortMalloc(16);
        memset(test, 0x55, 16);
        HAL_GPIO_WritePin(GPIOD, GPIO_PIN_12, GPIO_PIN_SET);
		osDelay(2000);
        vPortFree(test);
Then start debugging and begin plotting the Heap -> Allocated Blocks metric:
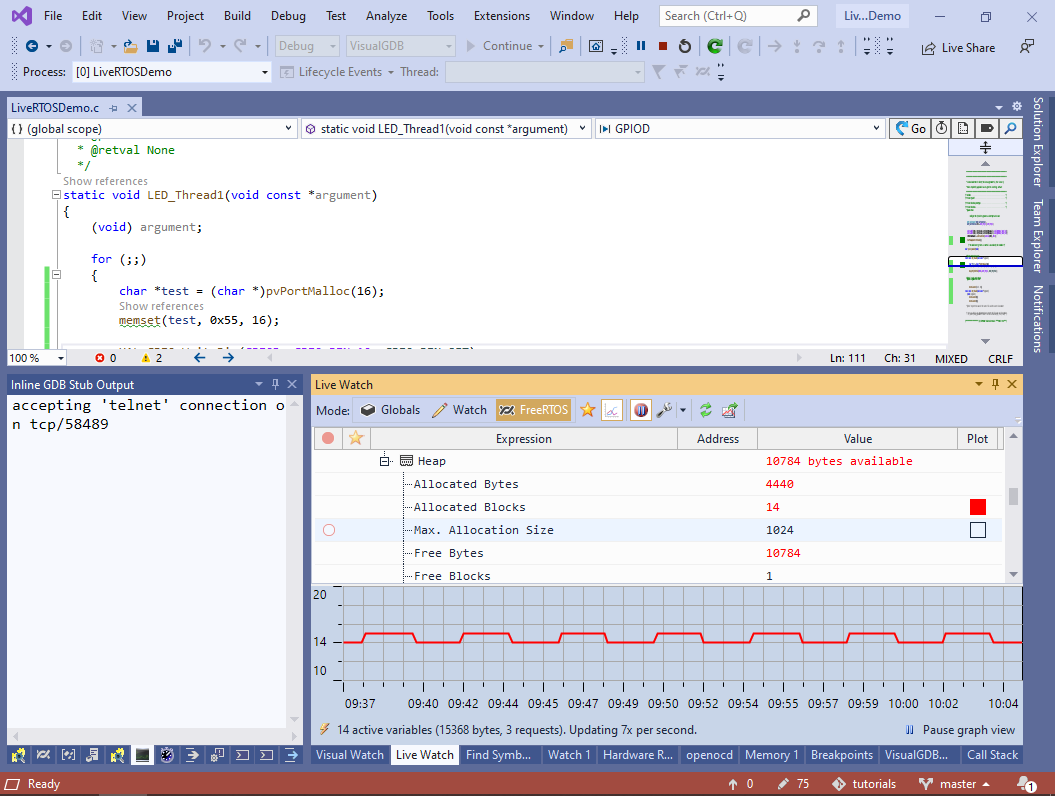 VisualGDB will show how it switches between 14 and 15, as the thread keeps allocating and releasing the memory.
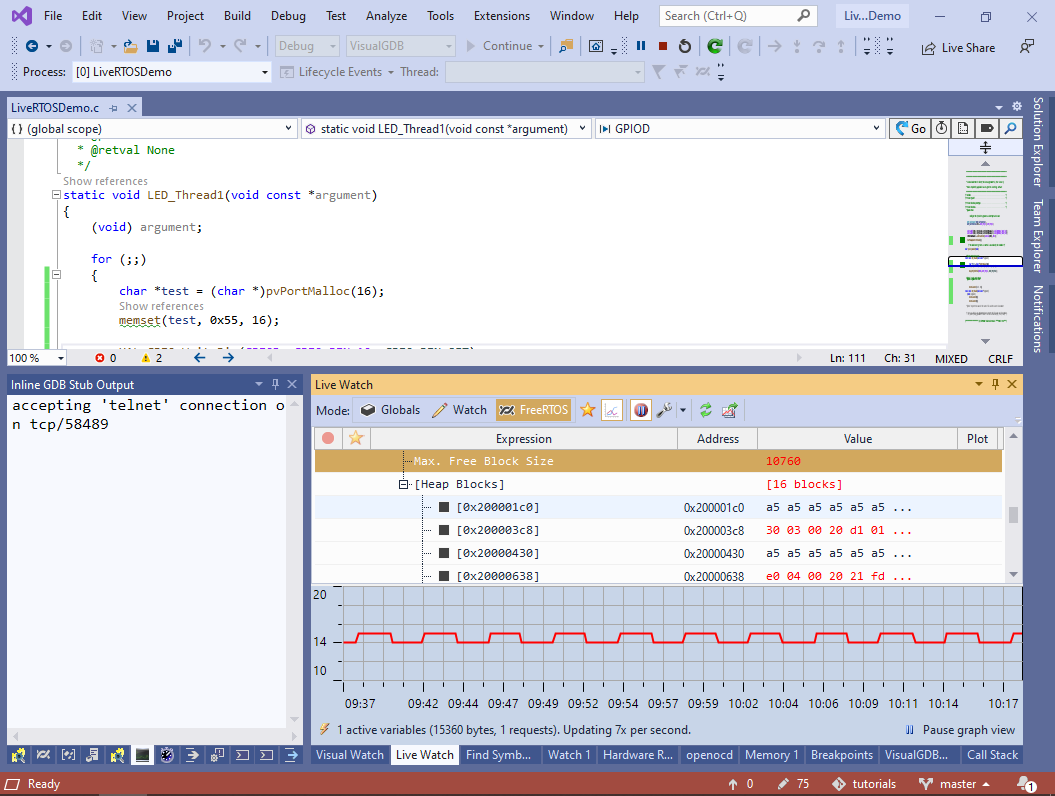
 - You can also view individual heap blocks. Expand the [Heap Blocks] node and go to the end of the list:
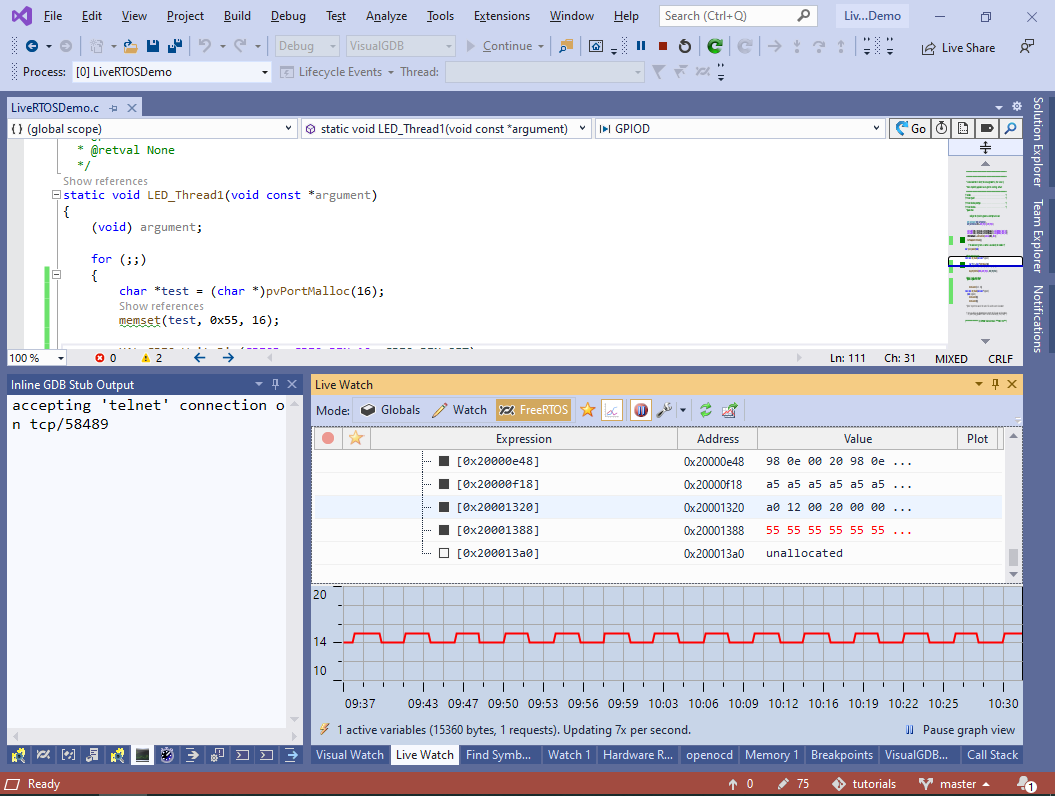
- The block allocated from LED_Thread1() will appear at the end of the list, showing the correct contents:
The FreeRTOS-specific logic of Live Watch is implemented in a separate open-source plugin, so you can fork and extend it to support any project-specific functionality you would like to monitor.
You can find the project shown in this tutorial in our GitHub repository.