Targeting MCUXpresso-based NXP devices with Visual Studio
This tutorial shows how to use VisualGDB to target modern NXP devices based on the MCUXpresso SDK. We will target the multi-core LPC55S69 device and will show how to import the following parameters from the MCUXpresso ecosystem:
- The MCUXpresso SDK that provides the header files and linker scripts for the device
- Various device-specific examples from the SDK
- The debug configuration for the LPC-Link probe using the low-level tools from the MCUXpresso IDE
Before you begin, install VisualGDB 5.5 or later. If you are planning to use the on-board LPC-Link probe, also install the MCUXpresso IDE so that we could import the debug settings from it.
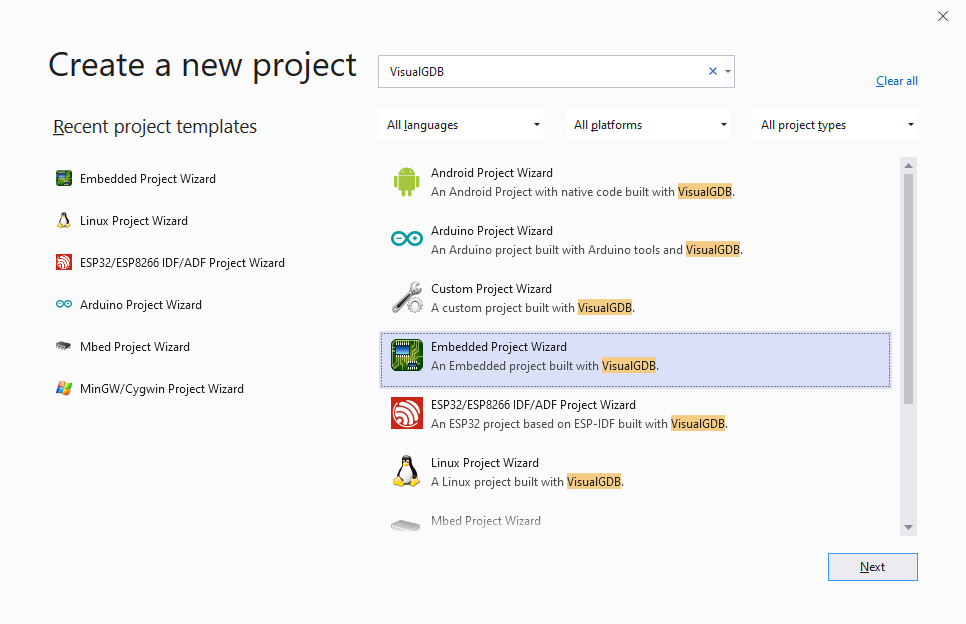
- Start Visual Studio and open the VisualGDB Embedded Project Wizard:
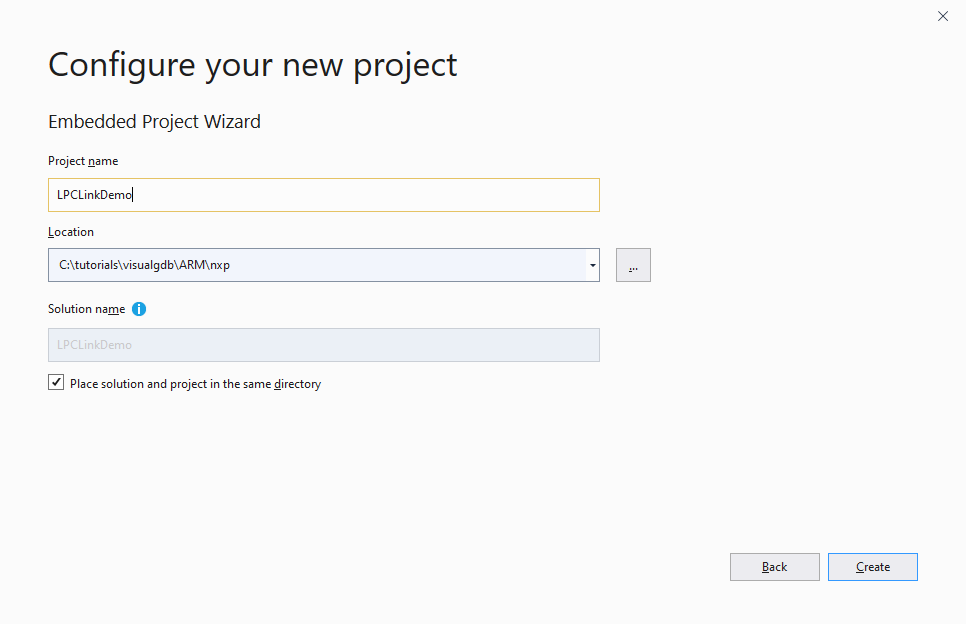
- Pick a name and location for your project, then press “Create”:
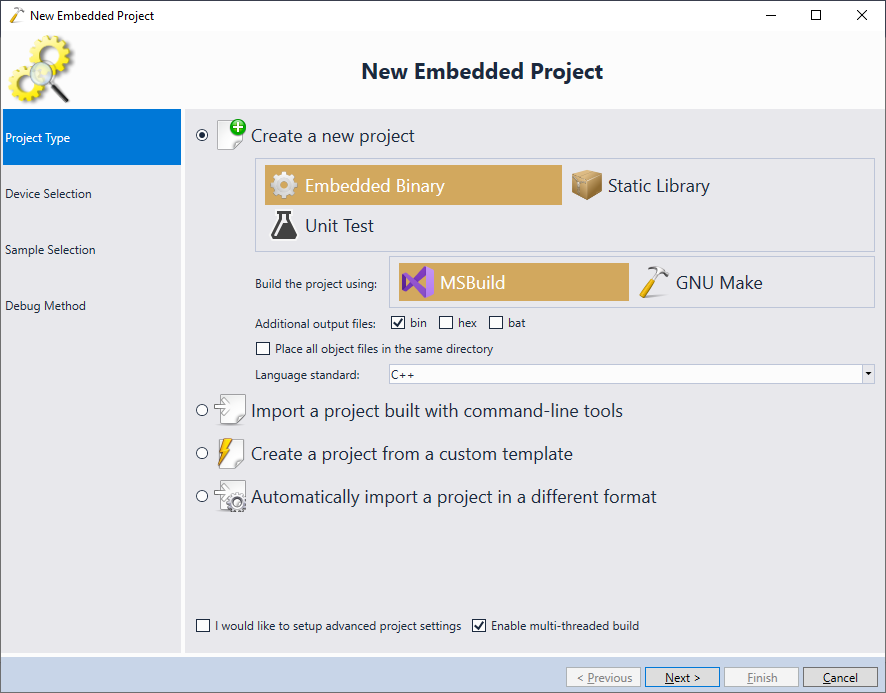
- Proceed with the default settings (Create a new project -> Embedded Binary -> MSBuild):
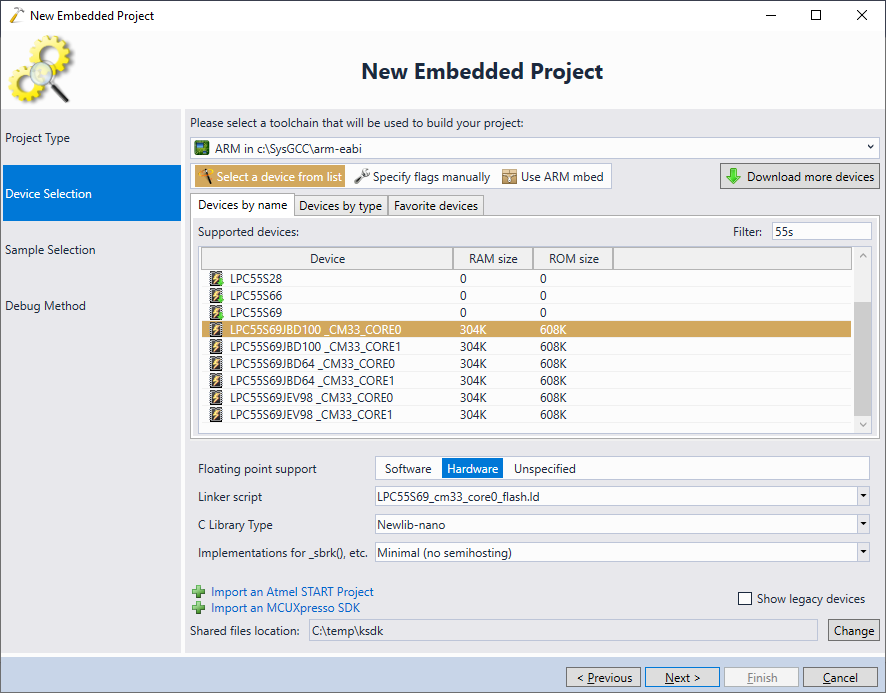
- On the next page of the wizard, select your NXP device. VisualGDB will automatically load the list of devices from the online MCUXpresso database, however you would need to download the SDK manually and import it into VisualGDB:

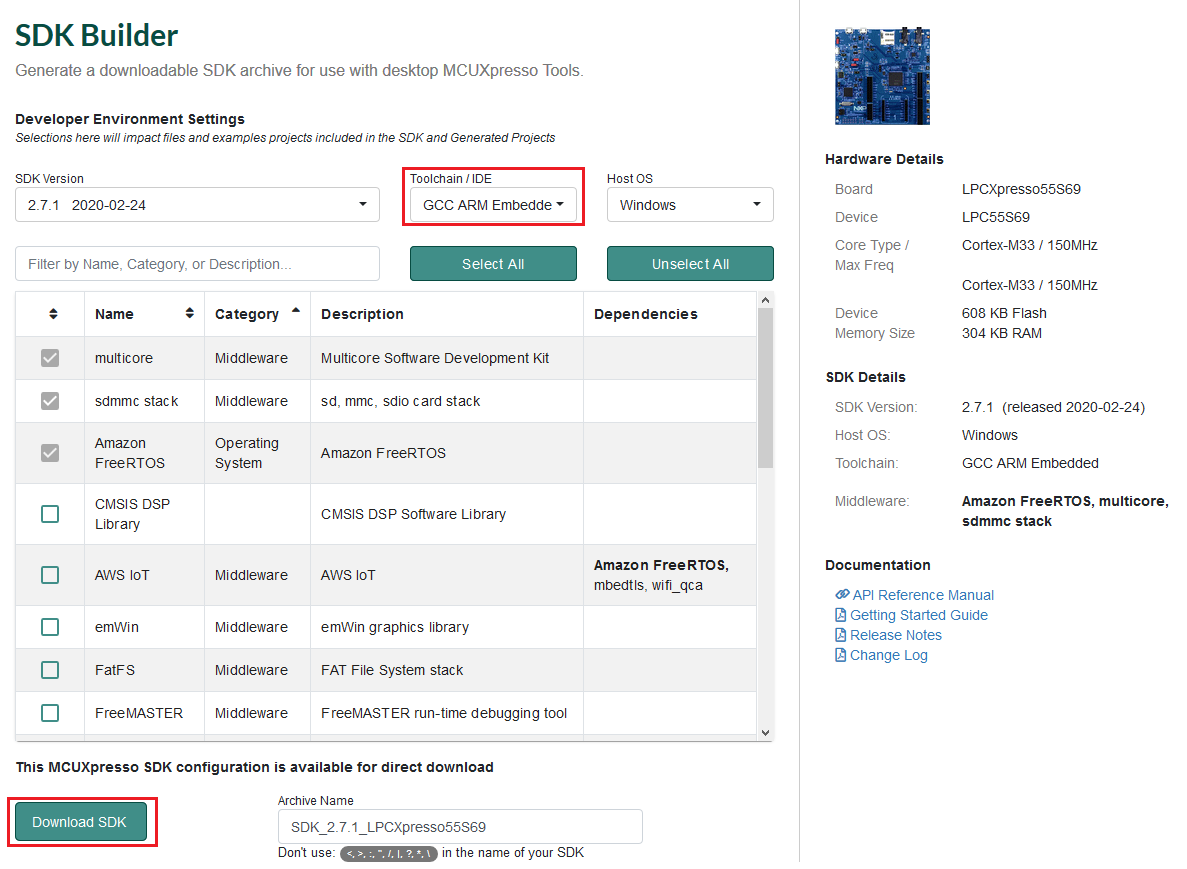
- Go to the online MCUXpresso SDK builder and generate an SDK for your device. Make sure you select the GCC ARM Embedded toolchain:
- Unpack the SDK into any location on your computer and click “Import” in the VisualGDB’s wizard. Once the SDK is imported, the devices from it will appear in the regular device list. Select your device and click “Next” to continue:
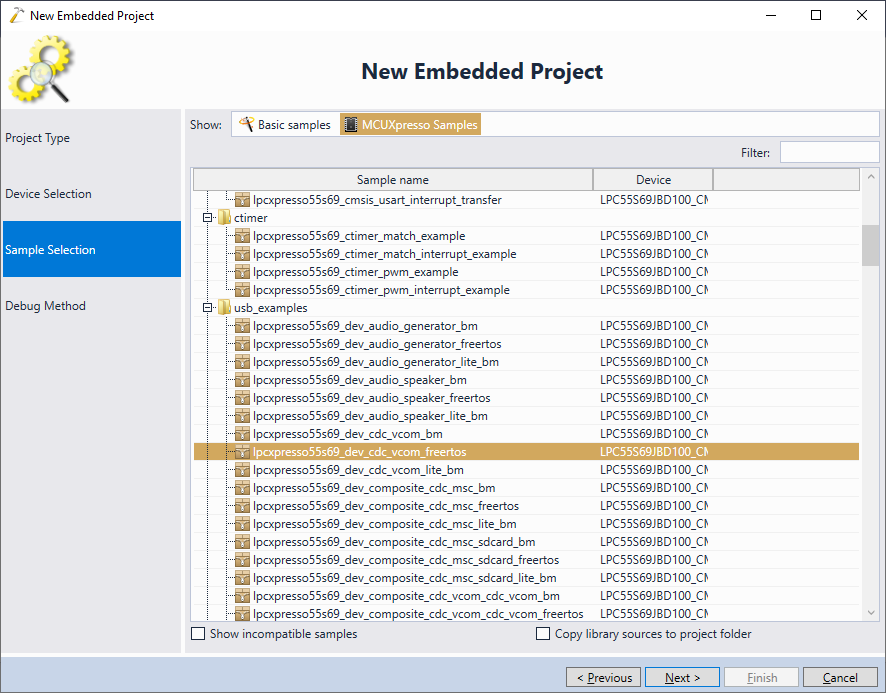
- Importing the SDK will automatically convert the MCUXpresso examples in a format compatible with VisualGDB. Select “MCUXpresso Samples” on the next page and pick a sample you would like to clone:
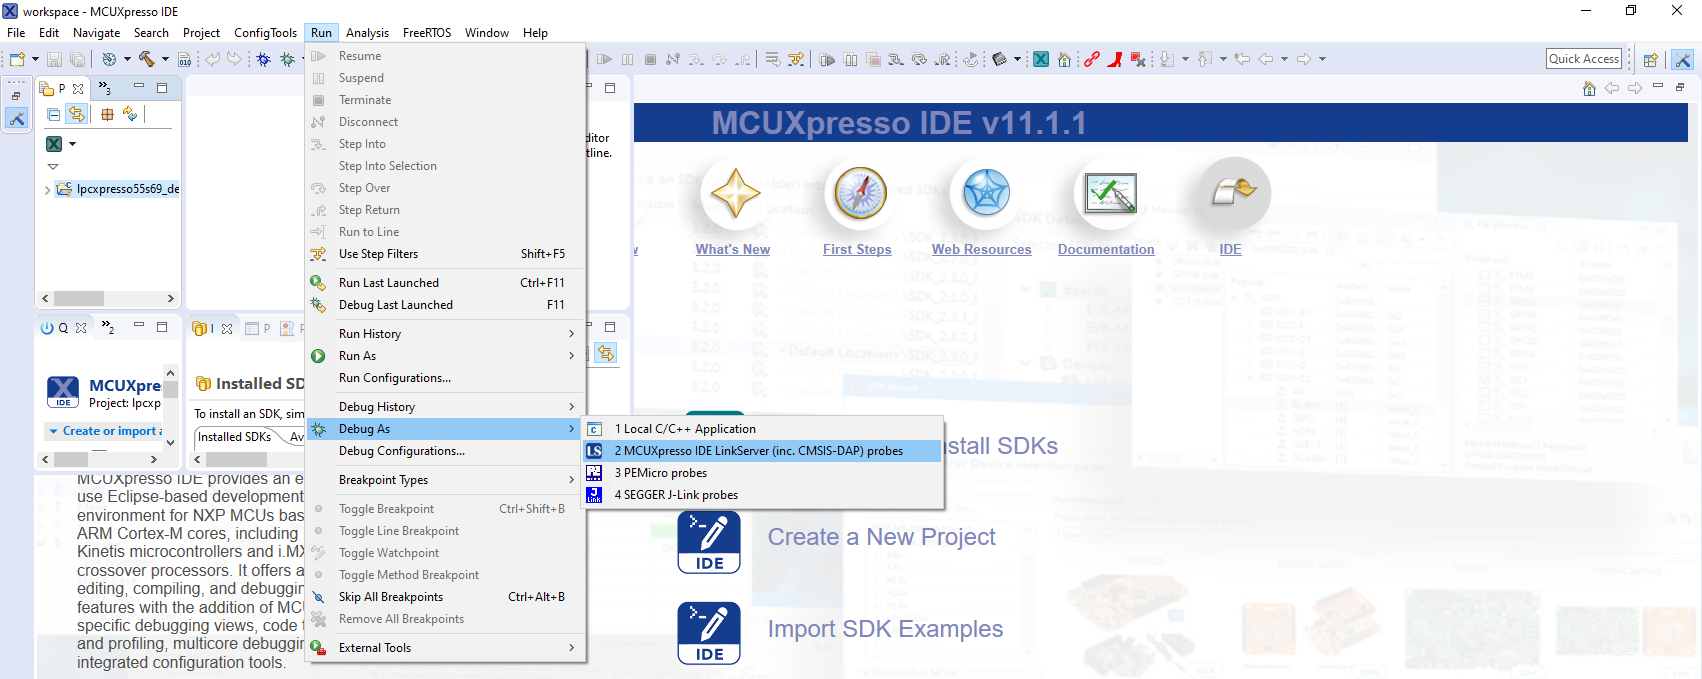
- Finally, we will configure the debug settings. If you would like to use the on-board LPC-Link debug probe, make sure you have installed MCUXpresso and can launch a debug session with it:
 This will automatically generate the configuration files for the LPC-Link debug stack that could be used by both MCUXpresso IDE and VisualGDB.
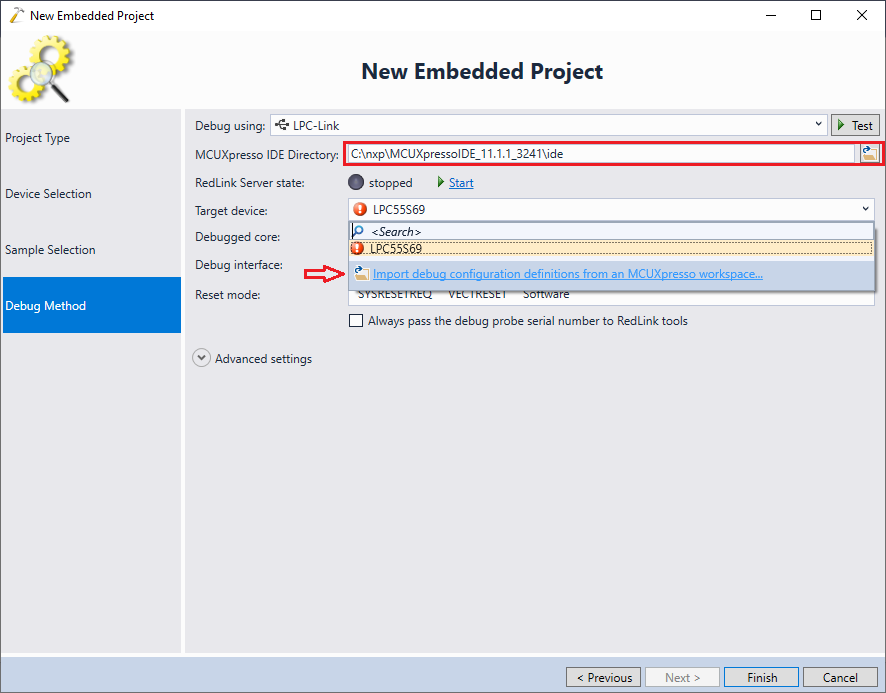
 - Select your LPC-Link instance on the Debug Method page of the wizard and enter the path to MCUXpresso IDE directory. If the device list does not show the device you are debugging, click “Import debug configuration”:
 Then, locate the MCUXpresso workspace directory:
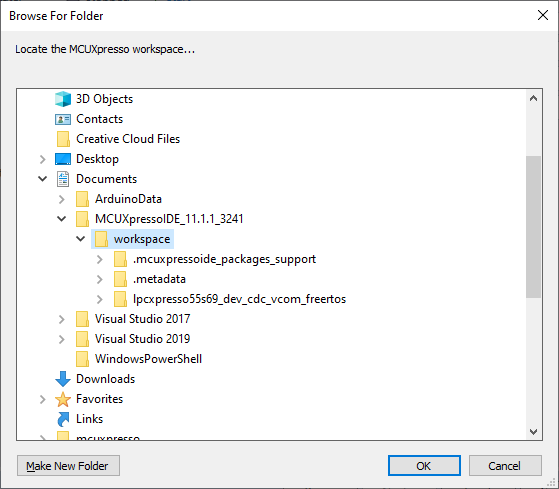 The generated debug configurations are be stored in the .mcuxpressoide_packages_support subdirectory inside the workspace directory.
 - Once you import the debug configurations in VisualGDB, it will copy them under %LOCALAPPDATA%\VisualGDB\RedLinkDebugPackage, so you won’t need to keep the original MCUXpresso projects anymore. Click “Test” to test the LPC-Link debug setup:
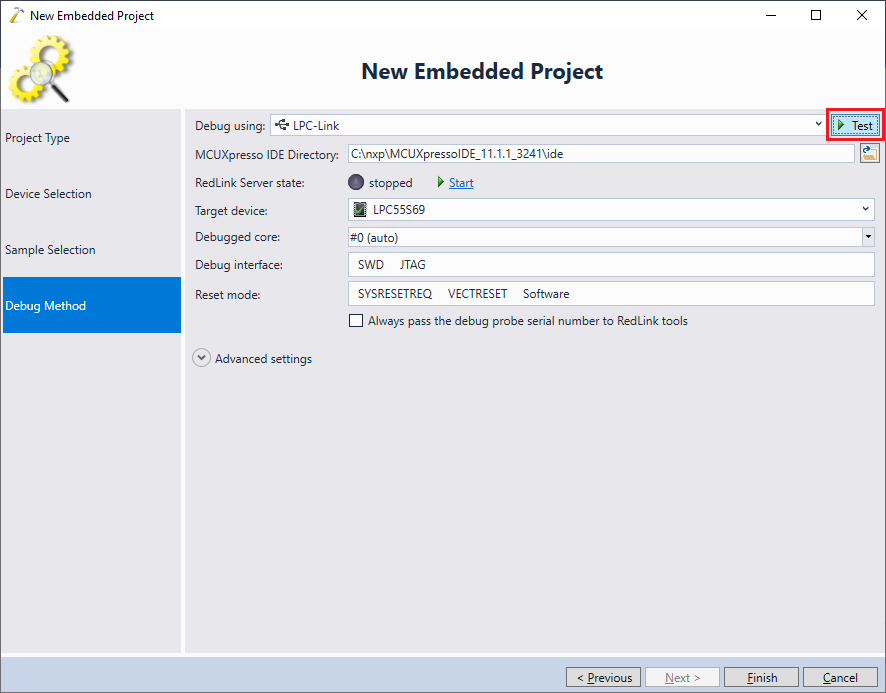
- VisualGDB will launch the gdb stub used by the MCUXpresso IDE and will verify that it can connect to the target:
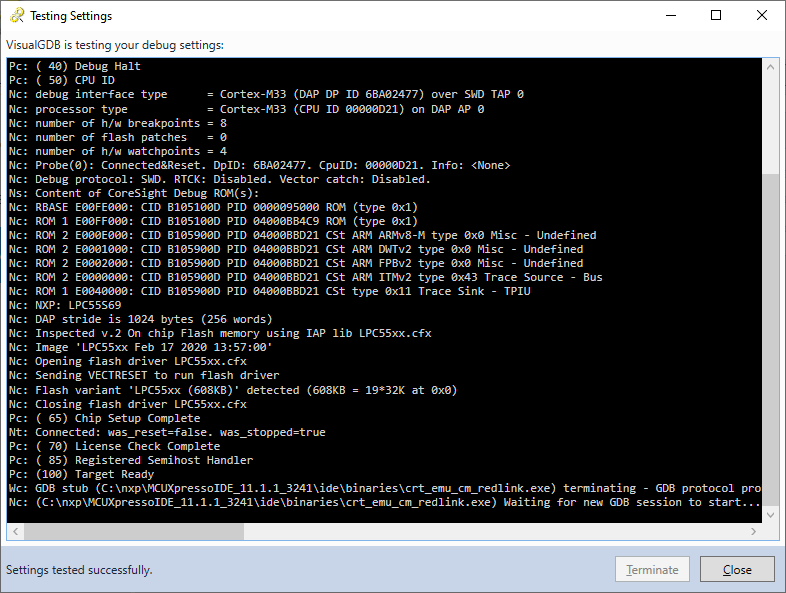 If the tool does not connect, make sure it works with the MCUXpresso IDE and try restarting the RedLink server using the button below the MCUXpresso directory setting.
If you are using a different debug probe (e.g. Segger J-Link), you do not need to install the MCUXpresso IDE, or import any debug-specific settings. - Click “Finish” to finally create the project. Once it is created, build it by pressing Ctrl-Shift-B:
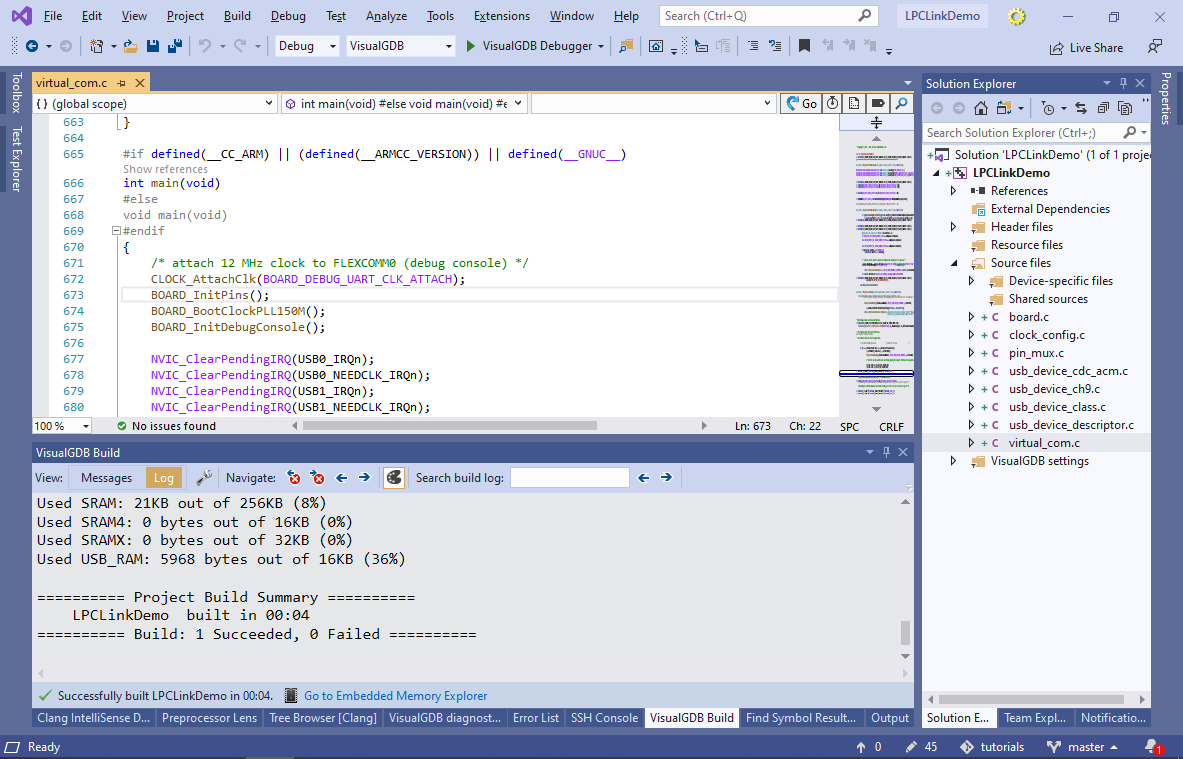
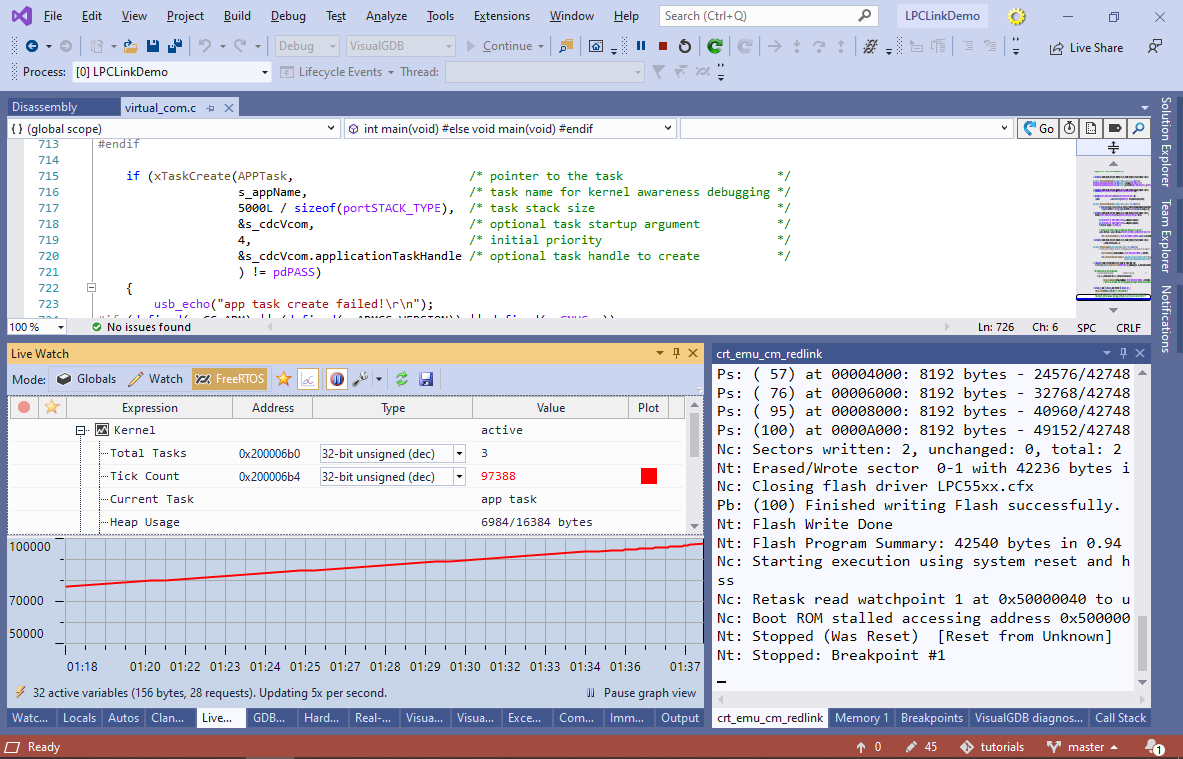
- Press F5 to begin debugging. VisualGDB will program the FLASH memory and will launch the target. You can use the Live Watch window to observe what the firmware is doing without setting any breakpoints, or pausing it. E.g. you can see the list of FreeRTOS tasks, tick count, and other parameters:
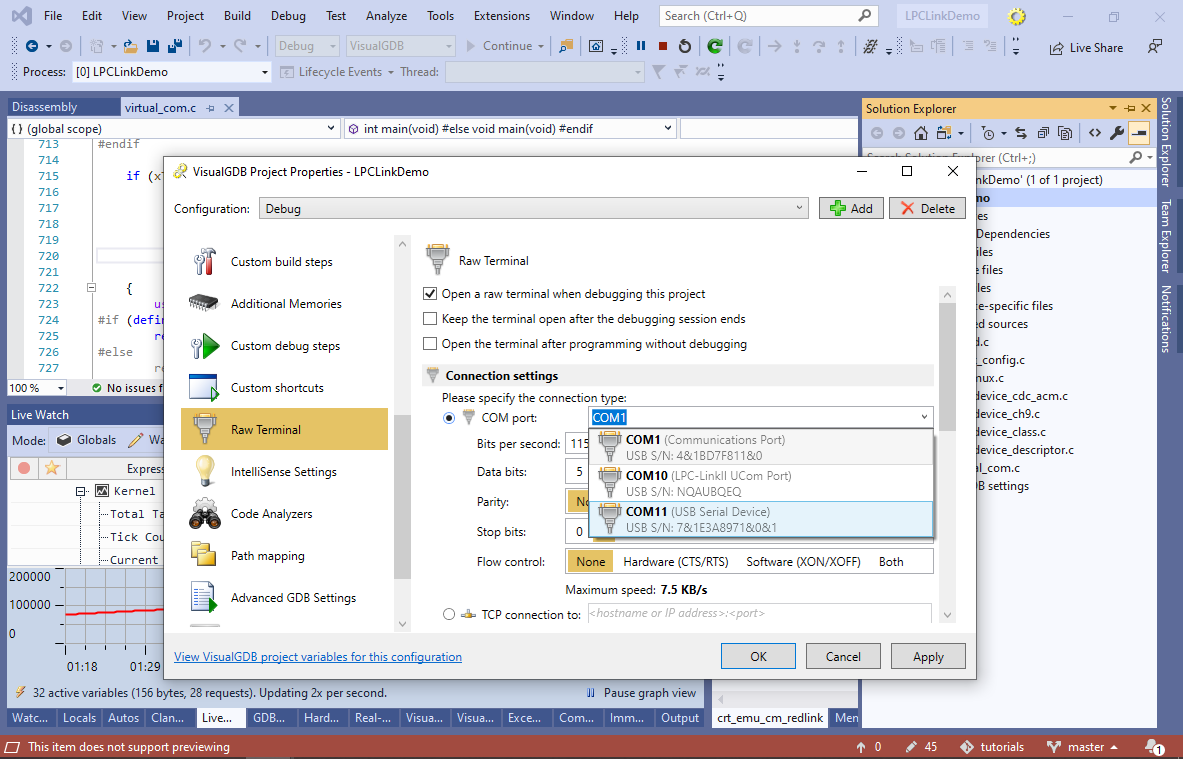
- In this tutorial we are debugging a virtual COM port example that will appear in the device manager once you start the debug session. Go to the Raw Terminal page of VisualGDB Project Properties and select its COM port in the list:
- Then restart the debug session and use the terminal window in Visual Studio to send some data to the board and observe how it’s echoed back. You can either use the Live Watch mode to observe the state of the program in real-time, or set breakpoints and utilize the regular watch/locals windows:

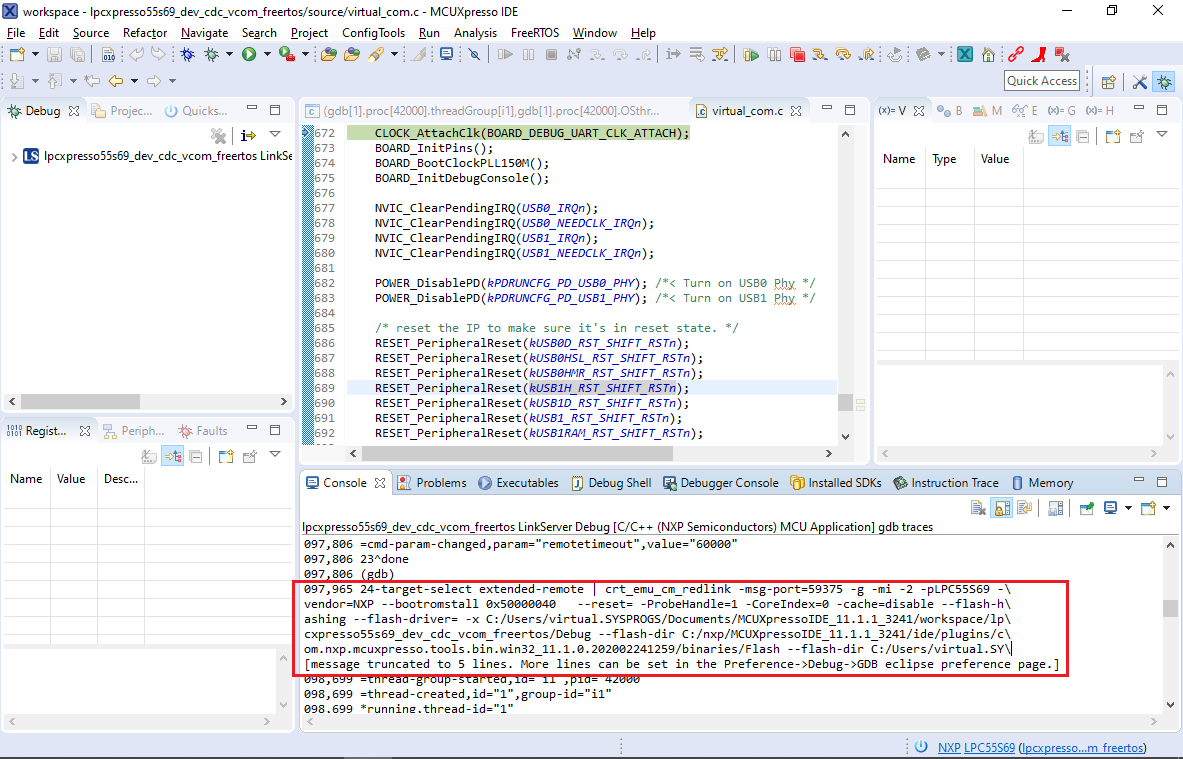
- If your board requires special debugging setup, you can tweak the command line used by VisualGDB to launch the RedLink gdb server. Locate the command line in the MCUXpresso IDE debug log (search the gdb traces log for “-target-select“):
 Then expand the Advanced Settings view in VisualGDB Project Properties. You can modify the command line template used by VisualGDB to match the arguments passed by the MCUXpresso IDE: