Targeting Multi-Core nRF53 Devices with Visual Studio
This tutorial shows how to create, build and debug a basic project for the multi-core nRF5340 device
The nRF5340 device includes 2 cores:
- The application core runs the high-level logic.
- The network core, running at a lower clock frequency, receives low-level Bluetooth LE requests from the network core and resends them to the BLE hardware.
In this tutorial build the Nordic LED and Button Service example for the nRF5340-DK board (peripheral_lbs), and will show how to observe and control the LEDs and observe the buttons on the board using a Bluetooth LE-capable Android device. We will also show how the 2 cores interact, and how to debug them at the same time using 2 independent Visual Studio instances.
Before you begin, install VisualGDB 5.5 or higher.
- Start Visual Studio and locate the VisualGDB nRFConnect Project Wizard:

- First, we will create the project for the Application core. Note that we won’t be able to actually use it until we program a special firmware into the Network core (shown later in the tutorial). Pick the name and location for the Application core project:

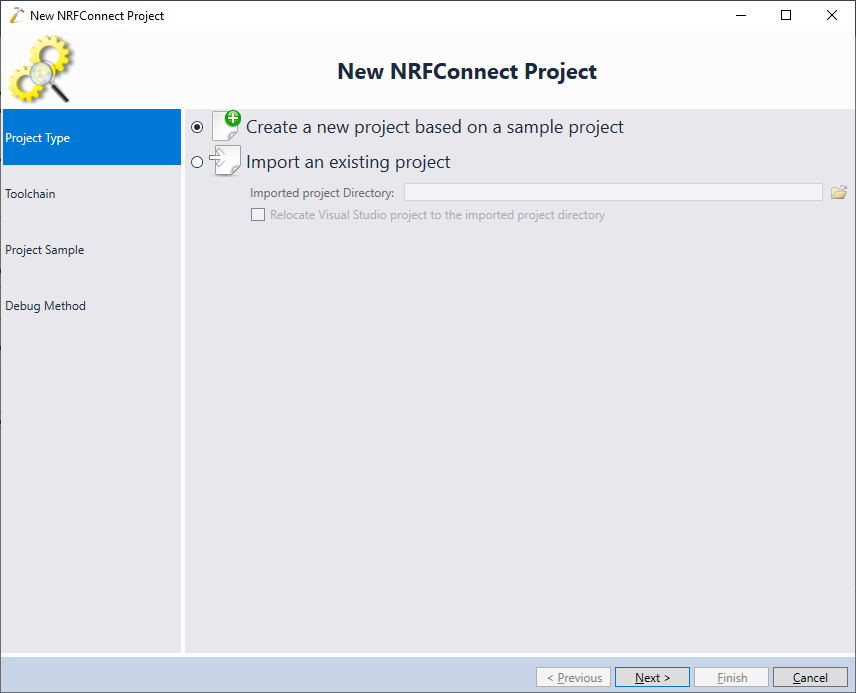
- Select “Create a new project based on a sample project”:
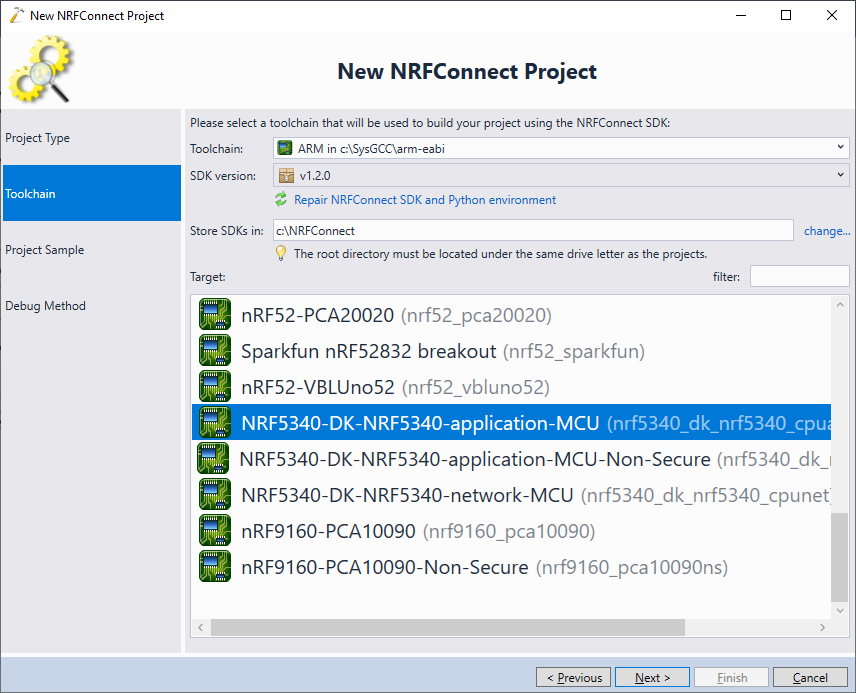
- Pick your ARM toolchain, nRFConnect checkout (follow this tutorial for instructions on getting nRFConnect checkouts working) and the target device. The target for the application core of nRF5340 is called NRF5340-DK-NRF5340-application-MCU:
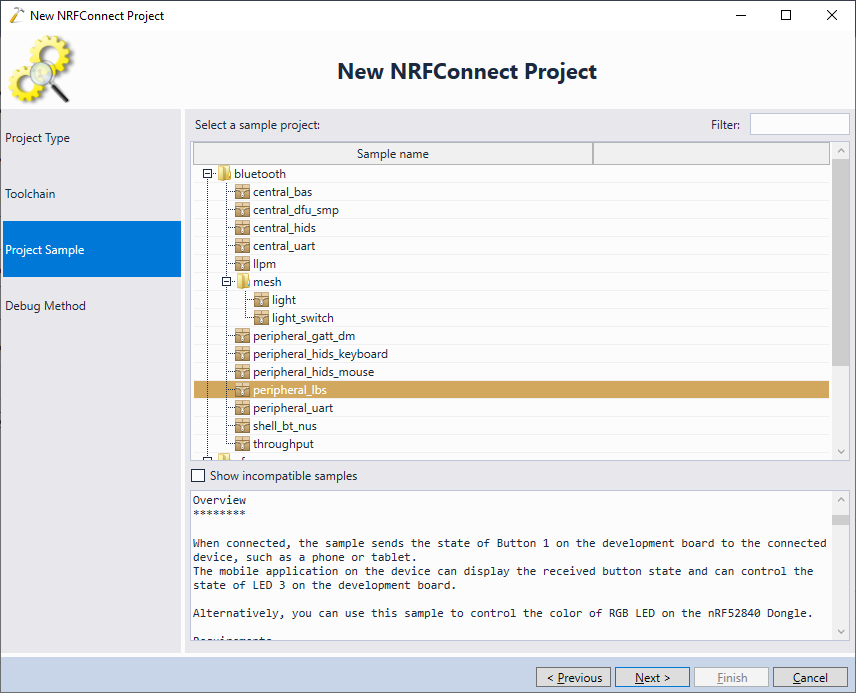
- On the on the next page pick the peripheral_lbs example that exposes the on-board LEDs and buttons via Bluetooth LE:
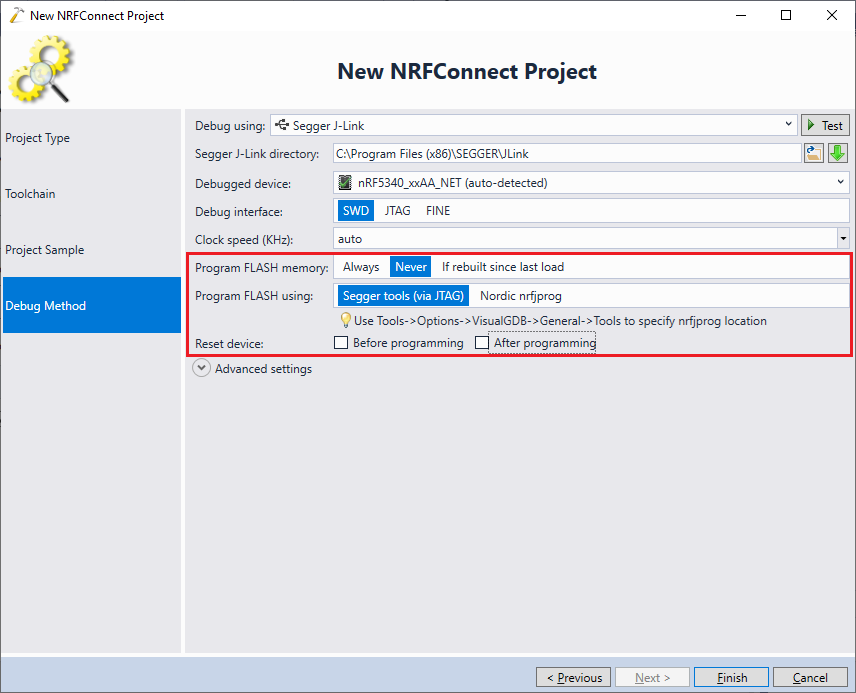
- Make sure you are using the latest version of the Segger J-Link software and have installed the nRF Command-Line tools. Then plug your board into the USB port and configure the debugging settings as shown below:
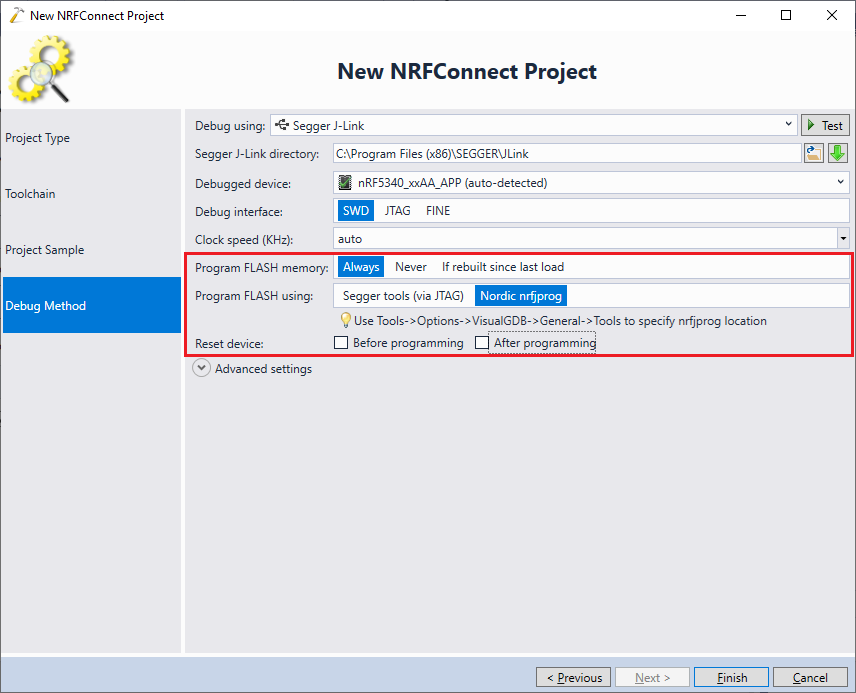 We recommend programming the FLASH memory with nrfjprog as it handles core reset better than the J-Link GDB stub.
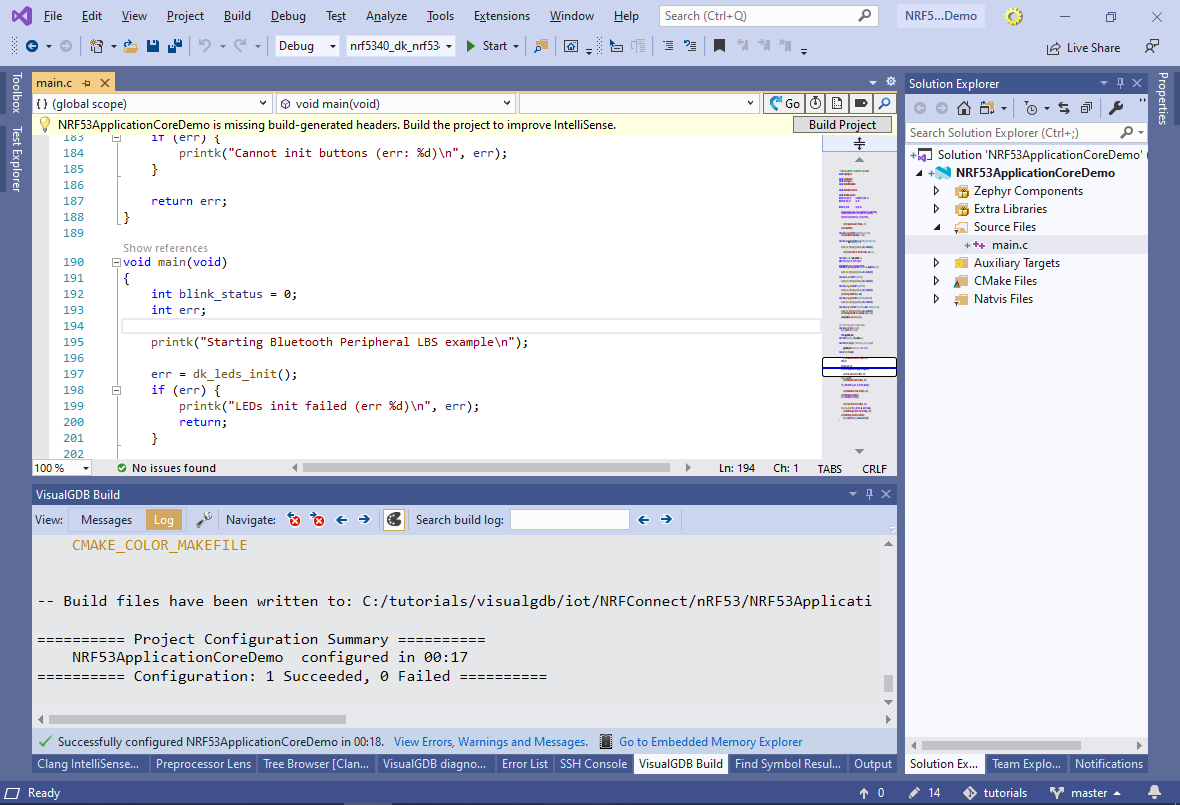
 - Press “Finish” to complete the wizard. VisualGDB will generate a basic project based on the nRFConnect framework, showing its contents in Solution Explorer:
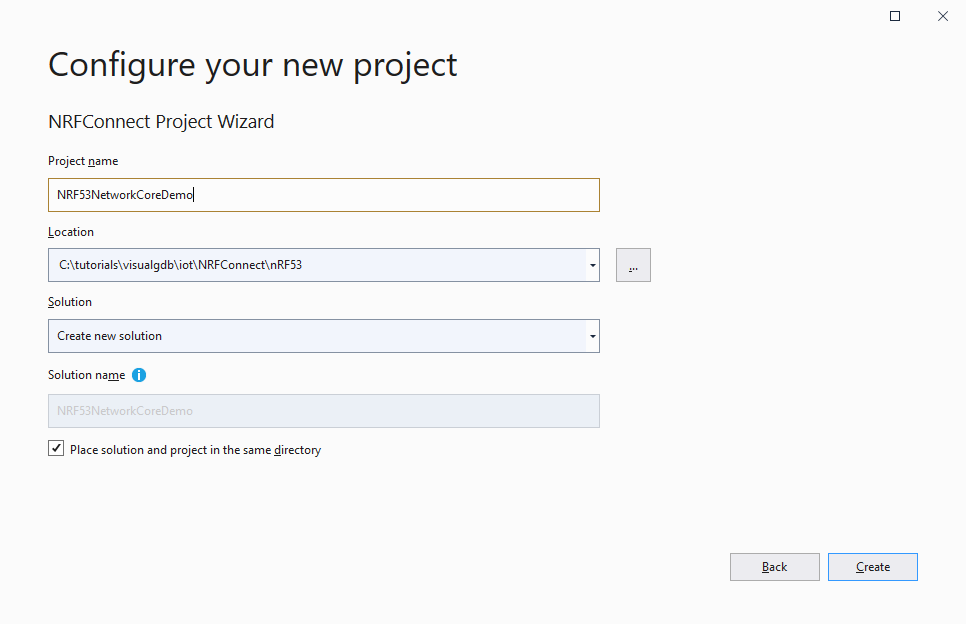
- Now we will create a project for the network core. It will receive commands from the peripheral_lbs example and will forward them to the Bluetooth LE hardware. Start another instance of Visual Studio, select the nRFConnect Project Wizard again and pick the location for the second project:
- This time, select the network core (NRF5340-DK-NRF5340-network-MCU):

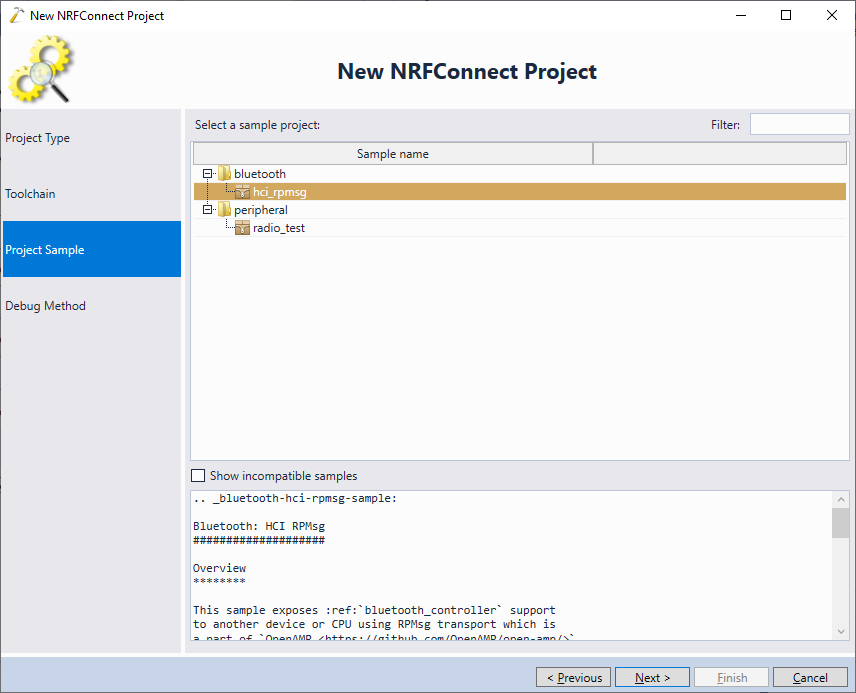
- Select the hci_rpmsg sample. This project needs to run on the Network core in order to use any of the Bluetooth LE examples on the Application core:
- The nRFConnect tools will program the FLASH memory for both Application and Network cores when launching the Application project (we will show how to link the two projects later in the tutorial), so make sure you select “Program FLASH Memory = Never” and disable device resetting:
 We also suggest double-checking that the debugged device shows nRF5340_xxAA_NET and not nRF5340_xxAA_APP.
 - As of nRFConnect SDK 1.2.0, trying to build the nRF5340 samples without optimization will result in a stack overflow. To avoid this, set configuration-specific optimization to “Optimize for debugging” as shown below:
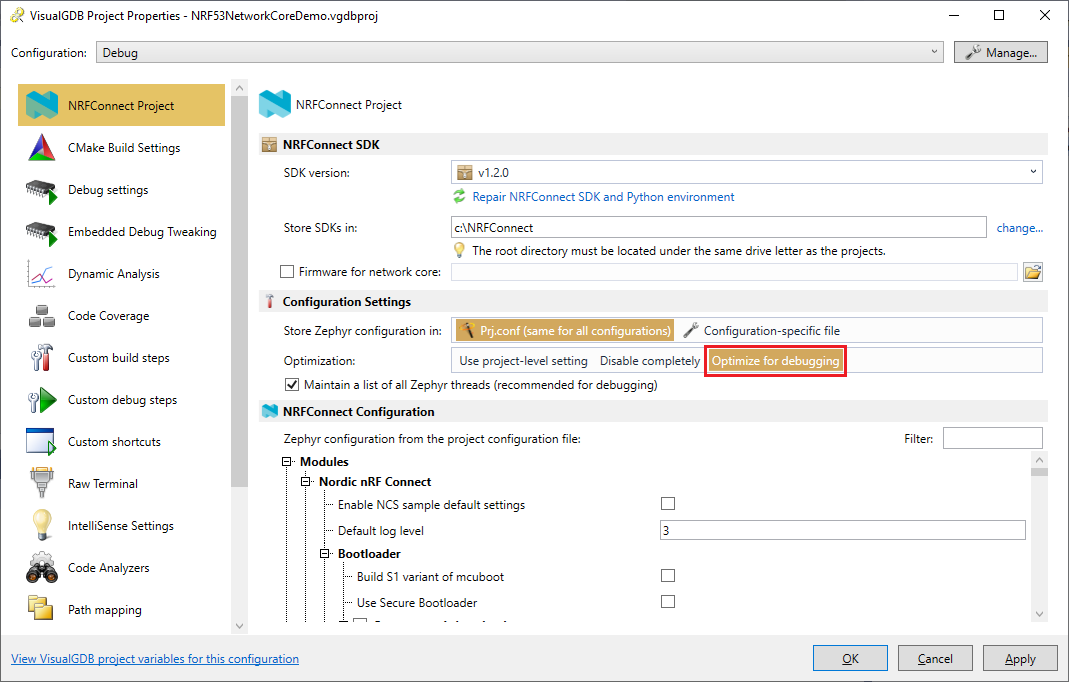 Note that this will slightly reduce debugging usability compared to no optimization (e.g. unused variables will be eliminated and hence won’t be viewable).
 - Build the project by pressing Ctrl-Shift-B:
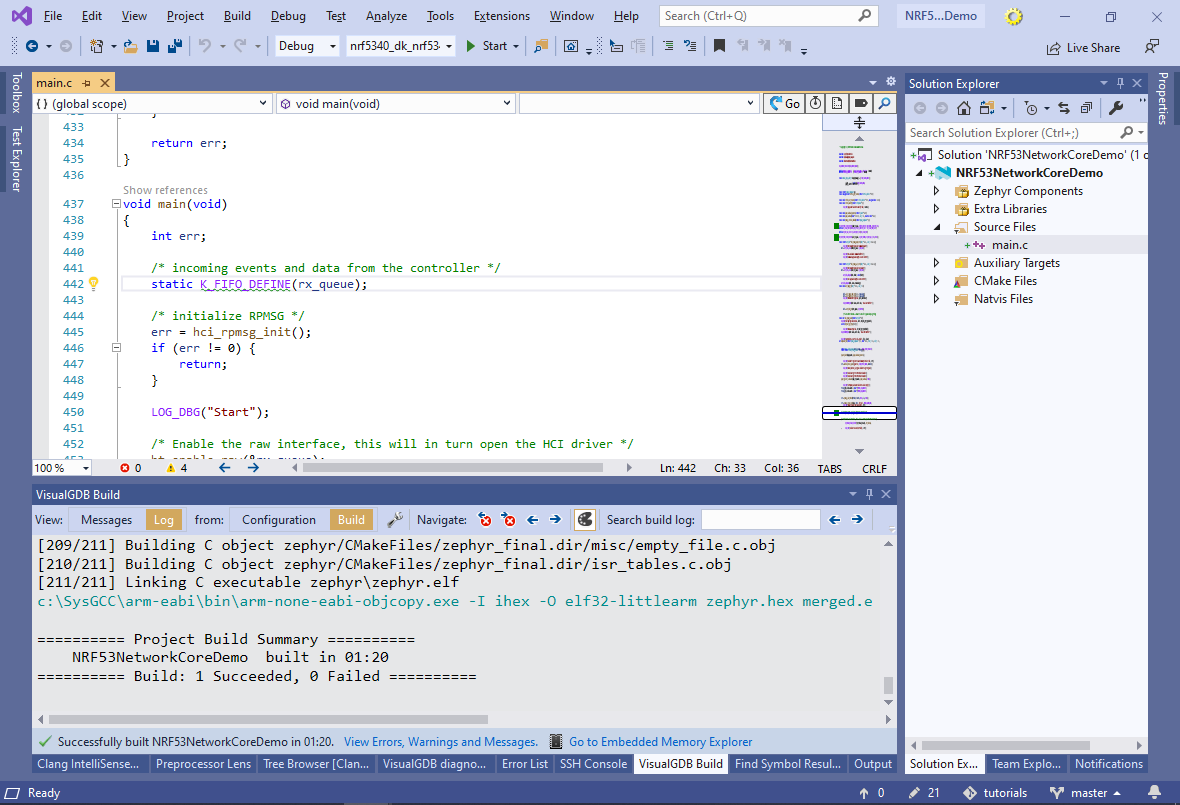
- When the build succeeds, go to the VisualGDB Project Properties of the Application core project (another Visual Studio instance) and link it with the network core project as shown below:
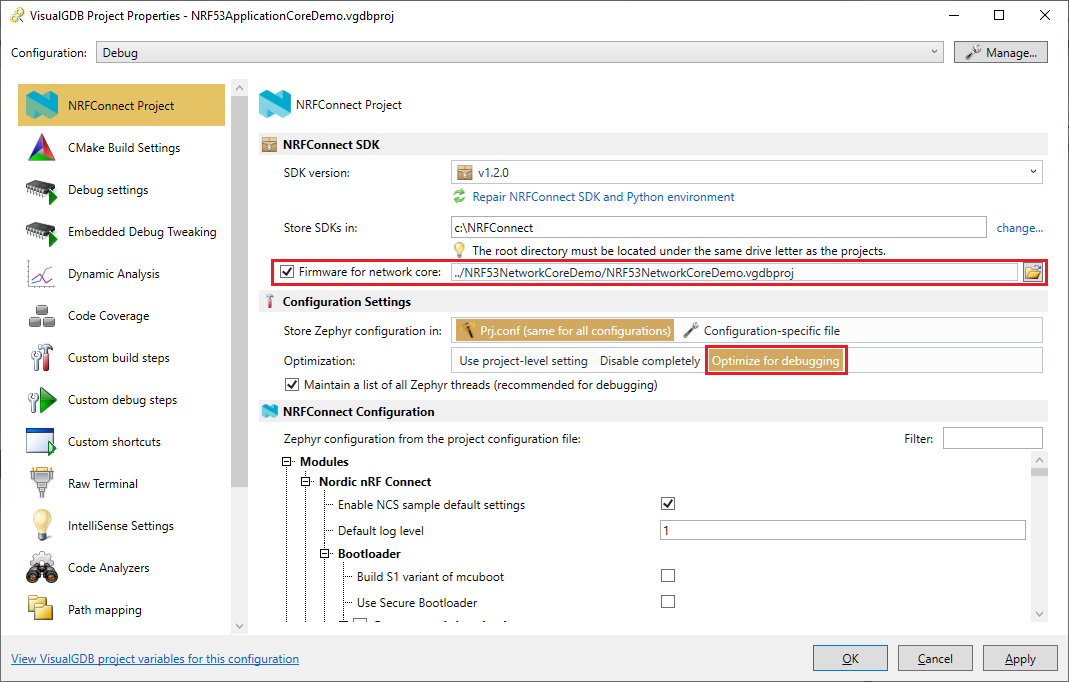 VisualGDB will automatically pick up the matching configuration/platform from the linked project when programming the FLASH memory, however it won’t rebuild it automatically when building the Application core project.
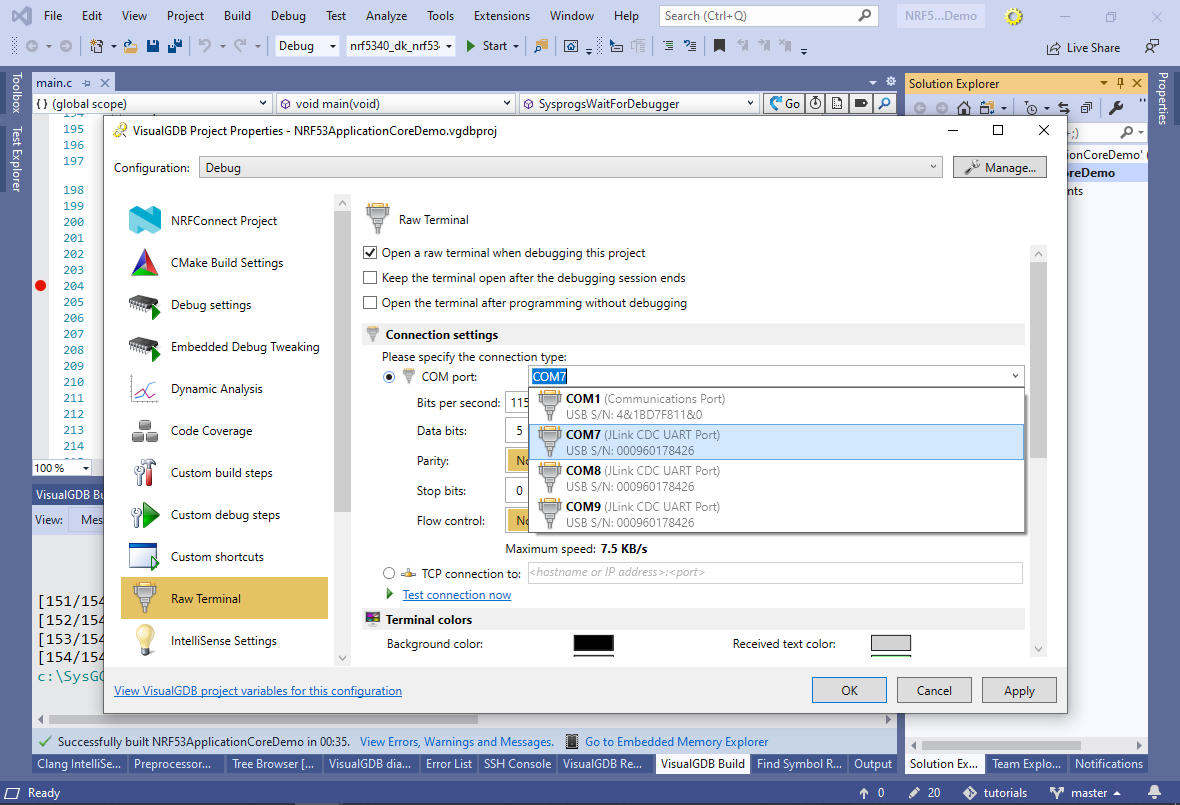
 - If you are using the Custom edition or higher, you can use the Raw Terminal page of VisualGDB Project Properties to observe the debug output from the nRF5340-DK board. Otherwise, try using any other terminal program (e.g. SmarTTY):
- Normally, programming the FLASH memory using the nRFConnect tools will let the device start before VisualGDB gets a chance to attach to it. To work around it, add the following function to your main file and call it from main():
void __attribute__((noinline)) SysprogsWaitForDebugger()
{
    static volatile int SysprogsDebuggerAttached = 0;
    while (!SysprogsDebuggerAttached)
    {
    }
}
- Build the Application project, set a breakpoint in main() after the call to SysprogsWaitForDebugger() and start debugging it. The breakpoint will trigger, letting you step through the code. If you are using the Custom edition or higher, VisualGDB will automatically decode and show the state of Zephyr threads running on the core:

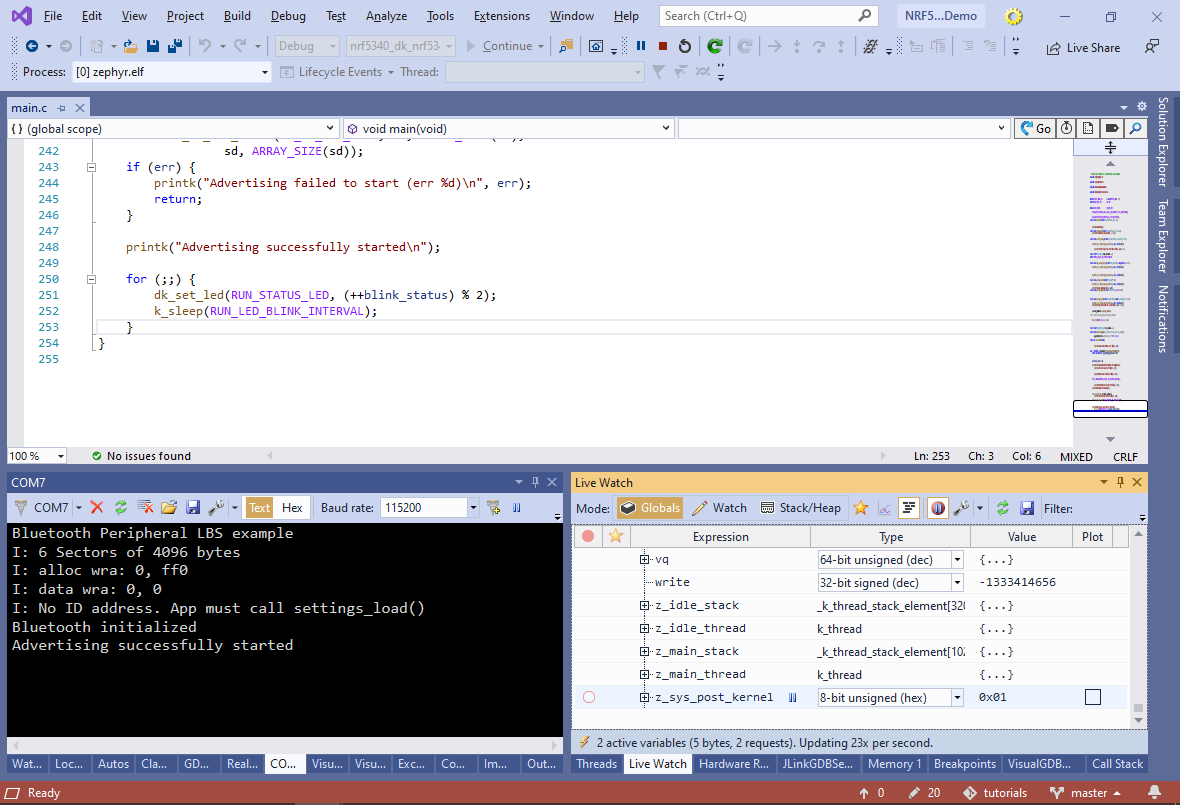
- Resume the program and observe the output in the Terminal window. Once the example fully initializes, it will print the “Advertising Successfully Started” message:
- Install nRFConnect for Mobile on your mobile device and locate the nRF52840 board. Connect to it and subscribe to the button events:
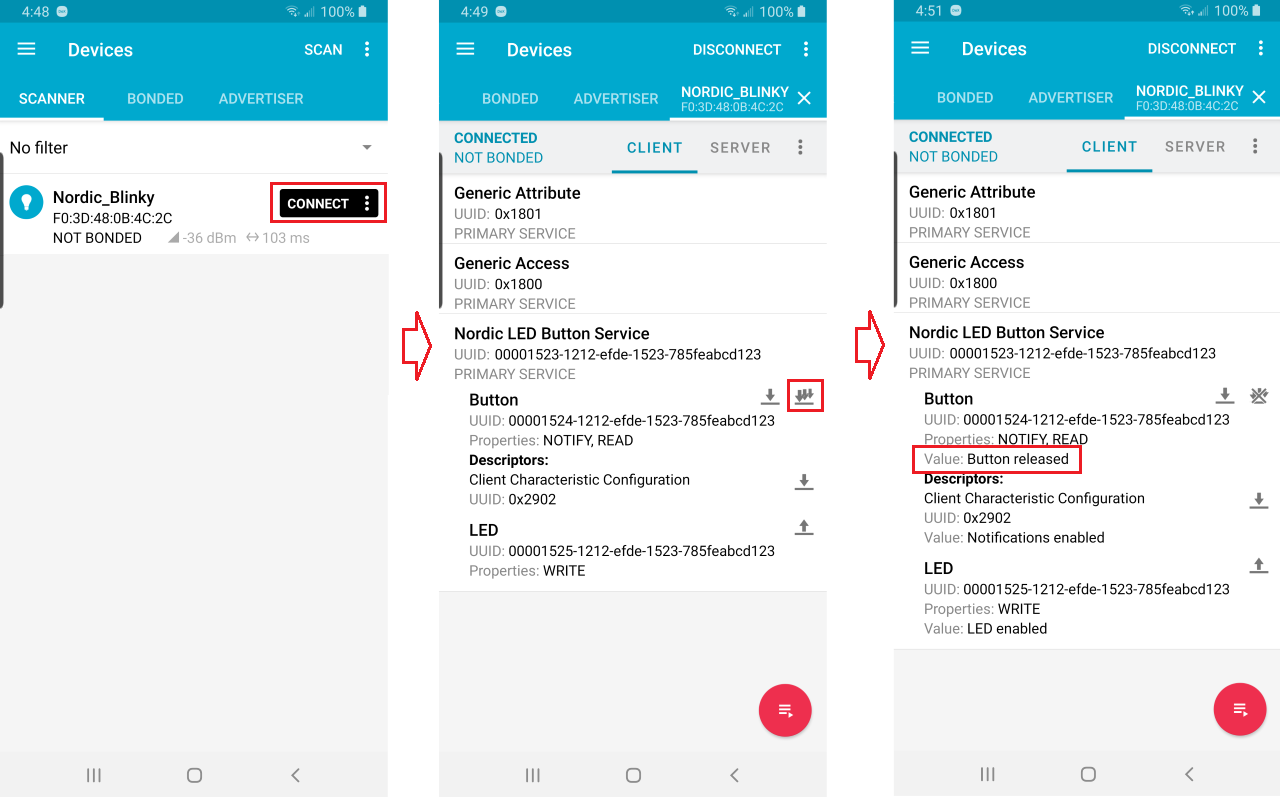 Each time you press or release the on-board button #1, the app will show the updated value.
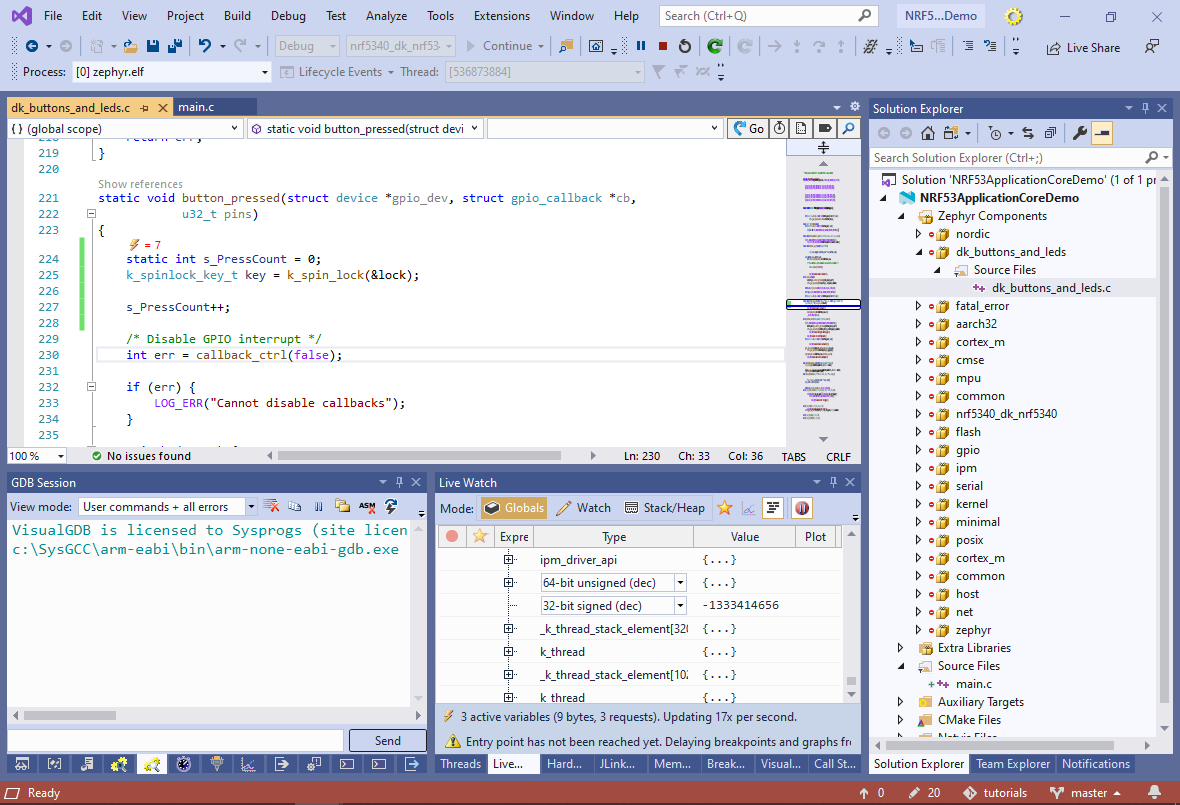
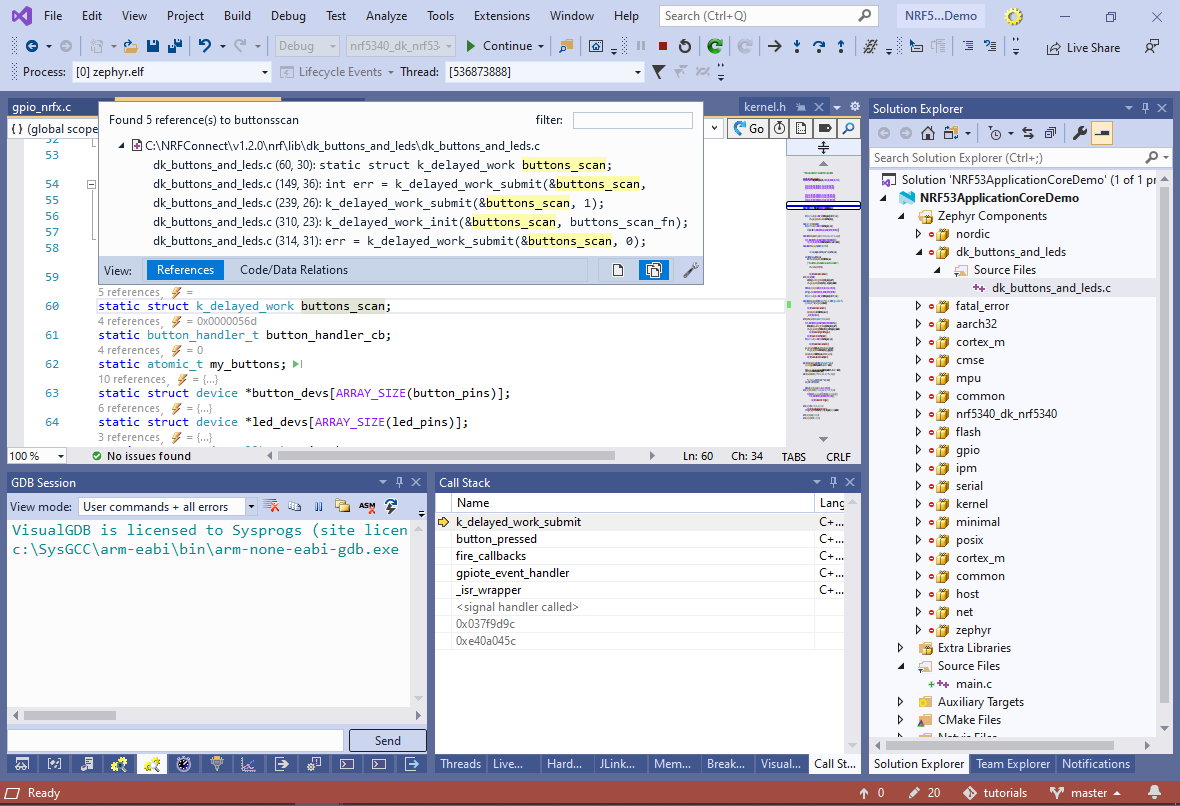
 - We will now show how the sample project passes the button state to the nRFConnect Mobile app. Note that stopping at a breakpoint would normally quickly lead to a Bluetooth LE time-out. As an alternative, consider adding invocation counters to functions that you would like to observe and then monitoring them using VisualGDB’s Live Watch. Add a counter to the button_pressed function in the dk_buttons_and_leds.c file and make sure it updates each time you press the button:
- The button_pressed() function calls the k_delayed_work_submit() function on the buttons_scan queue:
	case STATE_WAITING:
		state = STATE_SCANNING;
		k_delayed_work_submit(&buttons_scan, 1);
		break;
Use VisualGDB’s CodeJumps navigation to quickly find the handler for the queue (buttons_scan_fn()):
- The buttons_scan_fn() function gets invoked in a different thread and forwards the event to the Bluetooth LE core. You can set a breakpoint on it and step into the call stack to see how exactly this is done. The notable functions on the call stack are gatt_notify() that is used to send notification events for all GATT objects, and bt_conn_send_cb() that physically sends a low-level packet to the network core:

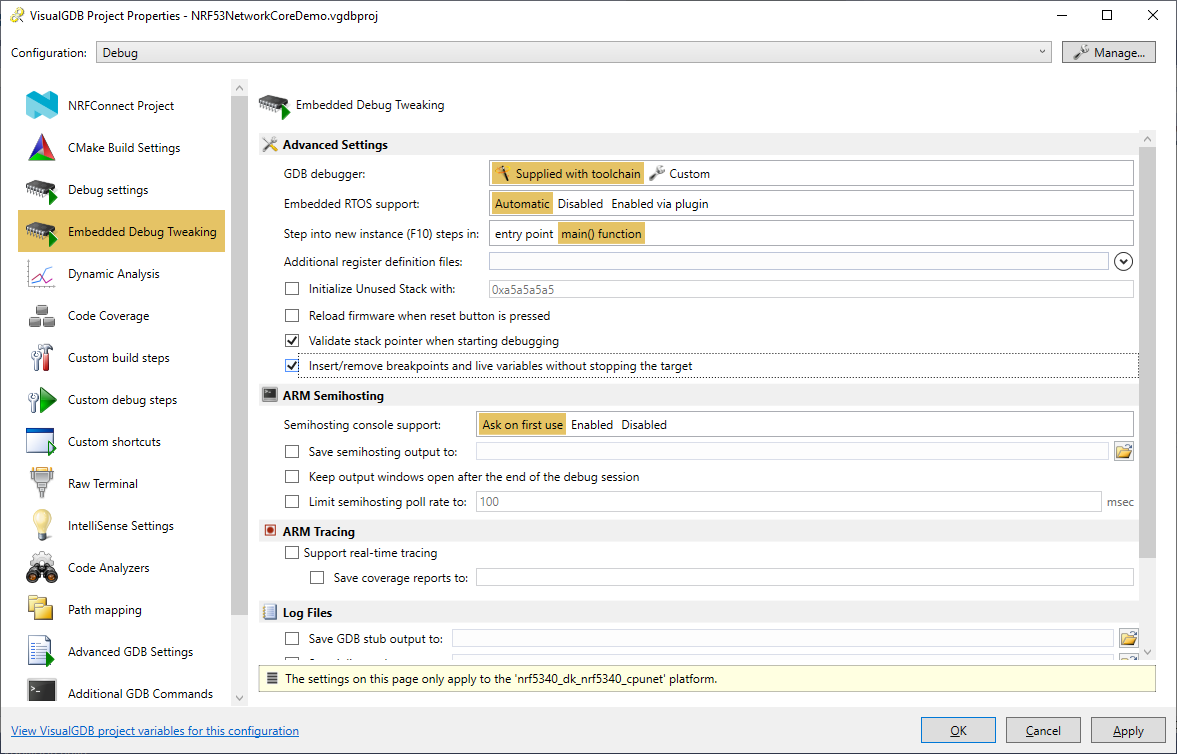
- Now we will debug code on the network core that receives the packet from the application core. To minimize the chance of Bluetooth LE time-outs while adding/removing breakpoints, enable the “Insert/remove breakpoints and live variables without stopping the target” checkbox in VisualGDB Project Properties:
- Set a breakpoint in gatt_notify() on the Application core and press the button, waiting for the breakpoint to trigger (you may need to reconnect nRFConnect for Mobile and re-subscribe to events):

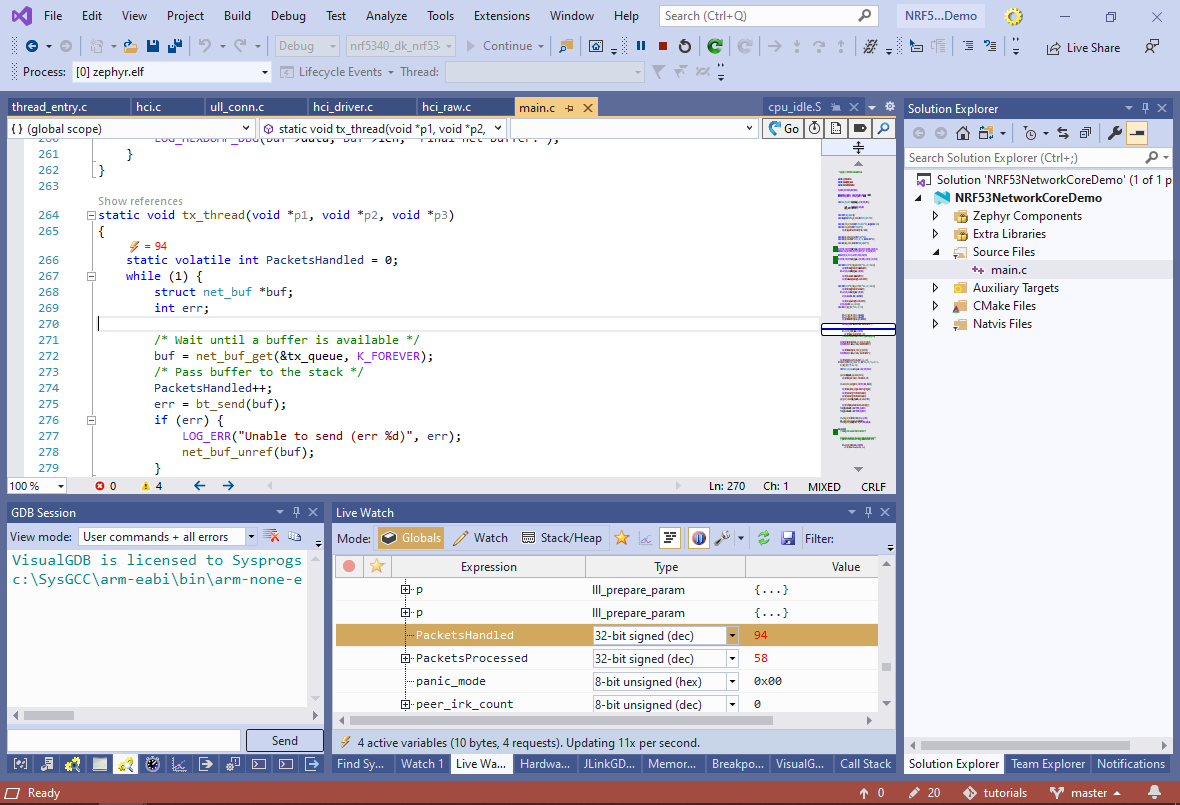
- Start debugging the network core and set a breakpoint in tx_thread() after the call to net_buf_get(). Then, resume the application core’s session. The network core breakpoint will trigger:
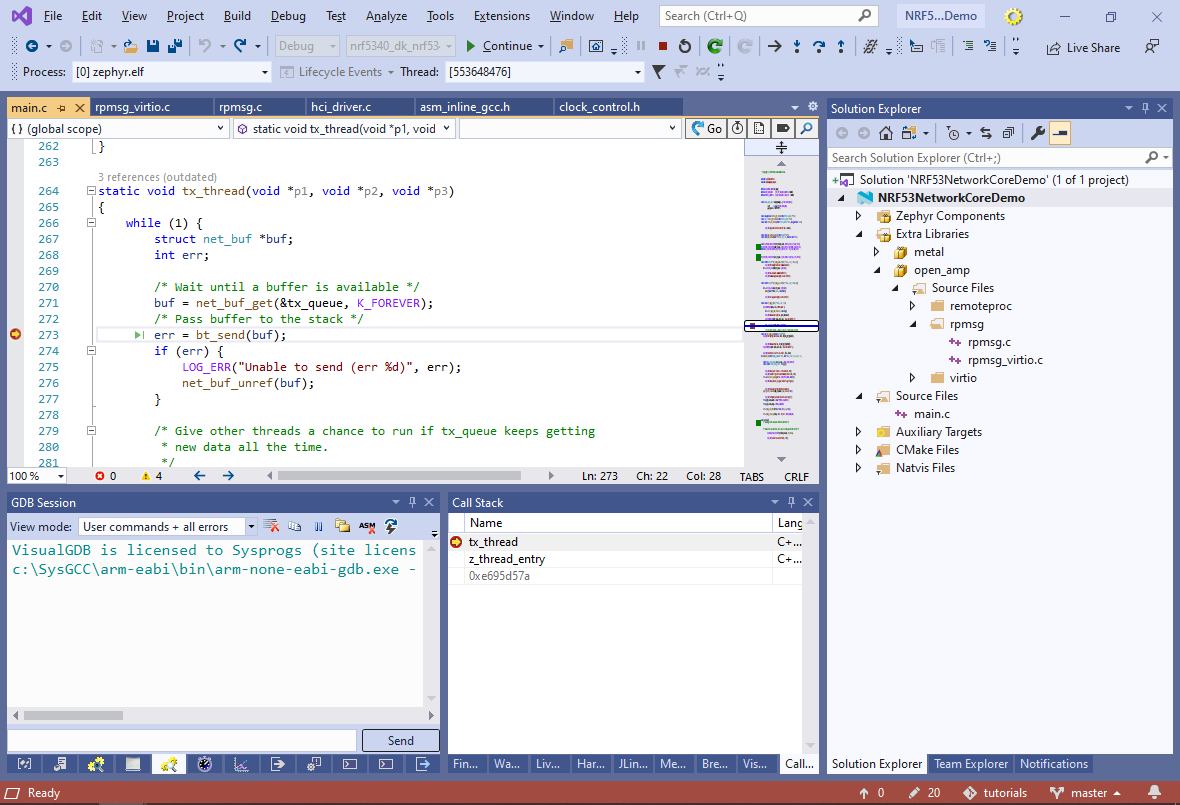 Note that net_buf_get() on the network core corresponds to net_buf_put() called by bt_conn_send_cb() on the application core.
 - You can step into bt_send() to see how the low-level request from the application core gets translated and sent directly to the Bluetooth LE hardware by the network core:
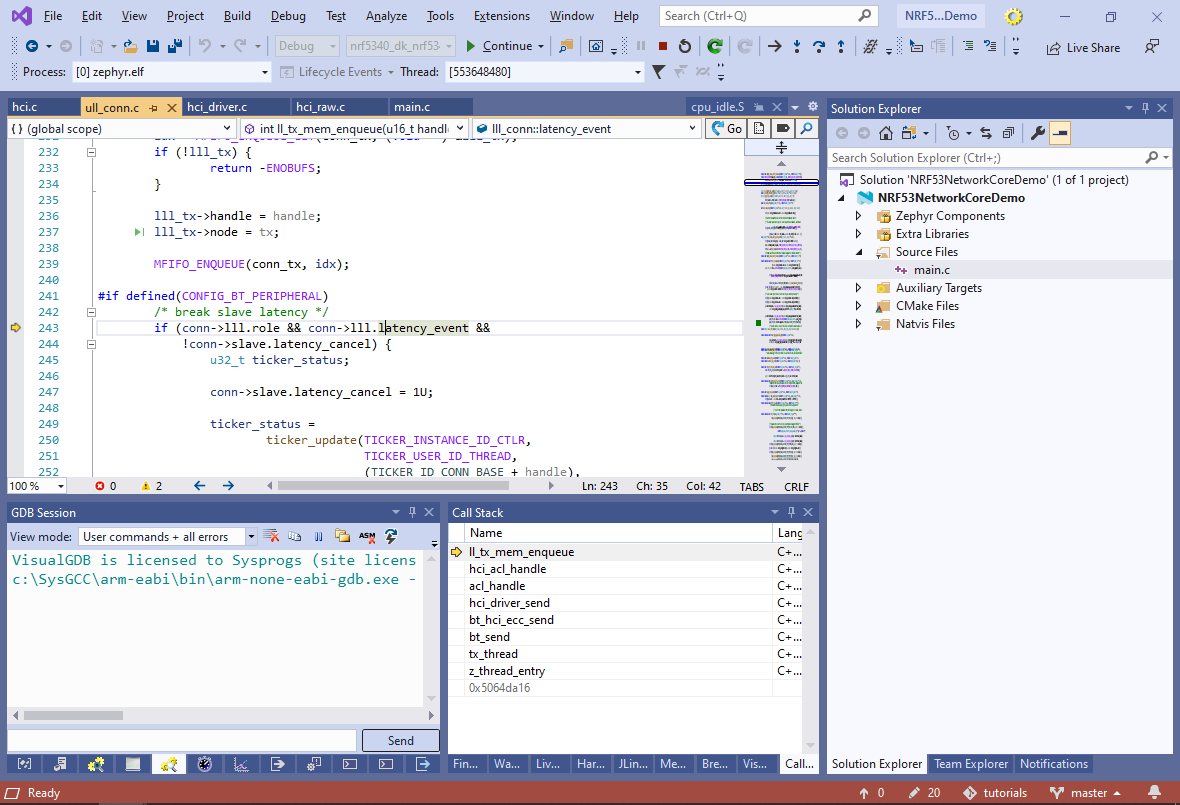
- To minimize Bluetooth LE timeouts, try using counter variables with Live Watch instead of breakpoints on the network core as well. They will show which functions got executed without stopping any of the targets: