Using ST-Link GDB Server to debug STM32 Devices
This tutorial shows how to use the ST-Link GDB server tool instead of OpenOCD in order to program and debug the STM32 devices via ST-Link. We will create a basic application and will show how to configure VisualGDB to run the ST-Link GDB server and connect gdb to it.
Before you begin, install the STM32CubeIDE and locate the following files inside its directory (typically under <STM32CubeIDE directory>\STM32CubeIDE\plugins):
| File | Description |
| ST-LINK_gdbserver.exe | Interfaces the gdb debugger with the STM32Cube Programmer |
| STM32_Programmer_CLI.exe | Provides programmatic access to the ST-Link devices |
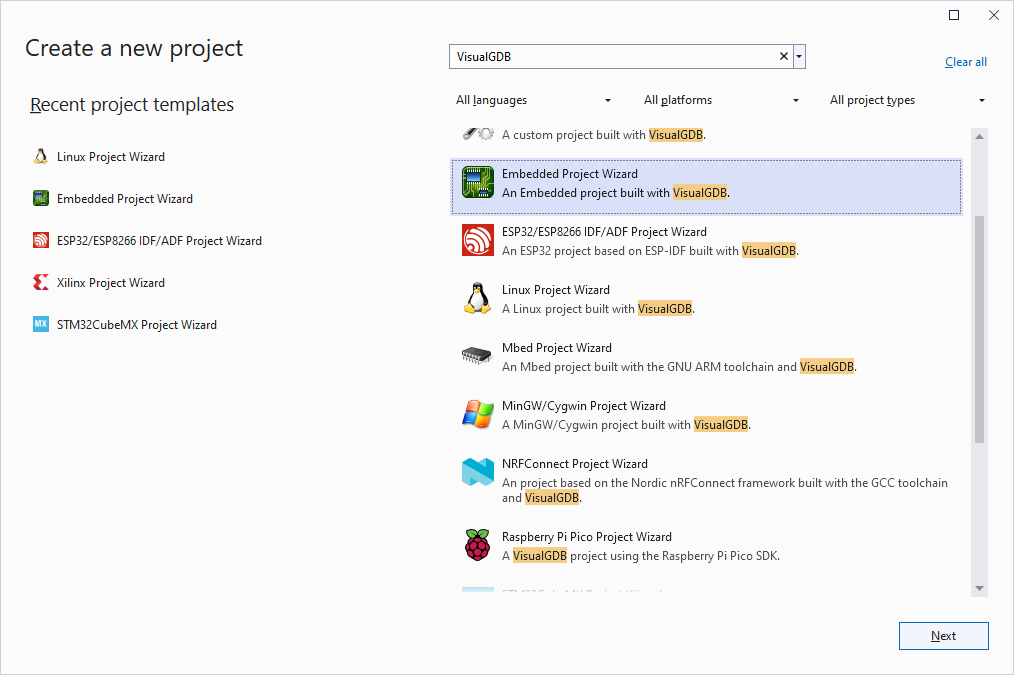
- Start Visual Studio and locate the VisualGDB Embedded Project Wizard:
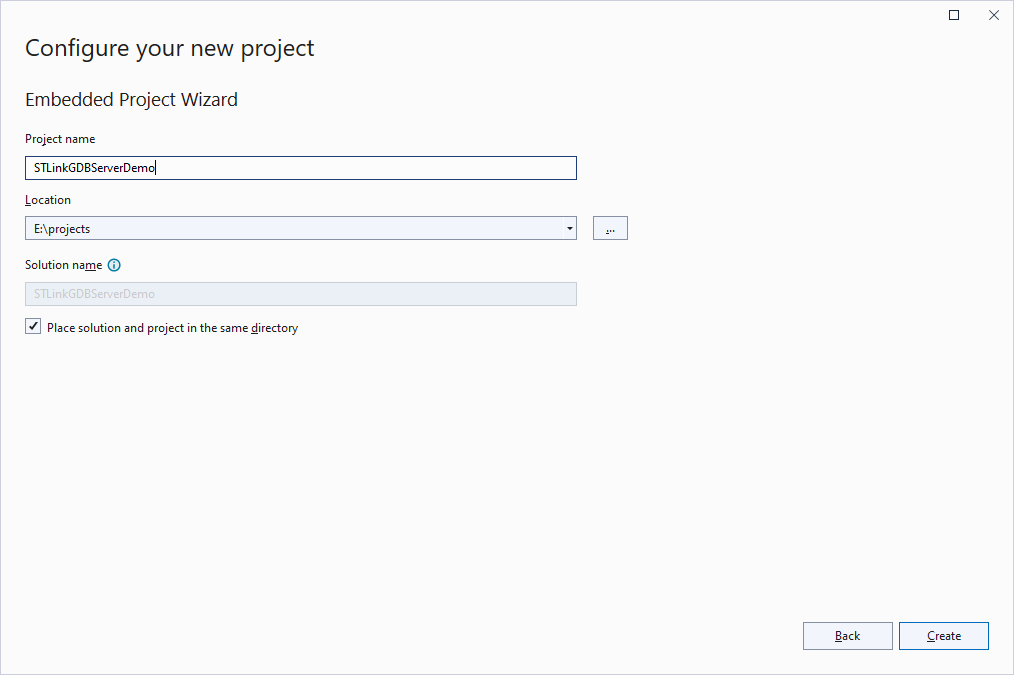
- Enter the name and location for your project:
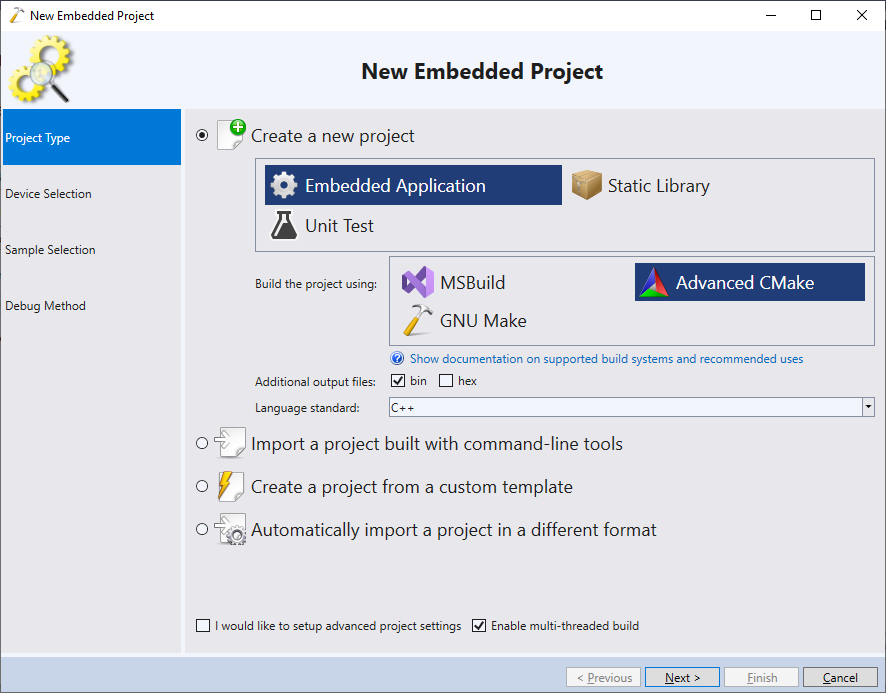
- Select “Create a new project -> Embedded Application“. We recommend using the Advanced CMake for all new projects, however the steps shown in this tutorial will also work for other project types.
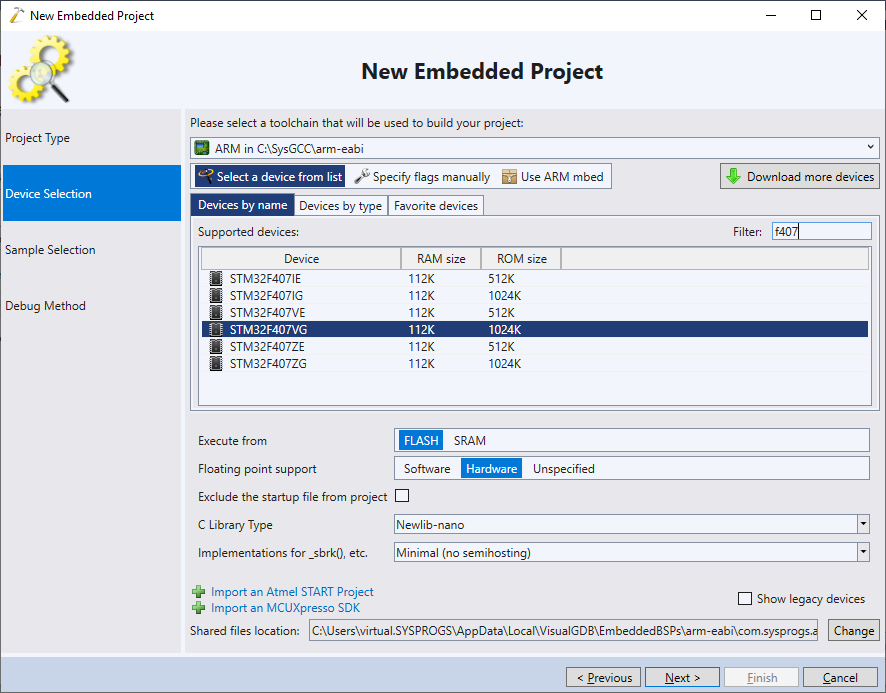
- Select your ARM toolchain and the exact device you would like to target:
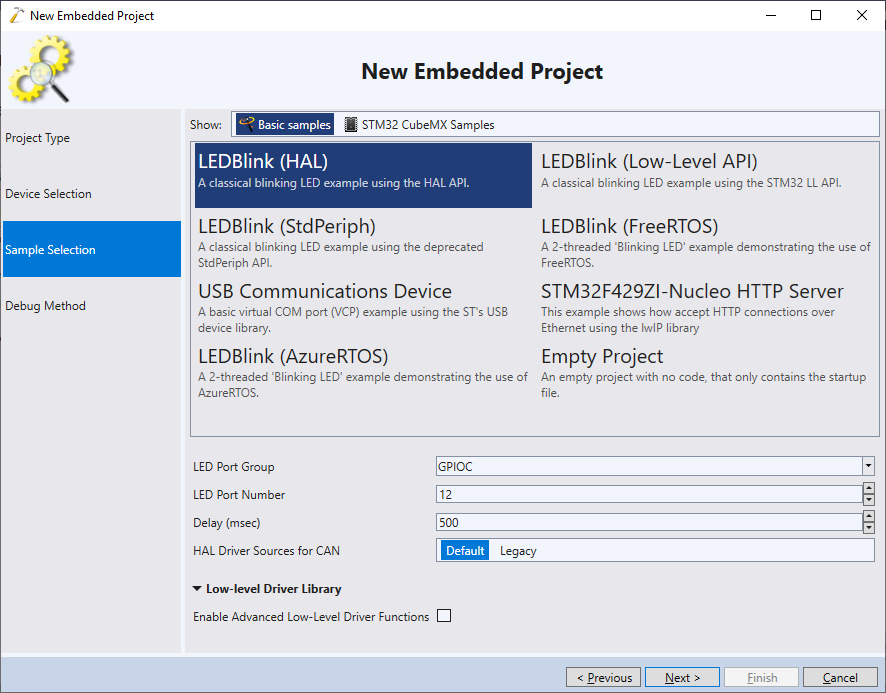
- Pick a project sample that will be cloned and click “Next” to proceed to debug settings:
- The recommended way to debug STM32 devices with ST-Link is using the OpenOCD tool, however it does not always support the latest devices and sometimes doesn’t work in edge cases. So, in this tutorial we will manually use the ST-Link GDB server that is included in the STM32CubeIDE. Switch the “Debug Using” view to “Debug Methods” and select “Custom GDB Stub“. Then enter the following parameters:
Parameter Value Command <full path to ST-LINK_gdbserver.exe> Arguments -p 2000 -d -cp <directory containing STM32_Programmer_CLI.exe> TCP port for GDB 2000 Program FLASH command load 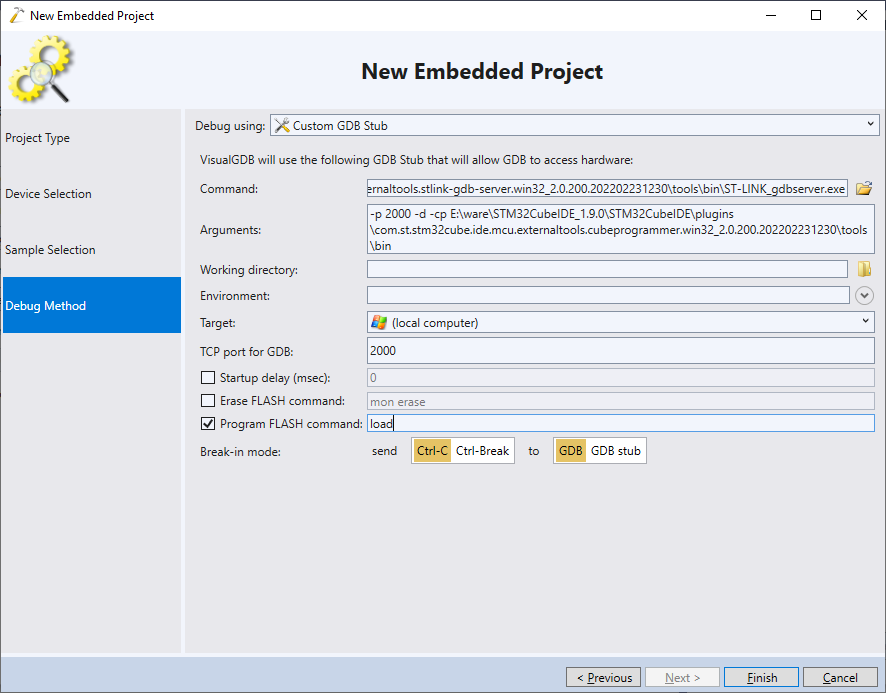 You can also use any other port for gdb, as long as the value in the “TCP port for GDB” field matches the “-p” argument to ST-LINK_gdbserver.exe.
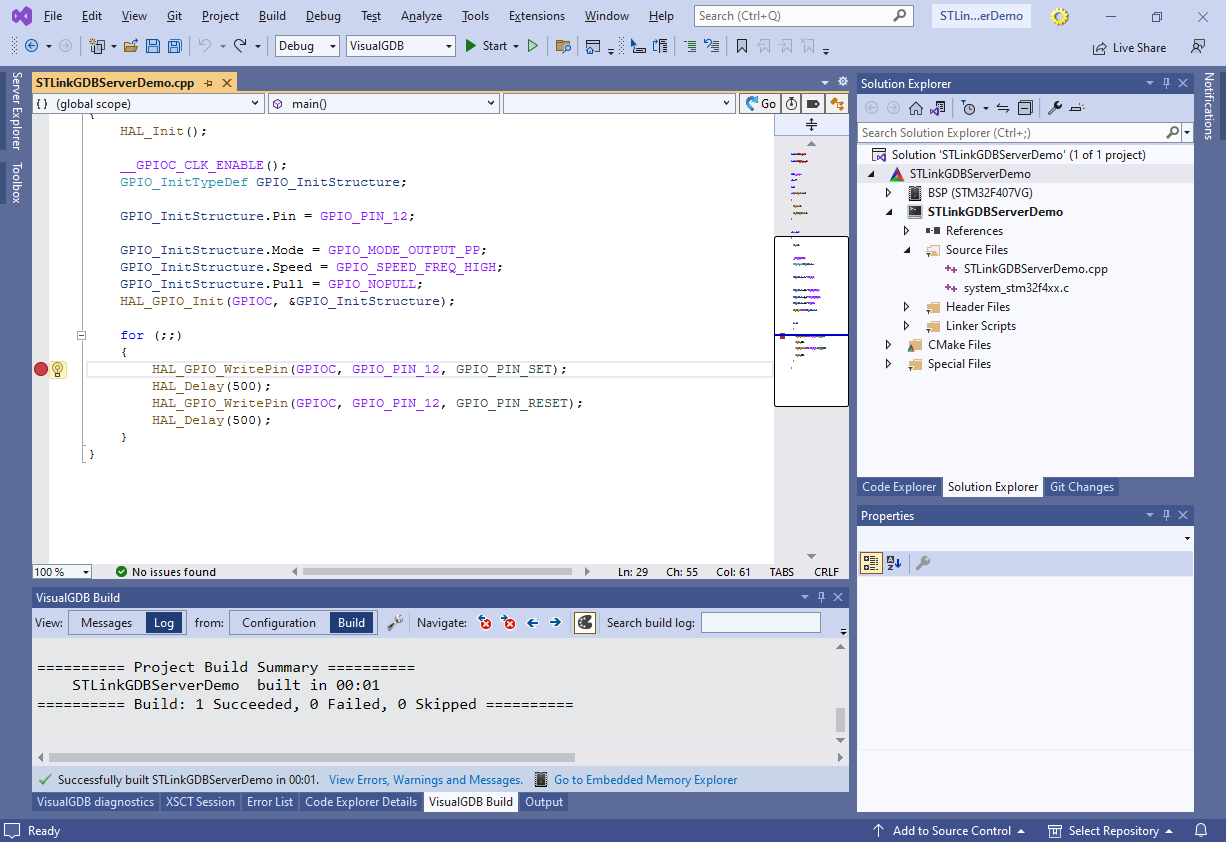
 - Press “Finish” to generate the project. Build it via Build->Build Solution and try setting a breakpoint inside the main loop:
- Press F5 to begin debugging. VisualGDB will launch ST-LINK_gdbserver, display output from it in Debug->Windows->VisualGDB Output, and will automatically connect gdb to it. The FLASH memory will automatically get programmed and the breakpoint will trigger:
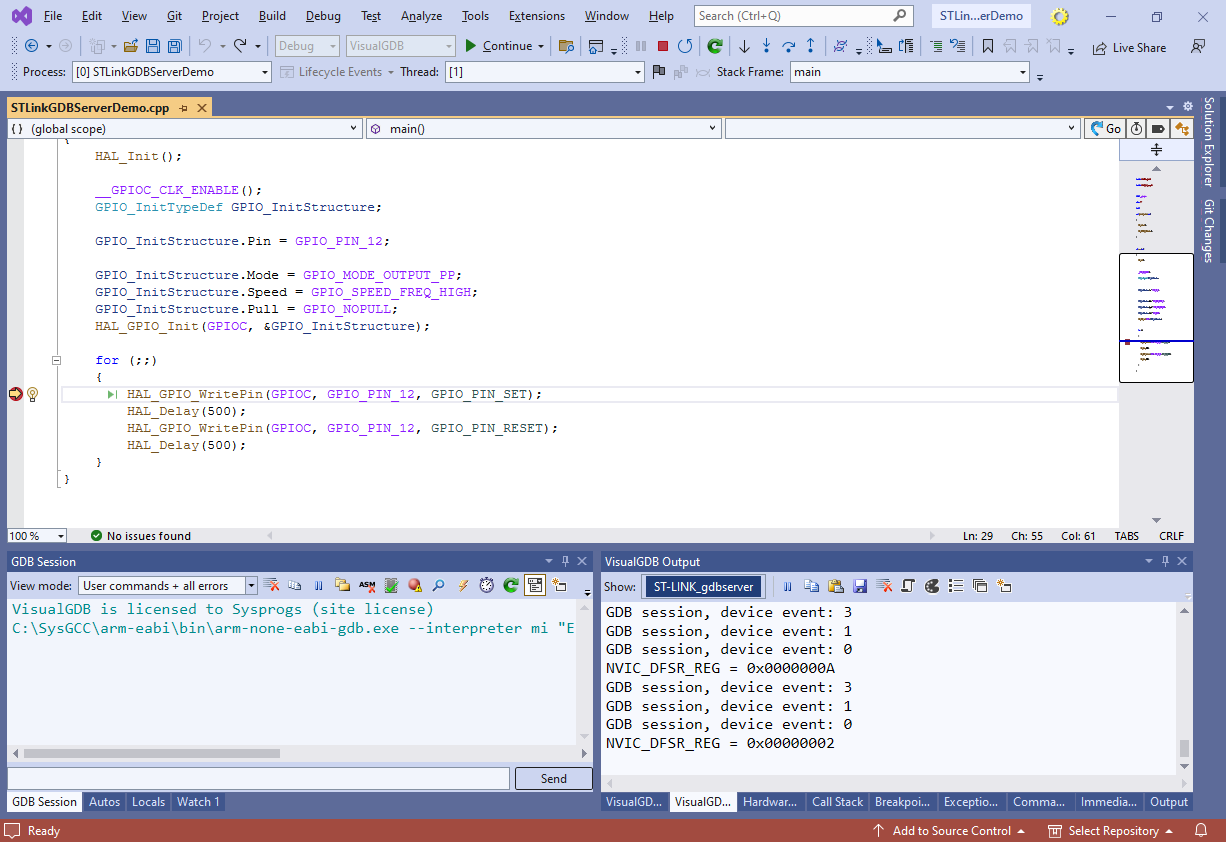
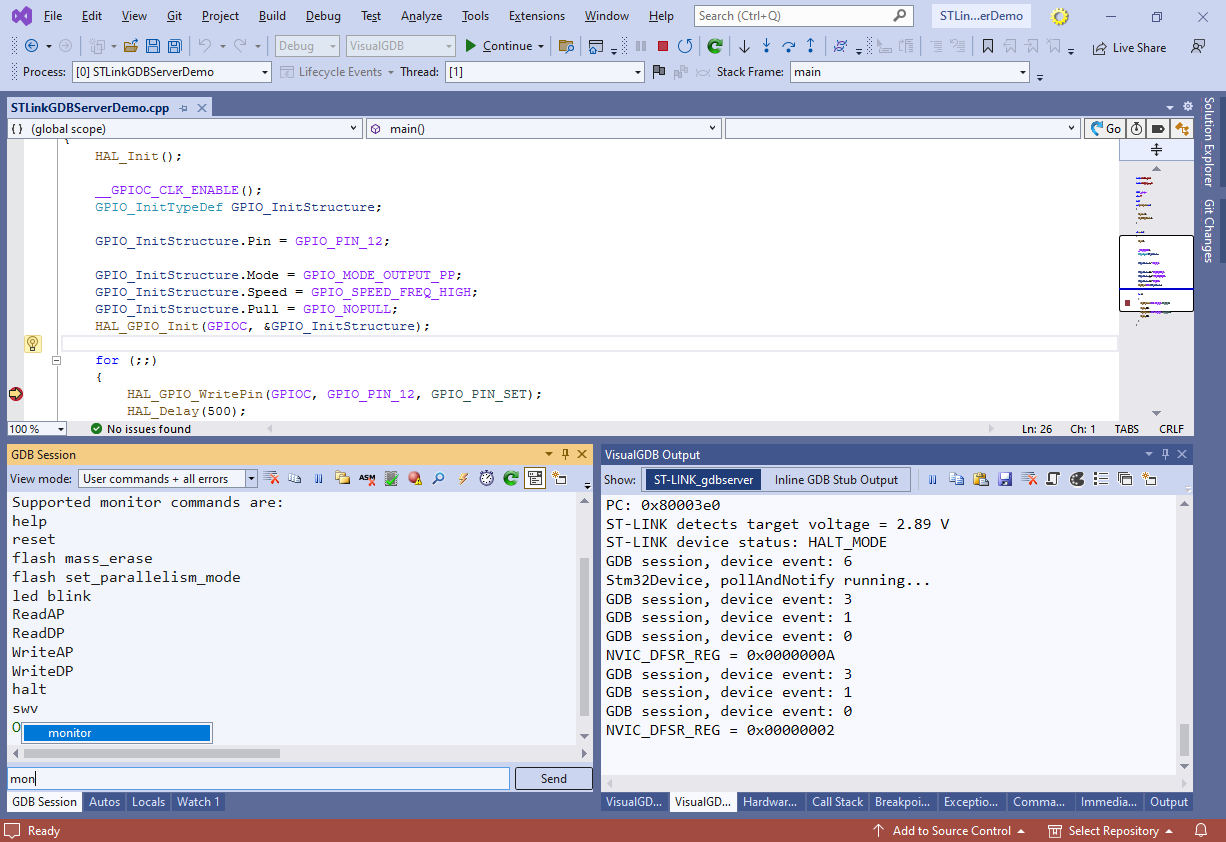
- You can send various raw commands to the ST-LINK_gdbserver by prefixing them with “monitor” in the GDB Session window, e.g. “monitor reset“:
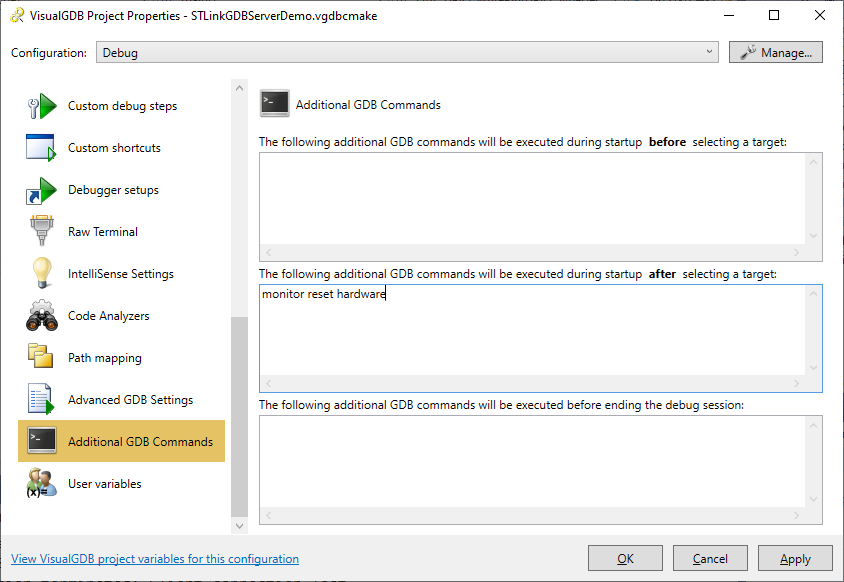
- You can configure VisualGDB to automatically run additional commands at the beginning of each debug session via VisualGDB Project Properties -> AdditionalGDB Commands -> After selecting a target:
Some advanced features (e.g. live memory access) won’t work when using the ST-Link GDB server instead of OpenOCD, however it could be a good workaround for new devices that are not yet supported by OpenOCD, or if OpenOCD doesn’t work as expected.
You can find a detailed reference of the ST-Link GDB Server commands and command-line options in this document.