Developing STM32F7 firmware with Visual Studio and OpenOCD
This tutorial shows how to develop a simple program for the STM32F7 devices using Visual Studio and VisualGDB. Before you begin, install VisualGDB 5.0 or later and ensure that you are using the latest versions of the toolchains and packages:
- ARM GCC 5.2.0 or later
- STM32 package 3.3 or later
- OpenOCD package 0.9.0r2 or later
If you were using VisualGDB before, open Tools->Embedded Tool Manager and update the packages there. Otherwise, you can install the new versions of the packages from the VisualGDB project wizard.
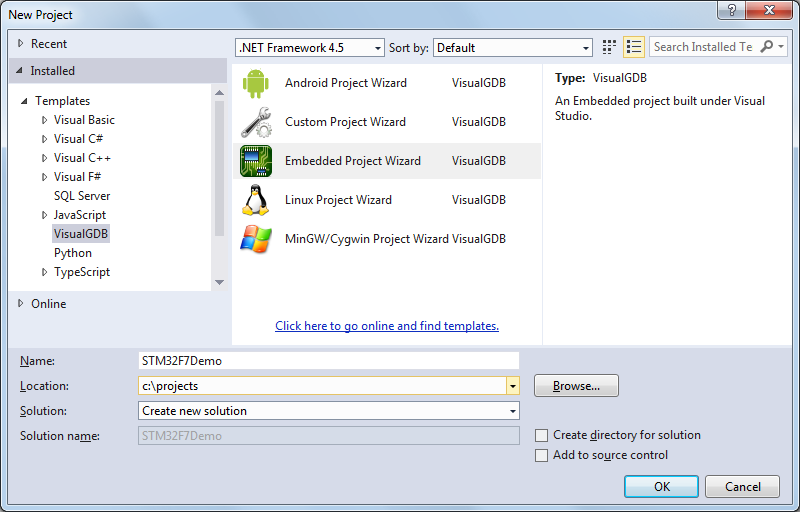
- Start Visual Studio and select the VisualGDB Embedded Project Wizard:
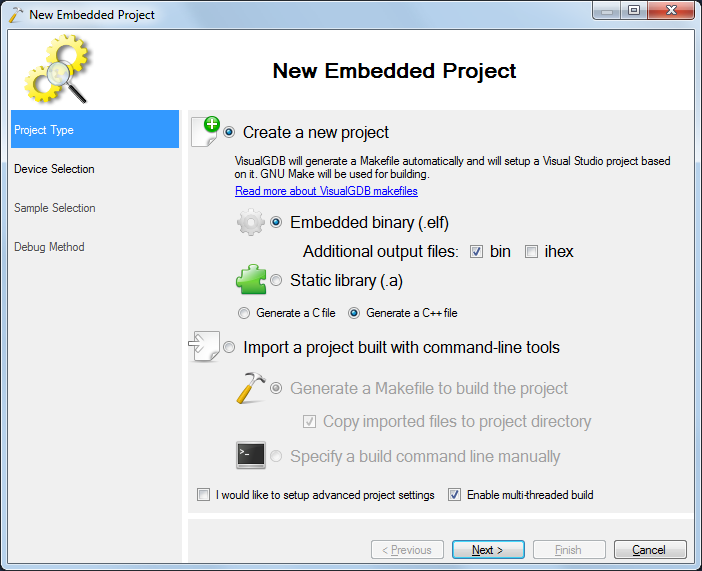
- Proceed with the default “Create a new project” choice:
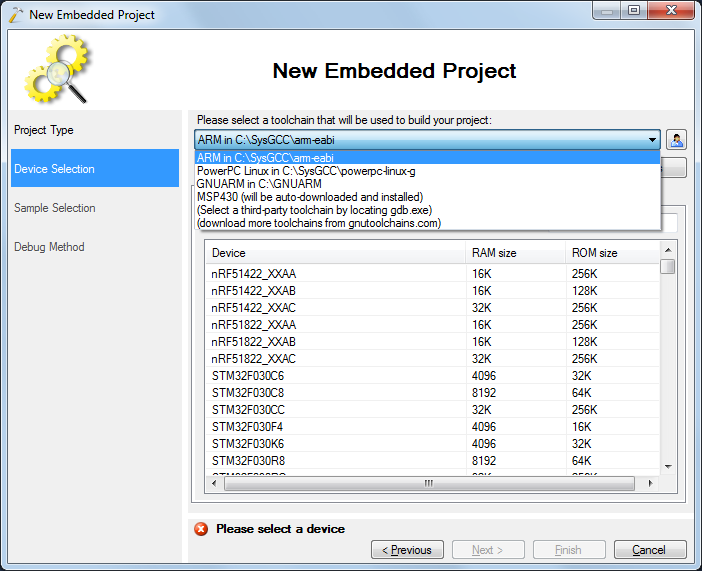
- Select the ARM toolchain. If you don’t have it installed, VisualGDB will automatically download and install it once you select it from the list:
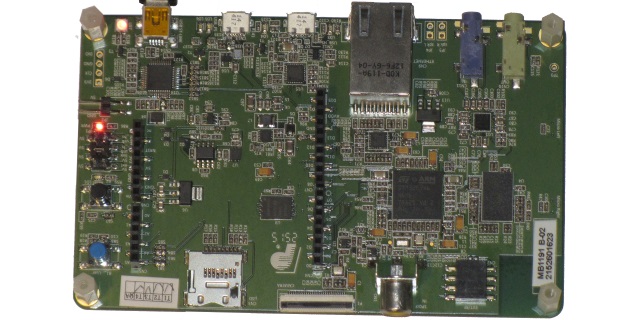
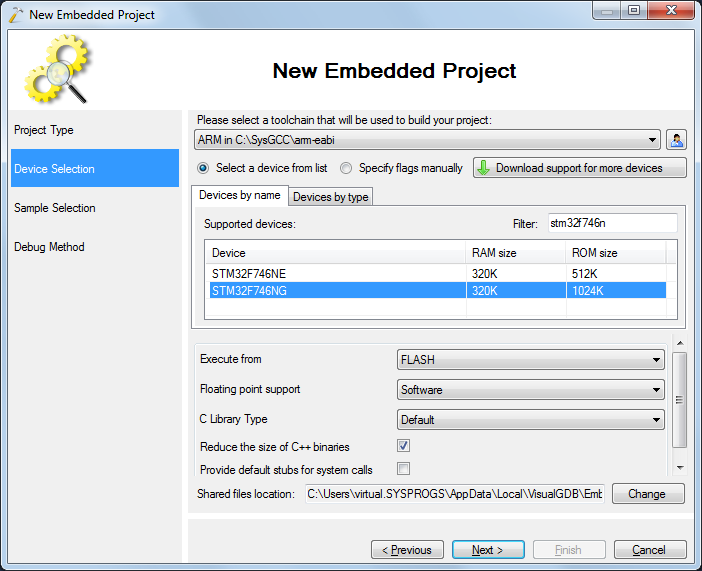
- Locate your device in the device list. We will use the STM32F746NG device on the STM32F7-Discovery board:
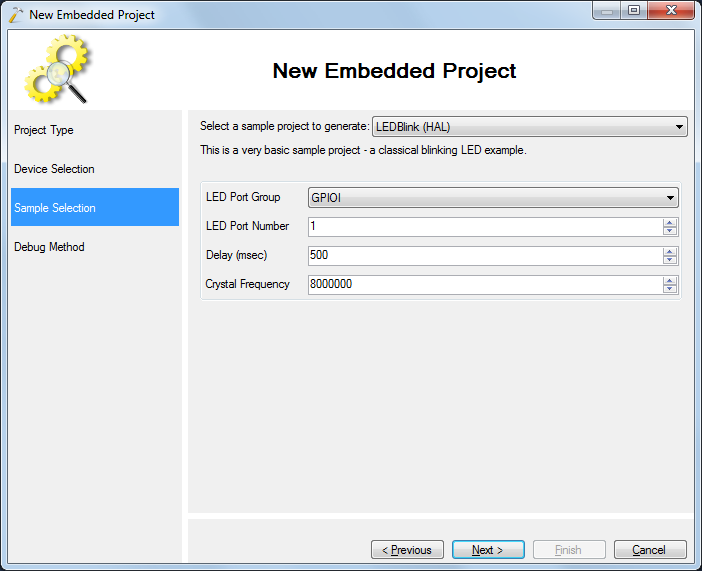
- On the next page select a sample. We will use the most basic “Blinking LED” sample. According to the STM32F7-Discovery schematics, an LED is connected to GPIOI1. Specify this on the Sample Selection page:
- Select OpenOCD as the debugging method. If you have already connected the STM32F7-Discovery board, VisualGDB will recognize it and select the ST-Link interface automatically. Otherwise you can select it manually or click “Detect”:
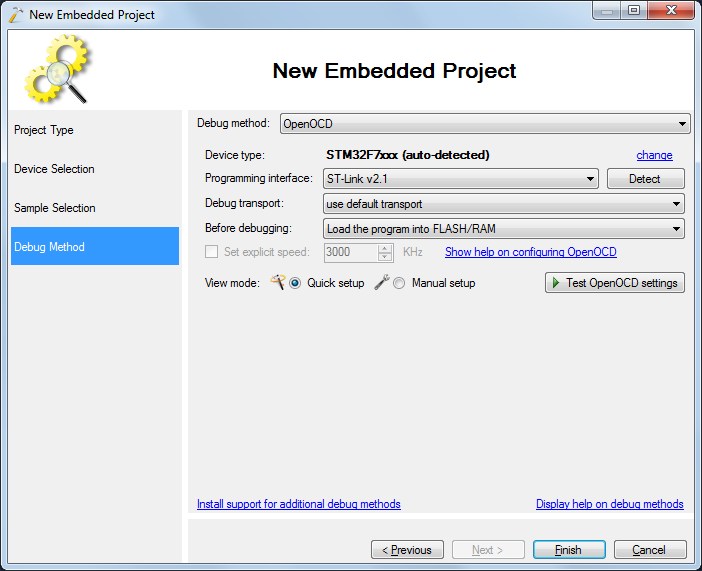
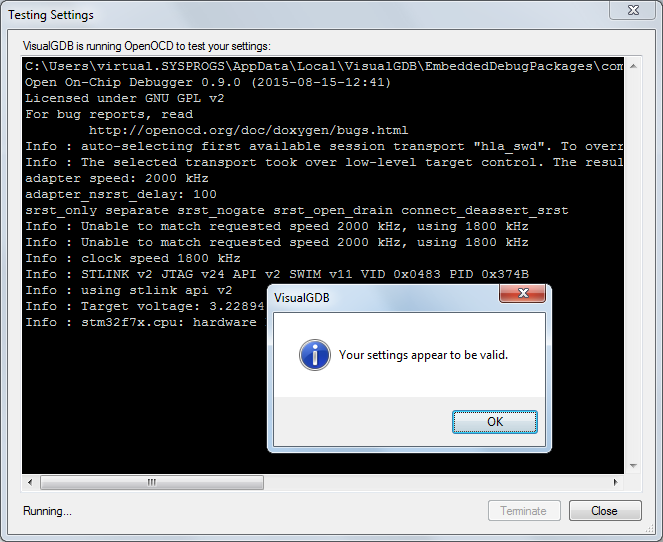
- Click “Test OpenOCD Settings” to ensure that OpenOCD can connect to ST-Link and all necessary drivers are installed:
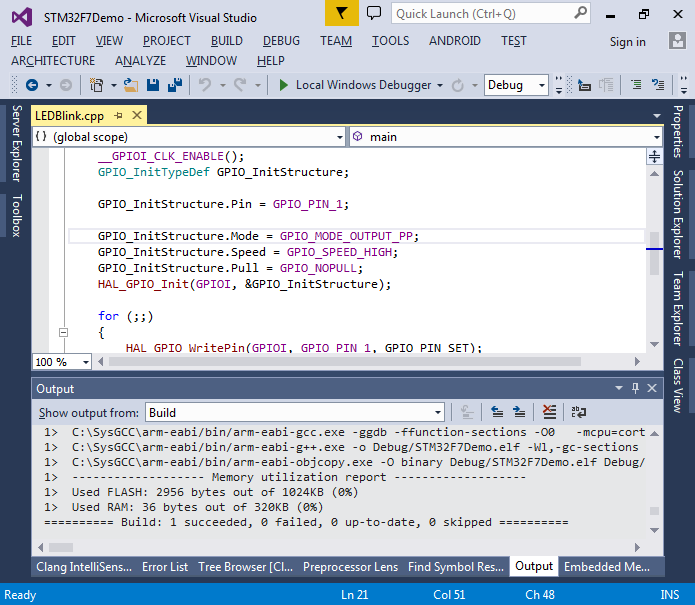
- Press Finish in the wizard to complete the creation of the project. Build it with Ctrl-Shift-B:
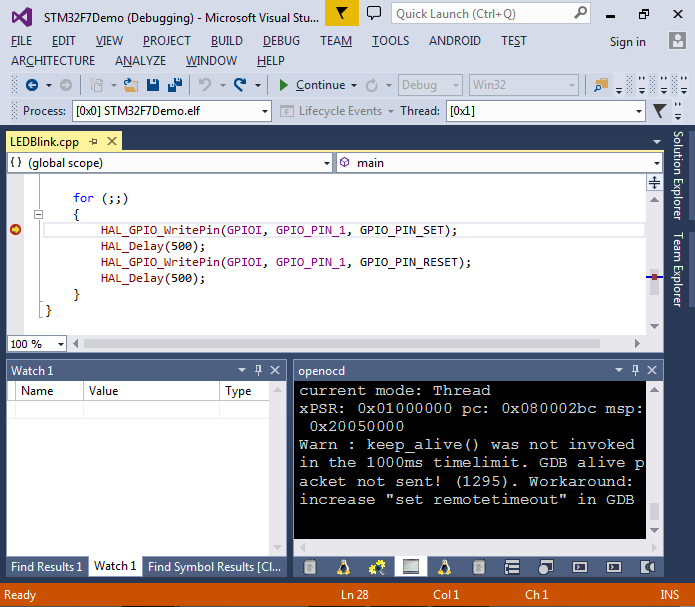
- Set a breakpoint on the call to HAL_GPIO_WritePin() and press F5 to start debugging:
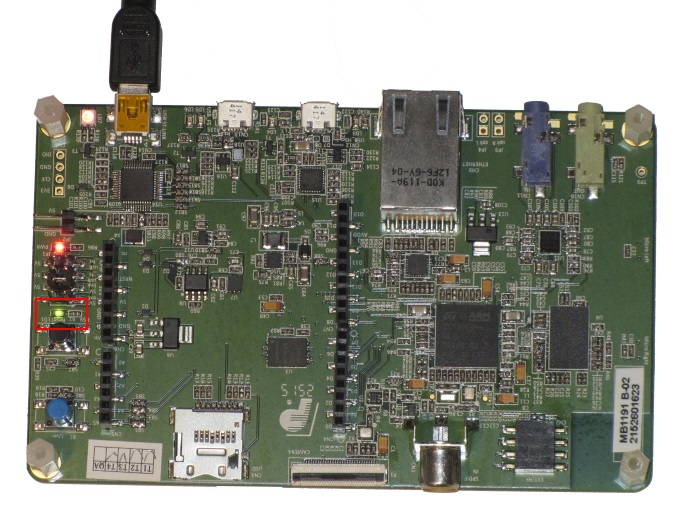
- When the breakpoint is hit, look at the board and note that no LEDs except the power indicator are on:
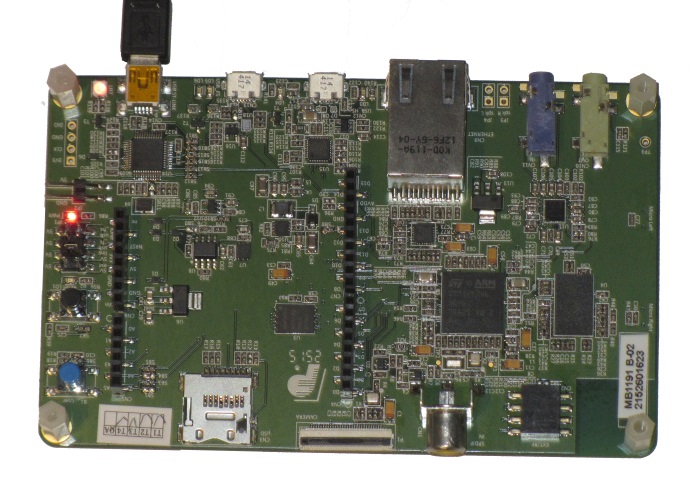
- Step over the call to HAL_GPIO_WritePin() and observe how an LED turns on:
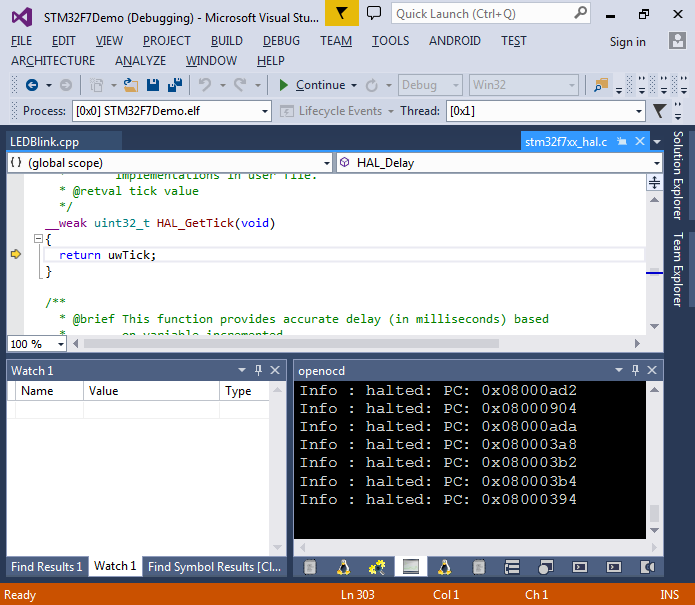
- Now step into the HAL_Delay() function and again into HAL_GetTick(). Observe that the tick count is stored in the global uwTick variable:
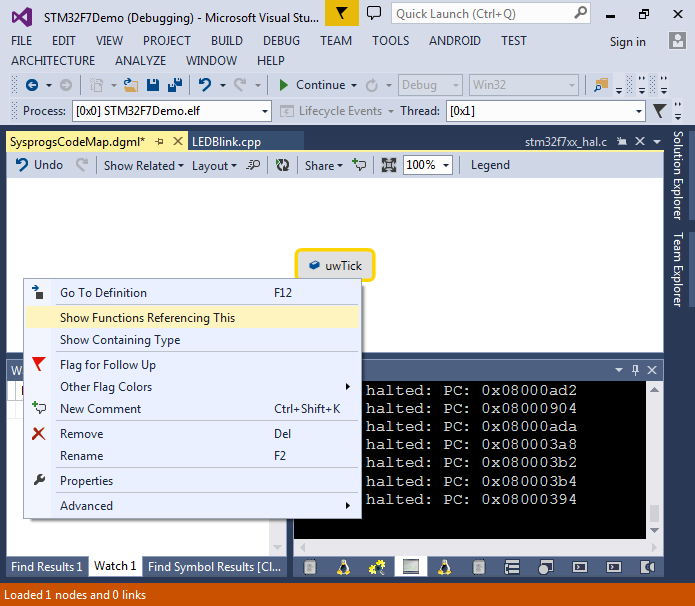
- Add it to Code Map via context menu and look for functions referencing it:
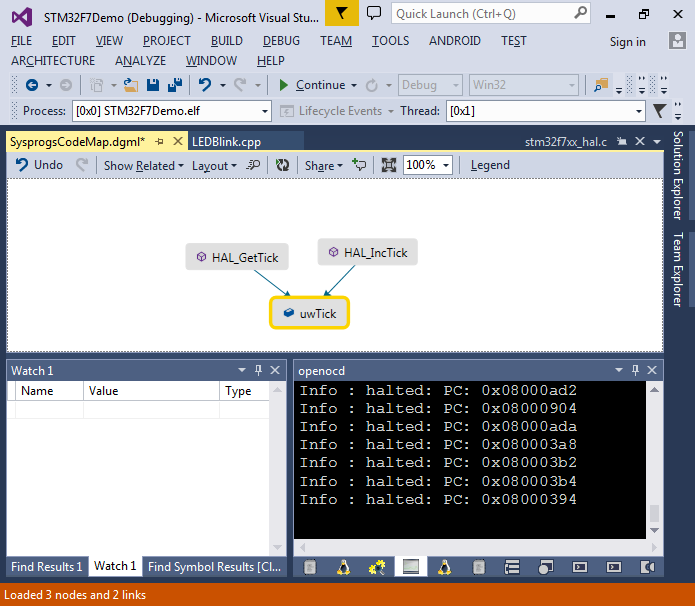
- You will see that it is used modified by HAL_IncTick() function:
- Now we will observe how the value of uwTick changes over time. Open the Live Variables window via Debug->Windows,add uwTick there and enable plotting:
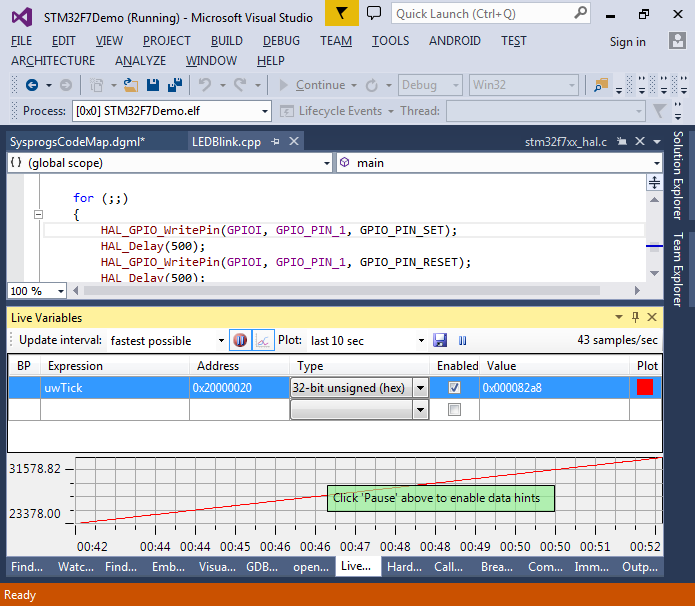
- You can click the Pause icon to freeze the graph and explore the values. Ensure that the value goes up by 1000 roughly each second:
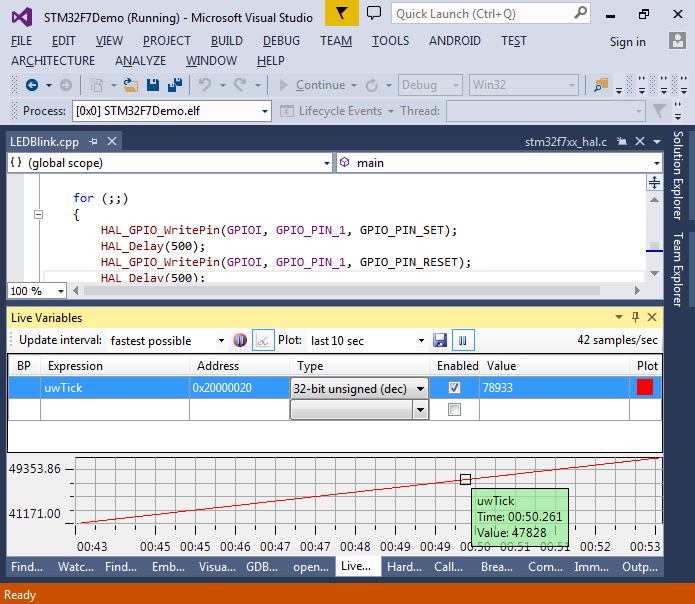 Note that polling the values may have a latency of a few milliseconds, so don’t expect microsecond precision in the graph.
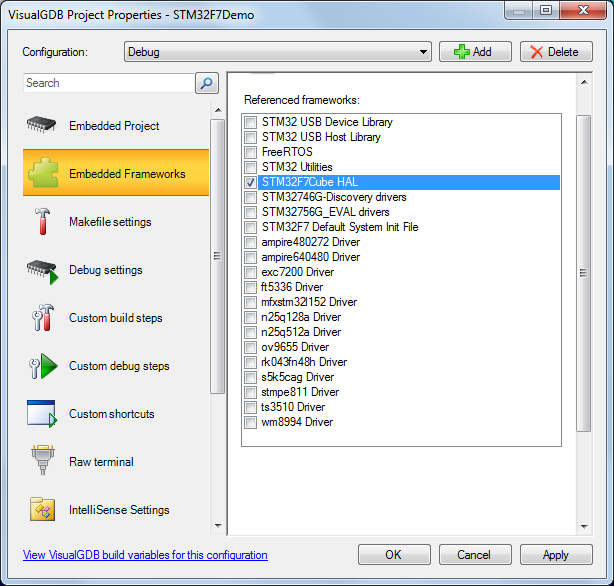
 - You can now stop debugging and open VisualGDB Project Properties on the Embedded Frameworks page to add/remove references to various STM32F7 frameworks (e.g. the STM32 USB library):