Creating Unit Tests for ESP32 Projects with ESP-IDF
This tutorial shows how to create, manage and debug unit tests for ESP32-based projects with Visual Studio and VisualGDB.
We will create a basic “Blinking LED” project based on the ESP-IDF framework and will show how to add unit tests to each of its components and how to manage them via the Visual Studio’s test explorer. Before you begin, install VisualGDB 5.5 or later and make sure you are using the Custom Edition or higher.
If you would like to add unit tests to an existing project, we recommend following this tutorial first to make sure the test functionality works with your setup. Once you complete this tutorial, you can apply steps starting from step #7 to add unit tests to your existing project.
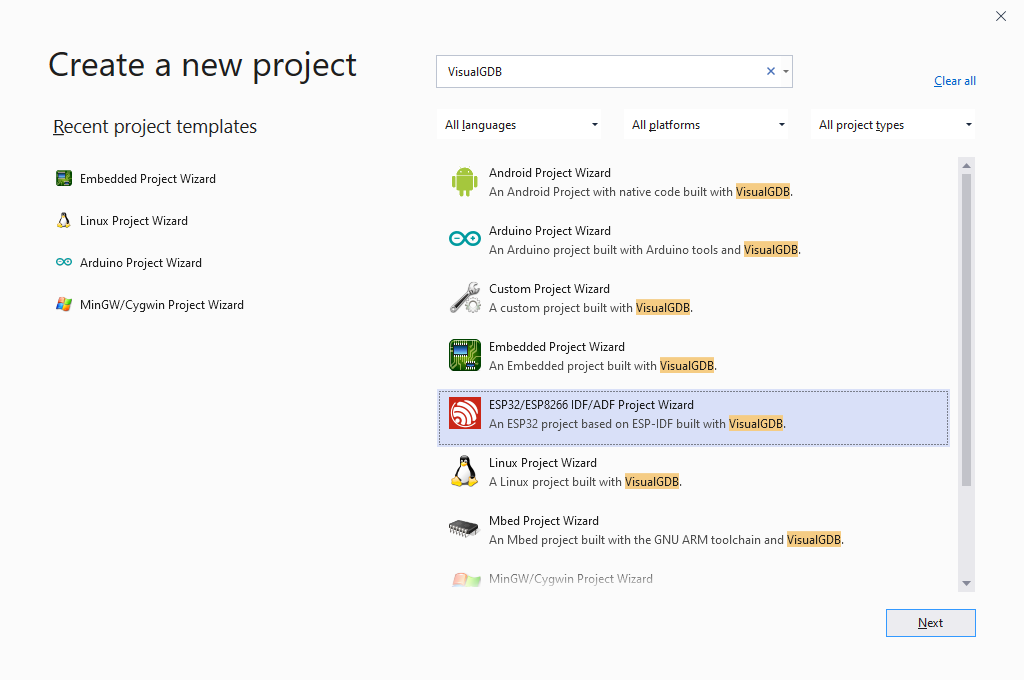
- We will begin with creating a basic project using the VisualGDB’s ESP-IDF Project Wizard. Locate the wizard in your Visual Studio and click Next to start creating a new project:
- Pick a name and location for your project and click “Create“:

- Make sure that you have selected CMake on the first page of the VisualGDB’s part of the wizard and click “Next”:
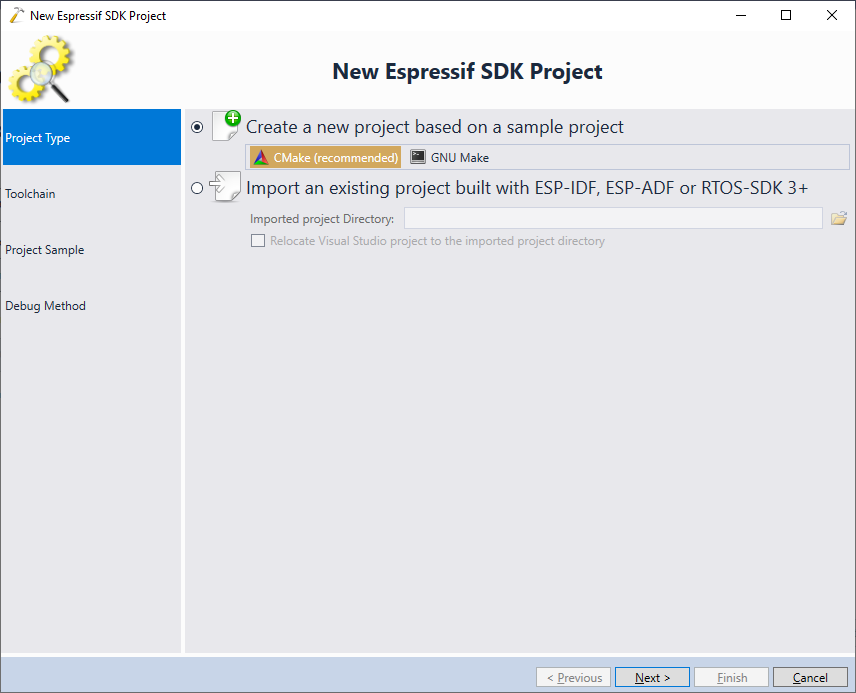 Warning! VisualGDB does not support unit tests for legacy GNU Make-based ESP-IDF project. If you are using GNU Make, please update your project to use CMake instead.
- On the next page of the wizard select your ESP32 toolchain and an ESP-IDF checkout you would like to use:
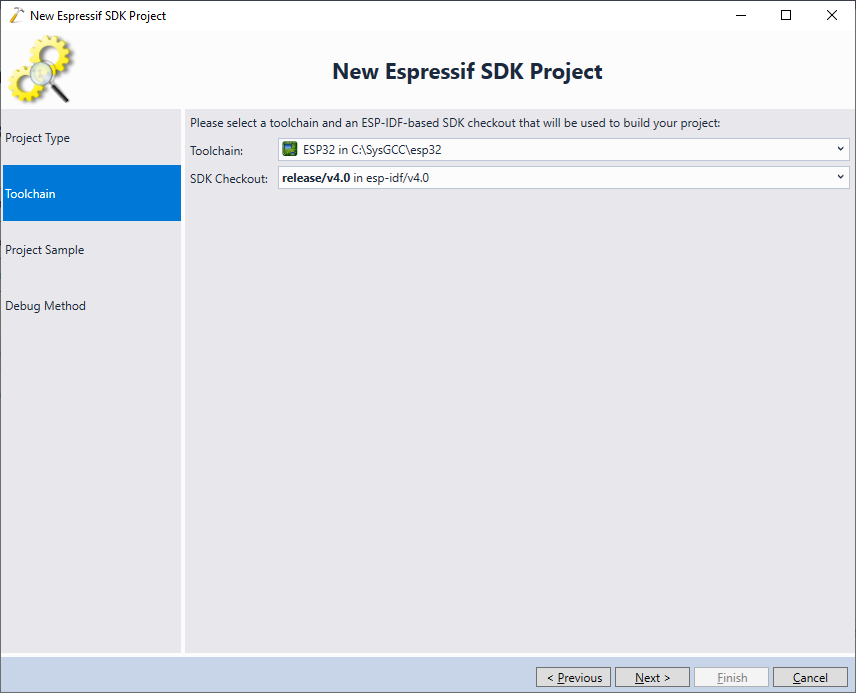 Update: For better compatibility with the latest ESP32 tools, we recommend selecting the consolidated toolchain instead.
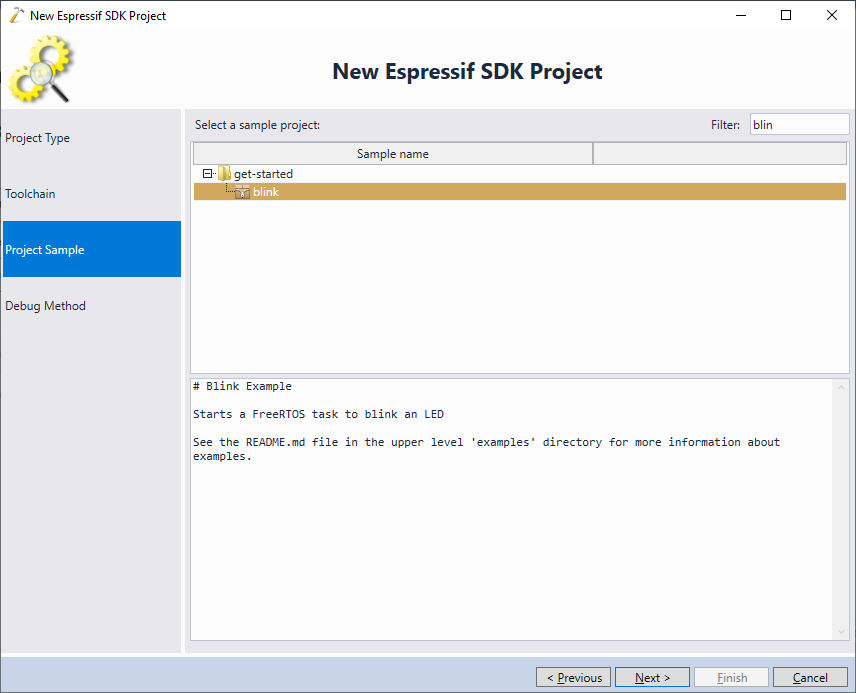
 - Next, pick the sample you would like to clone. In this project we will clone the simplest “blink” sample:
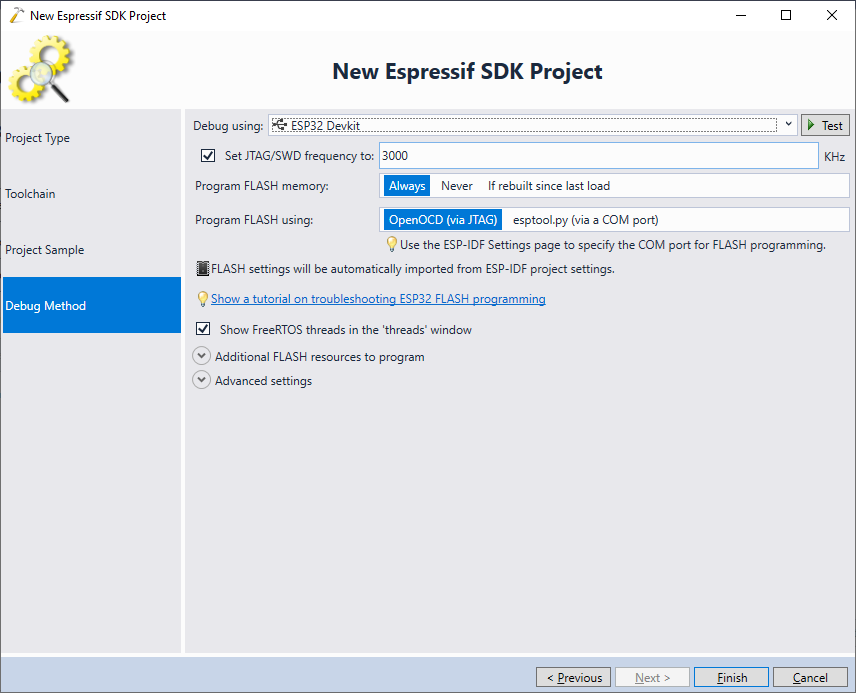
- Finally, pick the debug settings that work with your setup. You can test them by pressing the “Test” button in the wizard:
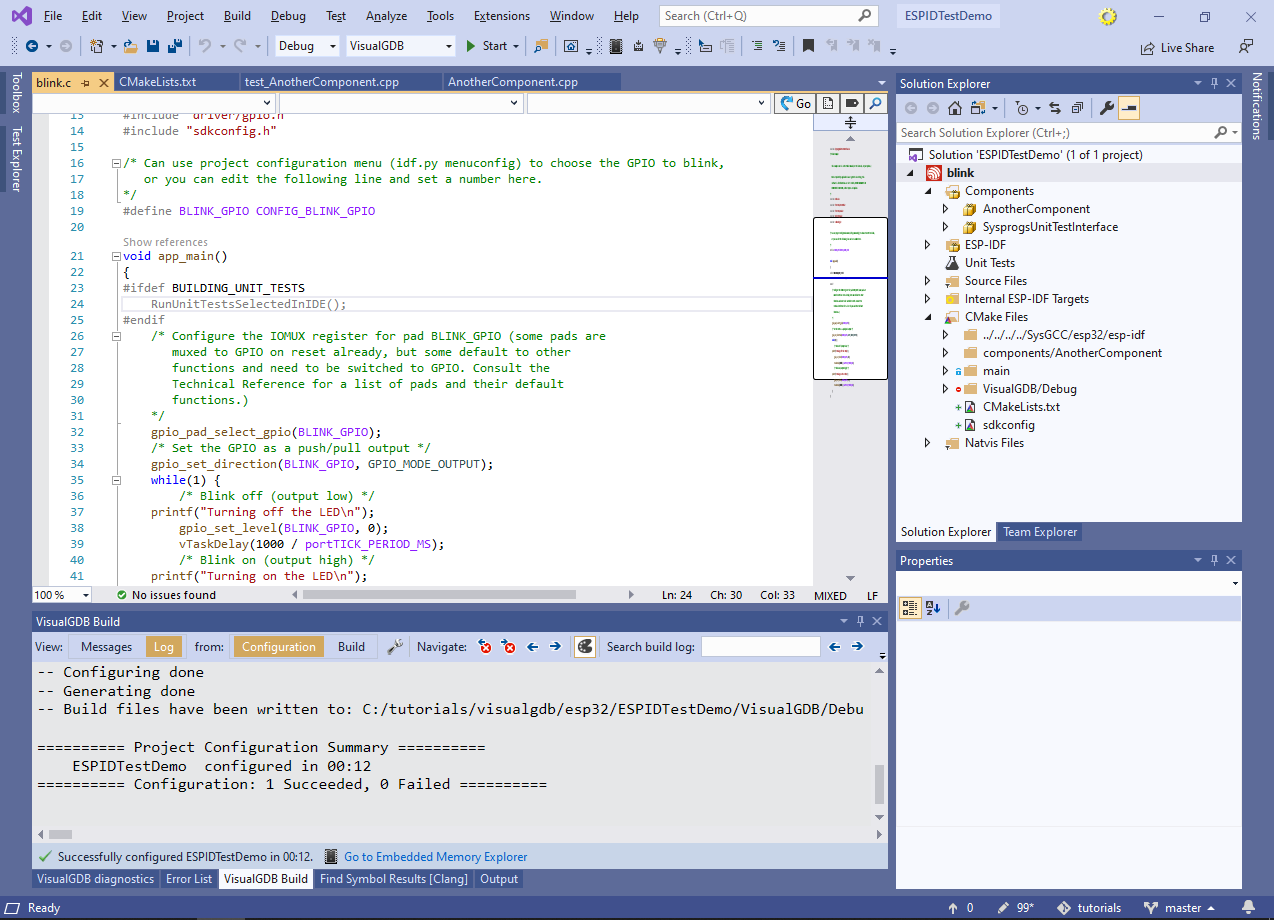
- Click “Finish” to generate a basic project. Once it is created, build it to make sure everything is in order. Then locate the “Unit Tests” node in Solution Explorer, right-click on it and pick “Enable Building of Unit Tests for the Project”:
 ESP-IDF allows defining tests for each of the project’s components (including the main component that is blended with the project itself in Solution Explorer). The tests are implemented via separate pseudo-components that must be explicitly enabled when configuring the project. VisualGDB handles this by creating special test configurations: Tests (Debug) and Tests (Release) that are independent of the regular Debug and Release configurations. When you build a test configuration (e.g. Tests (Debug)), VisualGDB will automatically configure ESP-IDF to enable the tests for your project. When you switch to the regular Debug configuration, the tests will be disabled.
 - If this is the first time you are adding unit tests to the project, VisualGDB will check if the project needs any configuration changes before the tests can be run and will suggest applying them automatically. Press “Yes” to continue:
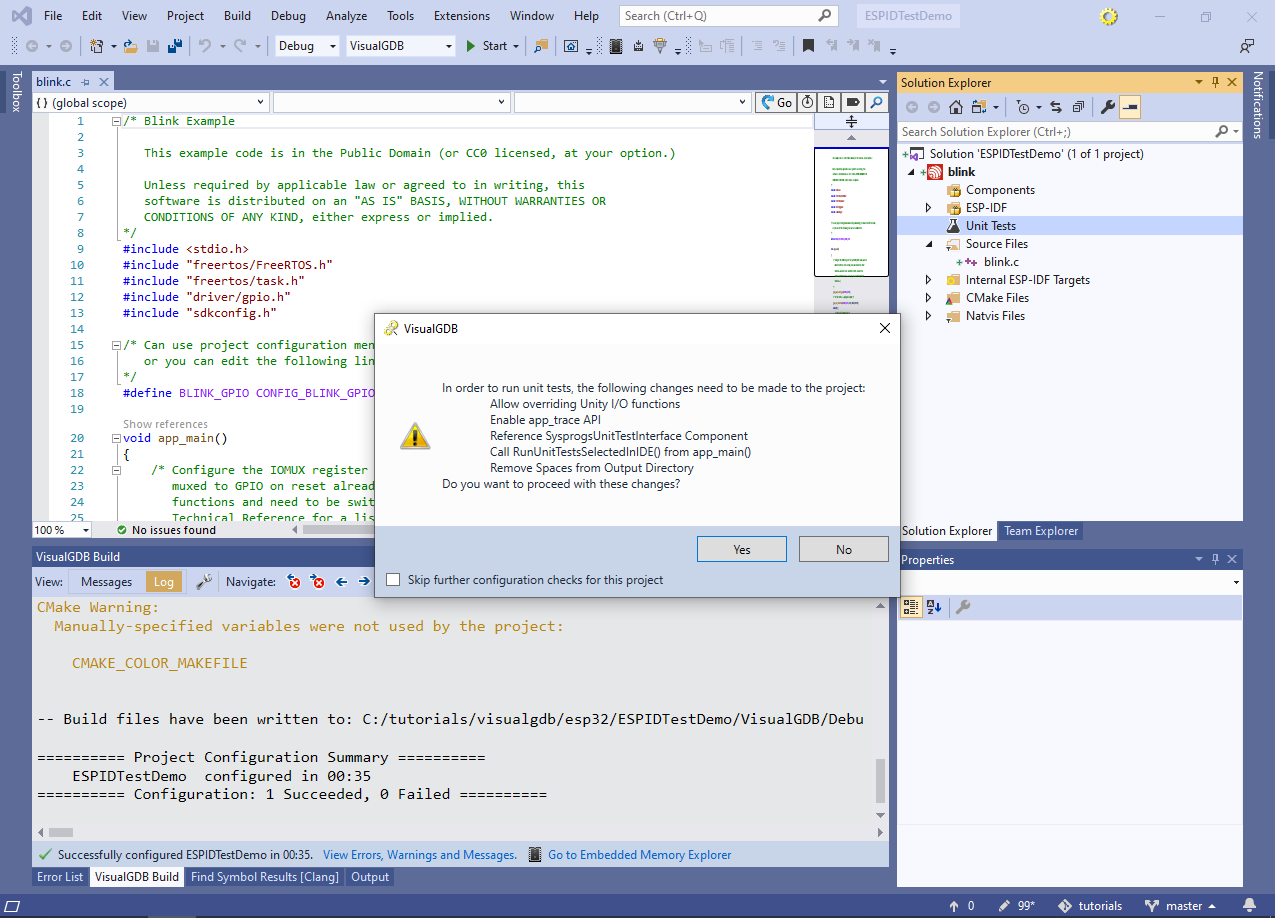 This will apply the following changes to your project and ESP-IDF:
- VisualGDB will locate the unity_putc() and unity_flush() functions in <ESP-IDF>\components\unity\unity_port_esp32.c and will mark them with __attribute__((weak)). This is necessary because the regular versions of those functions output the test results into the COM port (requiring a separate connection), and VisualGDB provides an alternative implementation of them that outputs test results directly via JTAG. Since the original implementations will be still in place (albeit marked weak), that this will only affect VisualGDB-based projects and only when using test configurations.
- If your project is not configured to use app_trace (mechanism for outputting text to the debugger via JTAG), VisualGDB will automatically enable it. This is equivalent to opening VisualGDB Project Properties and setting ESP-IDF Configuration -> Application Level Tracing -> Data Destination = Trace memory.
- The code responsible for running tests selected via the Visual Studio’s test GUI is located in the SysprogsUnitTestInterface component shipped with VisualGDB. To make sure it gets included into the project, VisualGDB will copy it into your ESP32 toolchain (ESP-IDF requires it to be a path without spaces) and will add a reference to it to CMakeLists.txt (see this file for an example). Note that the SysprogsUnitTestInterface component will only affect the project when you are building the test configuration.
- In order to actually run the tests instead of the main application, the app_main() function needs to call RunUnitTestsSelectedInIDE() provided by the SysprogsUnitTestInterface component. RunUnitTestsSelectedInIDE() will automatically launch the tests selected via the Test Explorer window, or will return immediately back into app_main() run if you are running a regular debug session.
- As the ESP-IDF does not support paths with spaces, the project output folder will need to be changed from Test (Debug) to Test__Debug_. VisualGDB will do it automatically by replacing $(ConfigurationName) with $(ConfigurationName.defuse) in the “CMake Project Settings -> Binary Directory” setting.
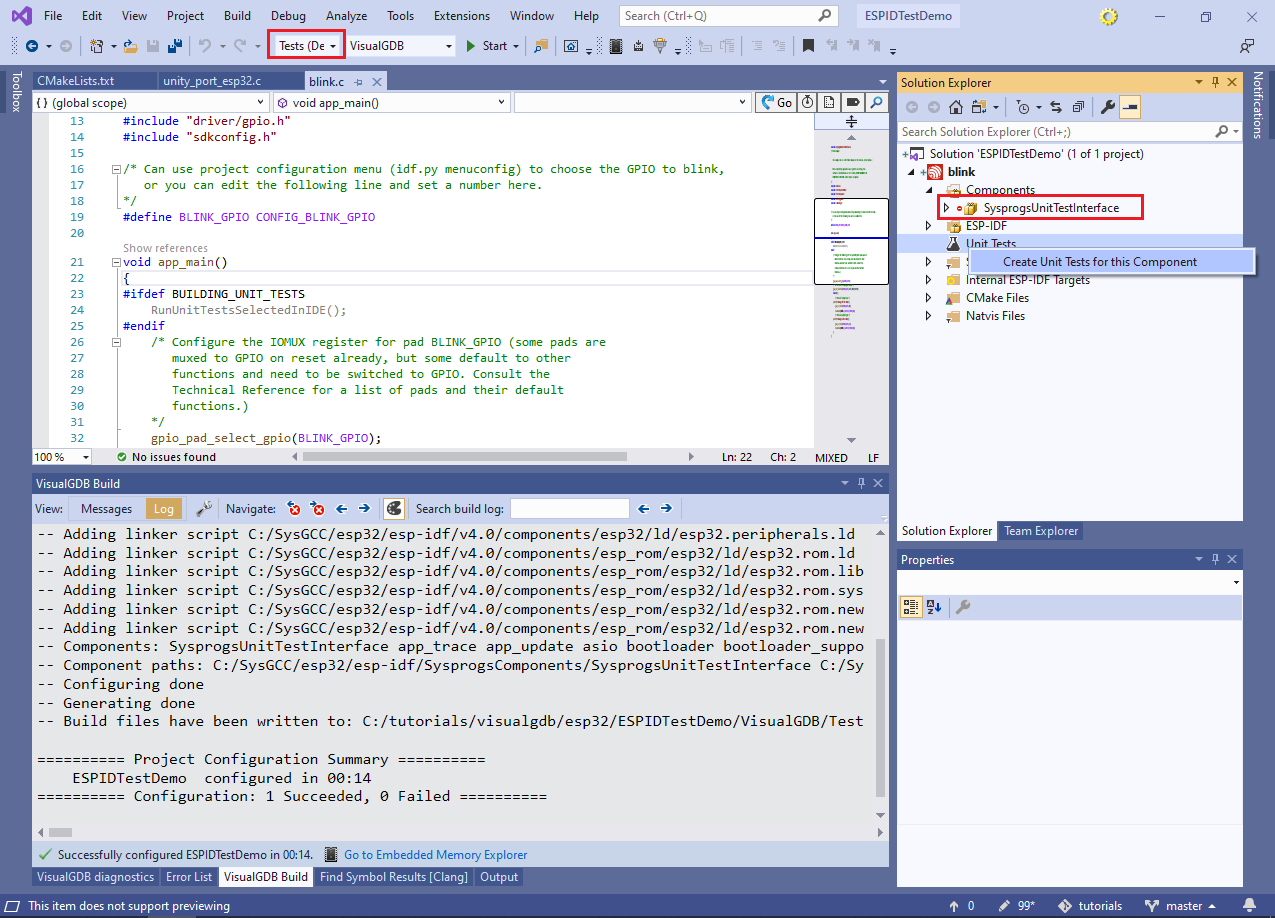
- Once the project has been updated, note how the active configuration switched to Tests (Debug) and the SysprogsUnitTestInterface component appeared under the Components node. Now you can right-click on the Unit Tests node again to create unit tests for your component:
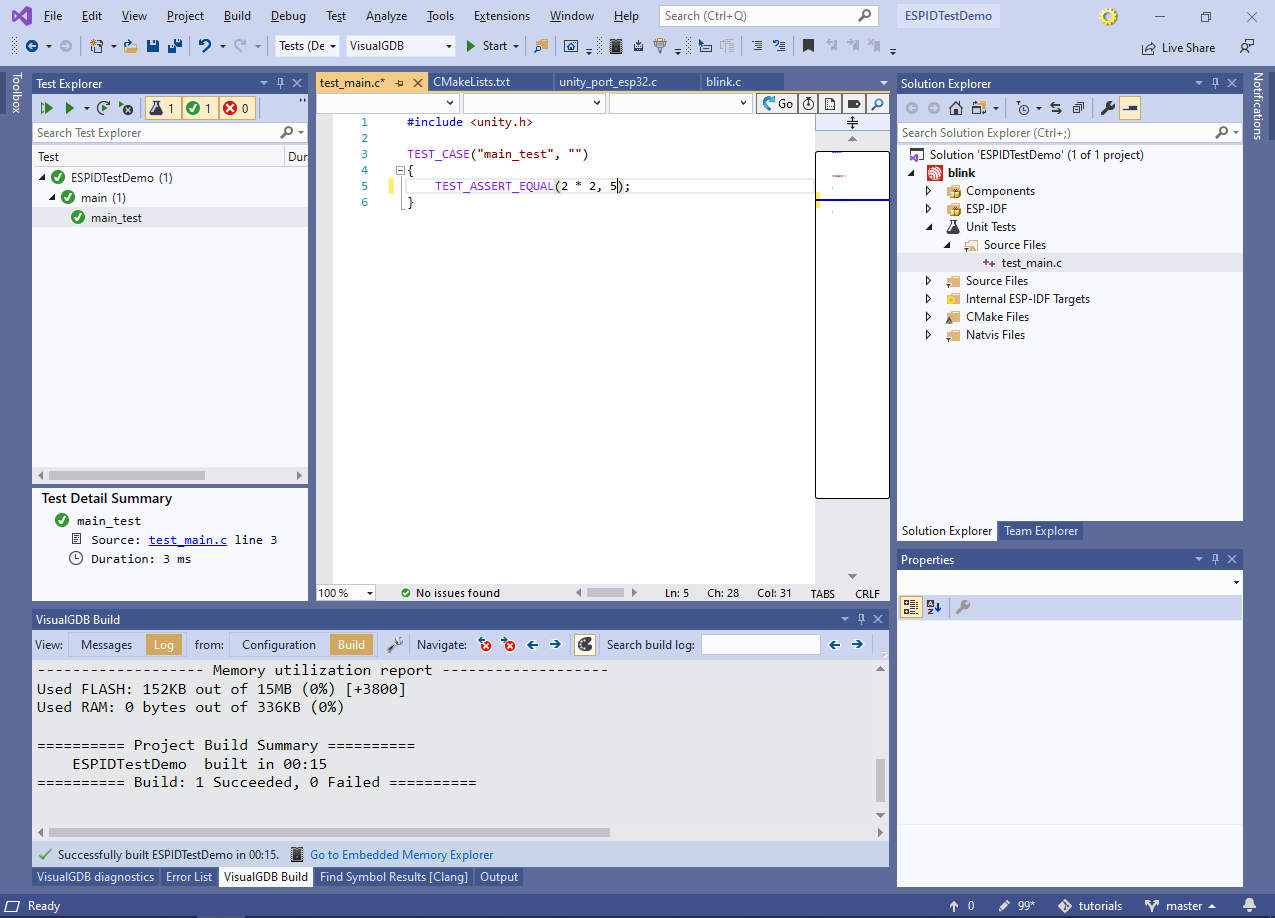
- Build the project and open the Test Explorer window. Now you will be able to browse and run the tests in your project:

- Once the only tests finishes running, Test Explorer will display its outcome. Now we will change the test to fail by replacing “4” with “5” in the TEST_ASSERT_EQUAL() call:
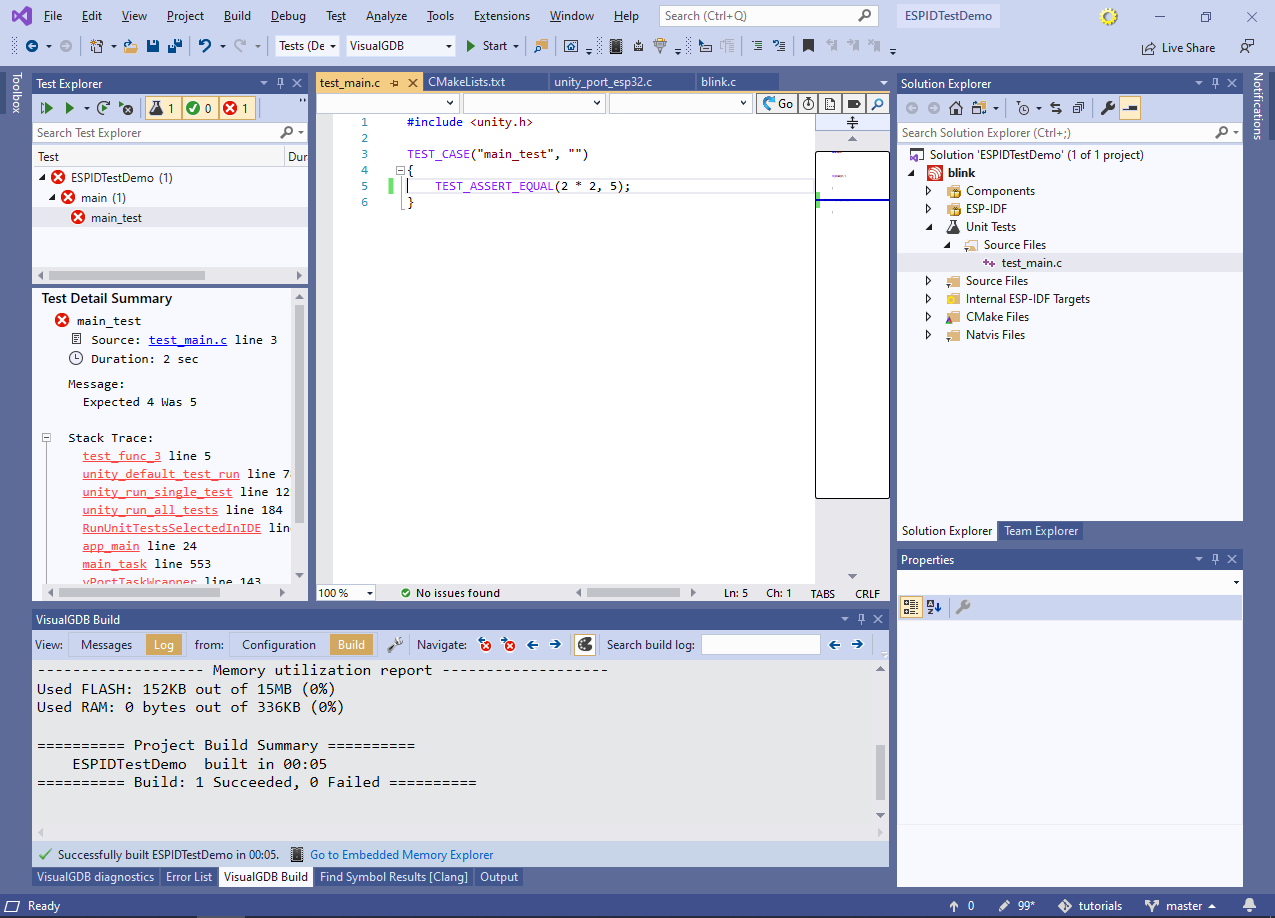
- Run the test again and see how the Test Explorer displayed the call stack of the error:
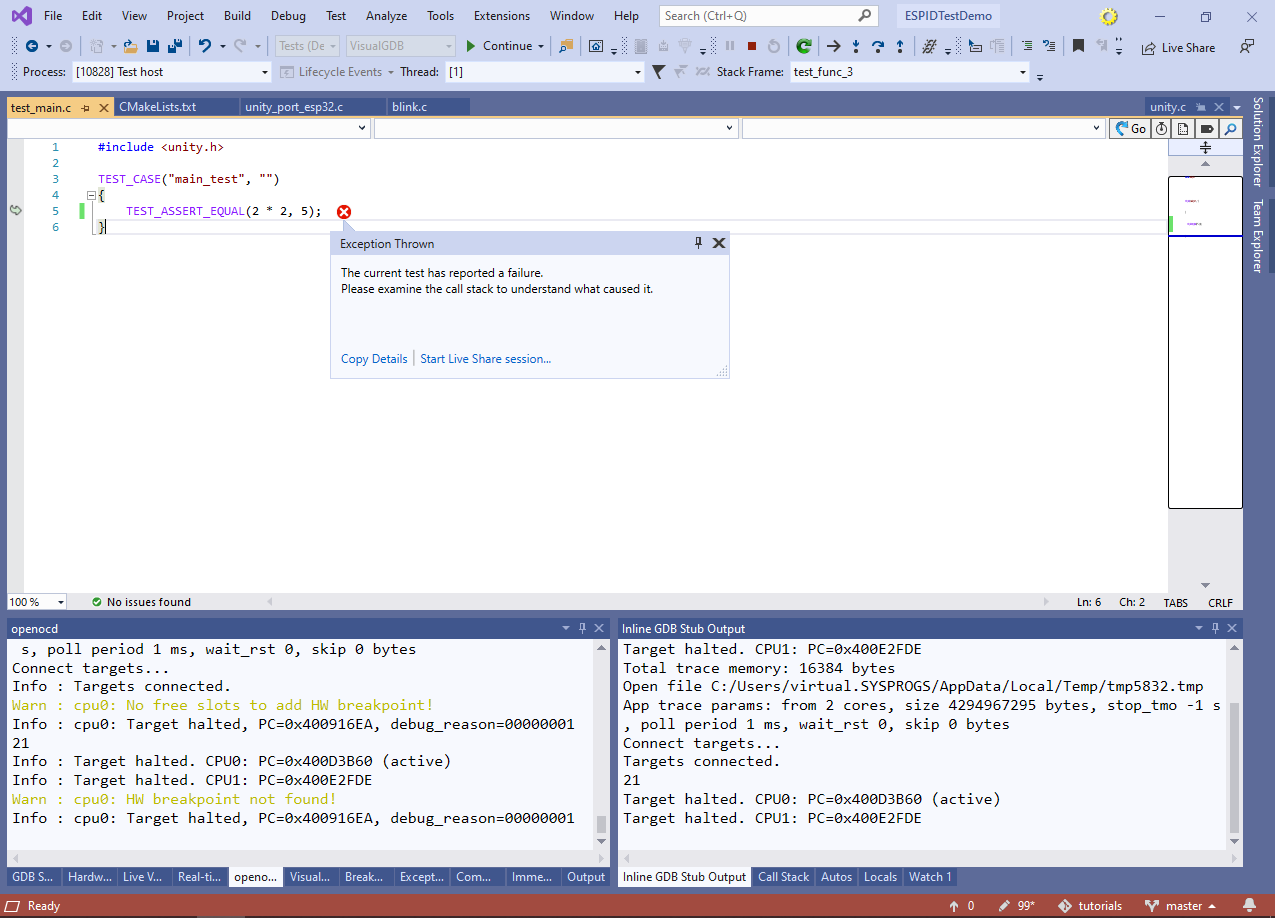
- Right-click on the test in Test Explorer and select “Debug” instead of “Run”. This will launch the test session in the debugger, automatically stopping each time when a test fails:
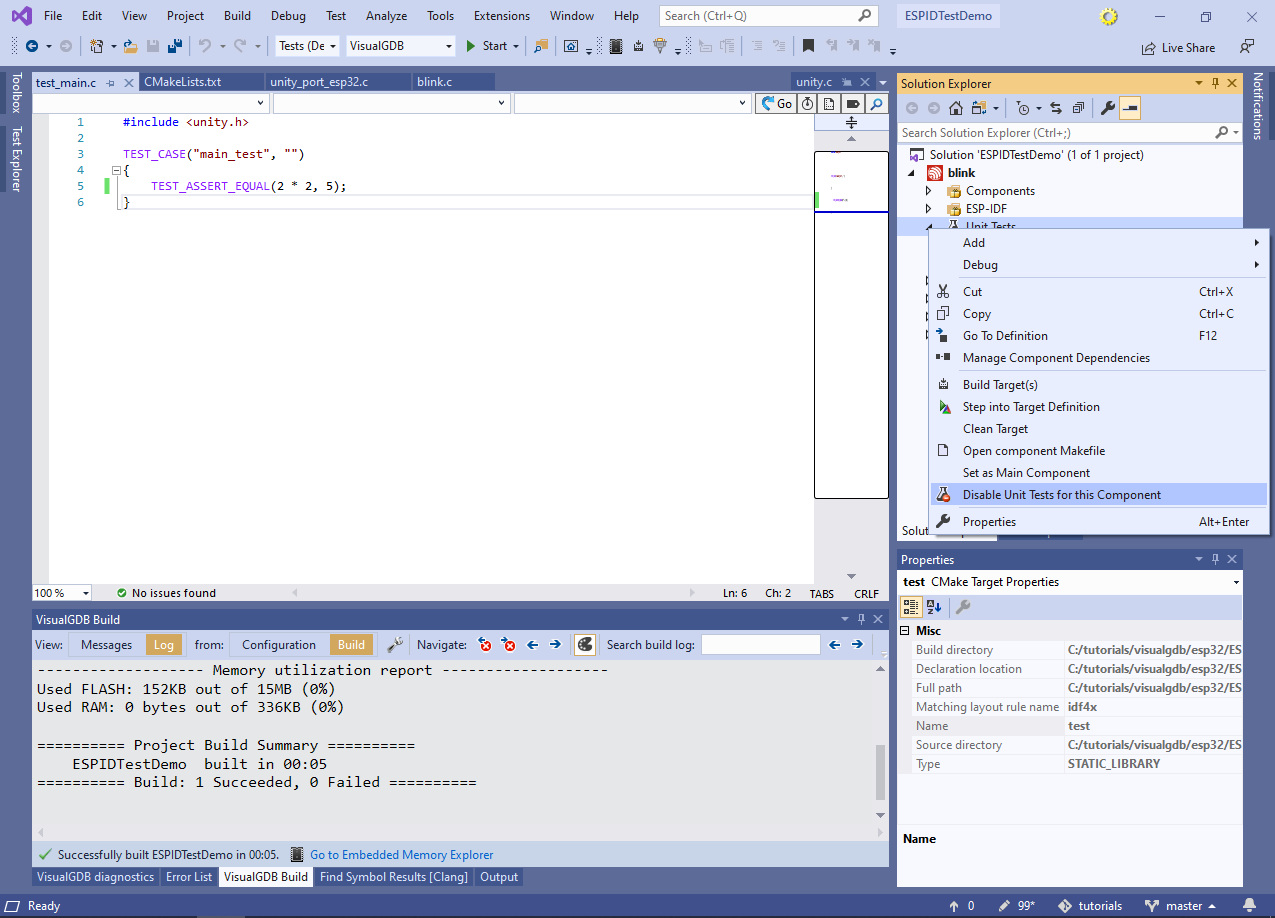
- You can reduce the memory footprint of the application (and the build time) by disabling unit tests for some of the components via Solution Explorer. Disabled test components will not be compiled and the tests provided by them will not appear in Test Explorer:
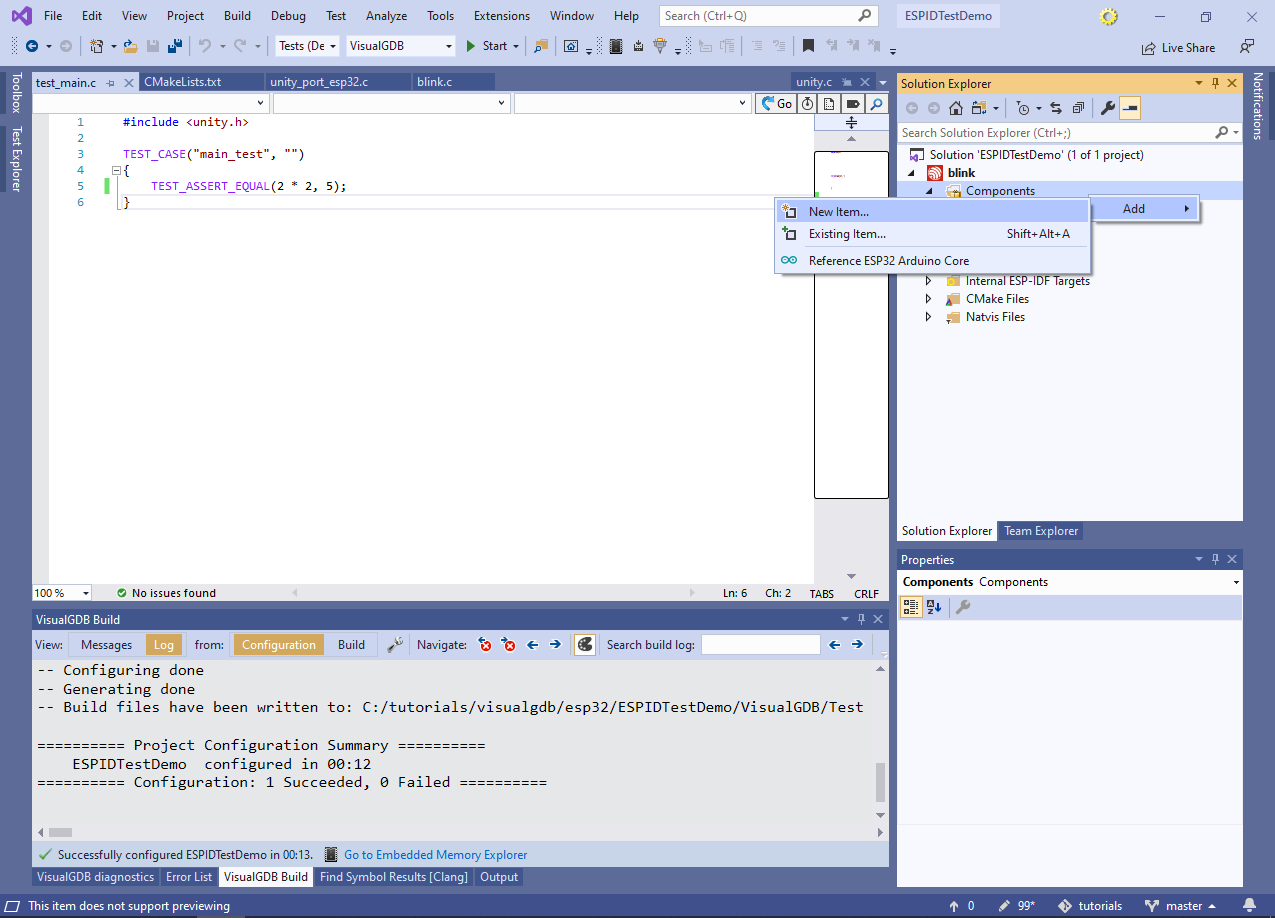
- Now we will show how to create unit tests for another component. Right-click on the “Components” node in Solution Explorer and select Add->New Item:
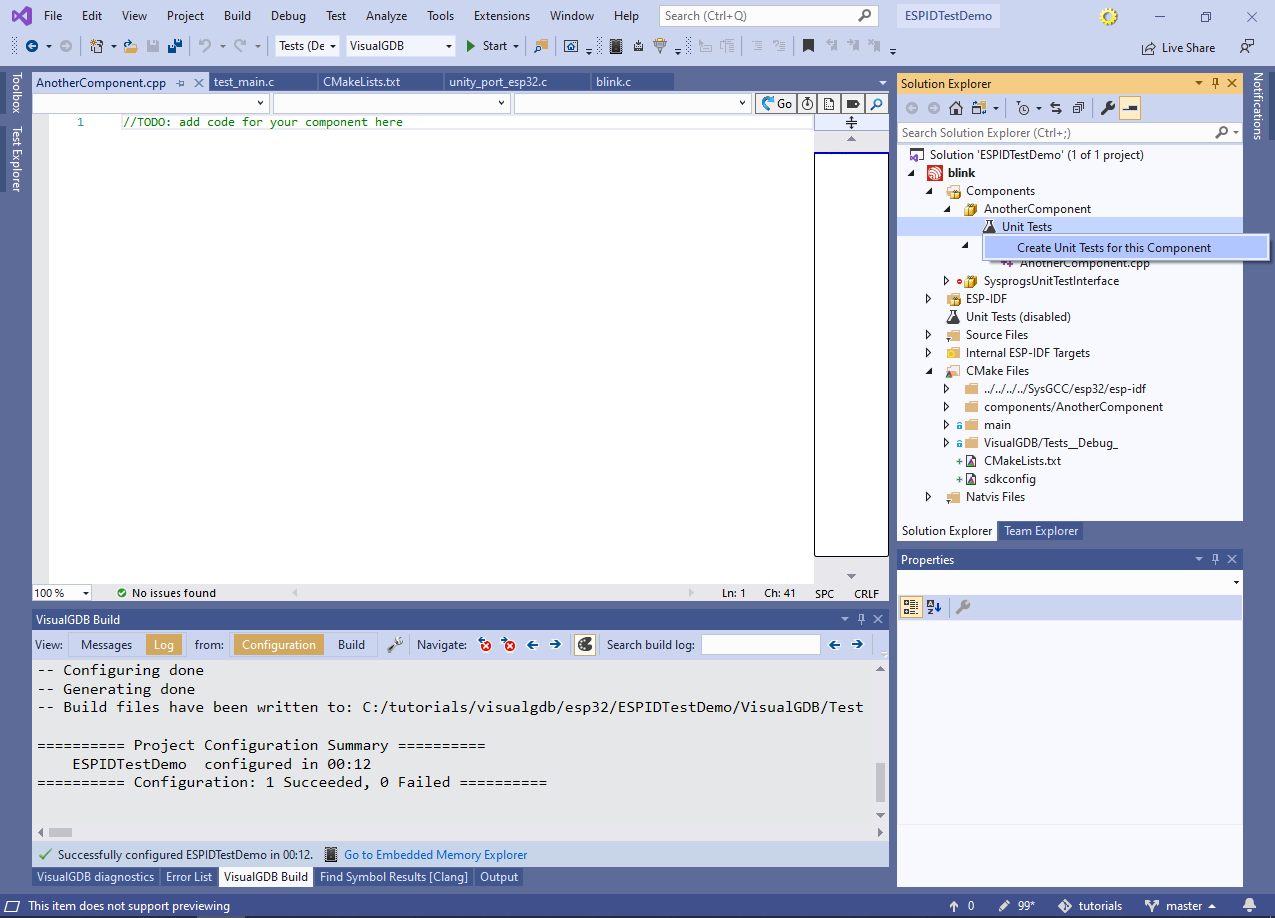
- Proceed with the default name for the component. Once it is created, note how it got its own “Unit Tests” node in Solution Explorer. Right-click on it and select “Create Unit Tests for this Component”:
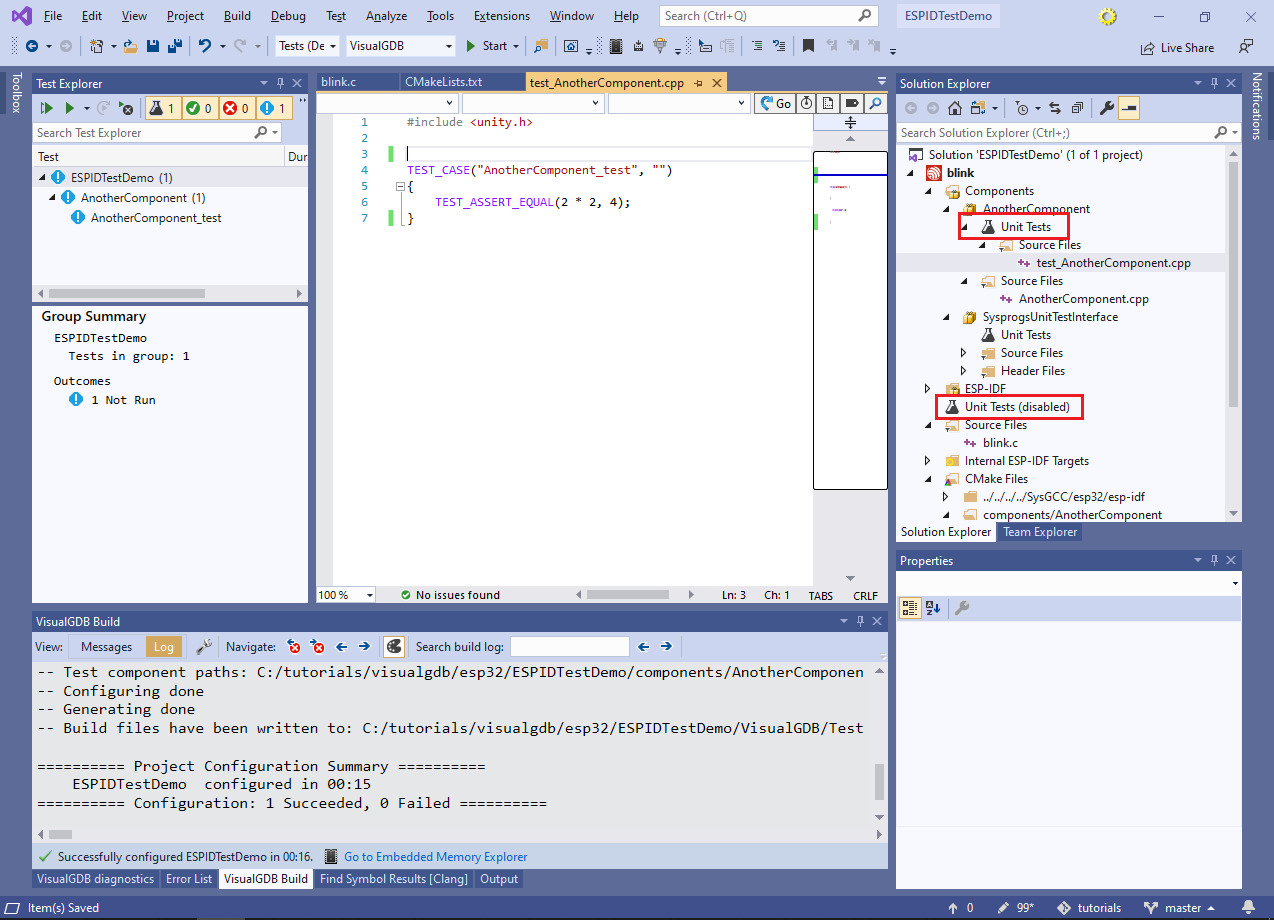
- This will create tests for the newly created component that will be separate from the main tests. Build the project now and see how the new test appears in Test Explorer:
- Even when you are building the test configuration, starting a regular debug session with F5 will let you debug the main application’s code. The RunUnitTestsSelectedInIDE() function will simply return once it determines that no unit tests are scheduled to run, so you can continue using the test configuration to develop your code. The only downside compared to the regular Debug configuration would be slightly longer build time and some memory overhead, since the tests will be still compiled and linked into the application:

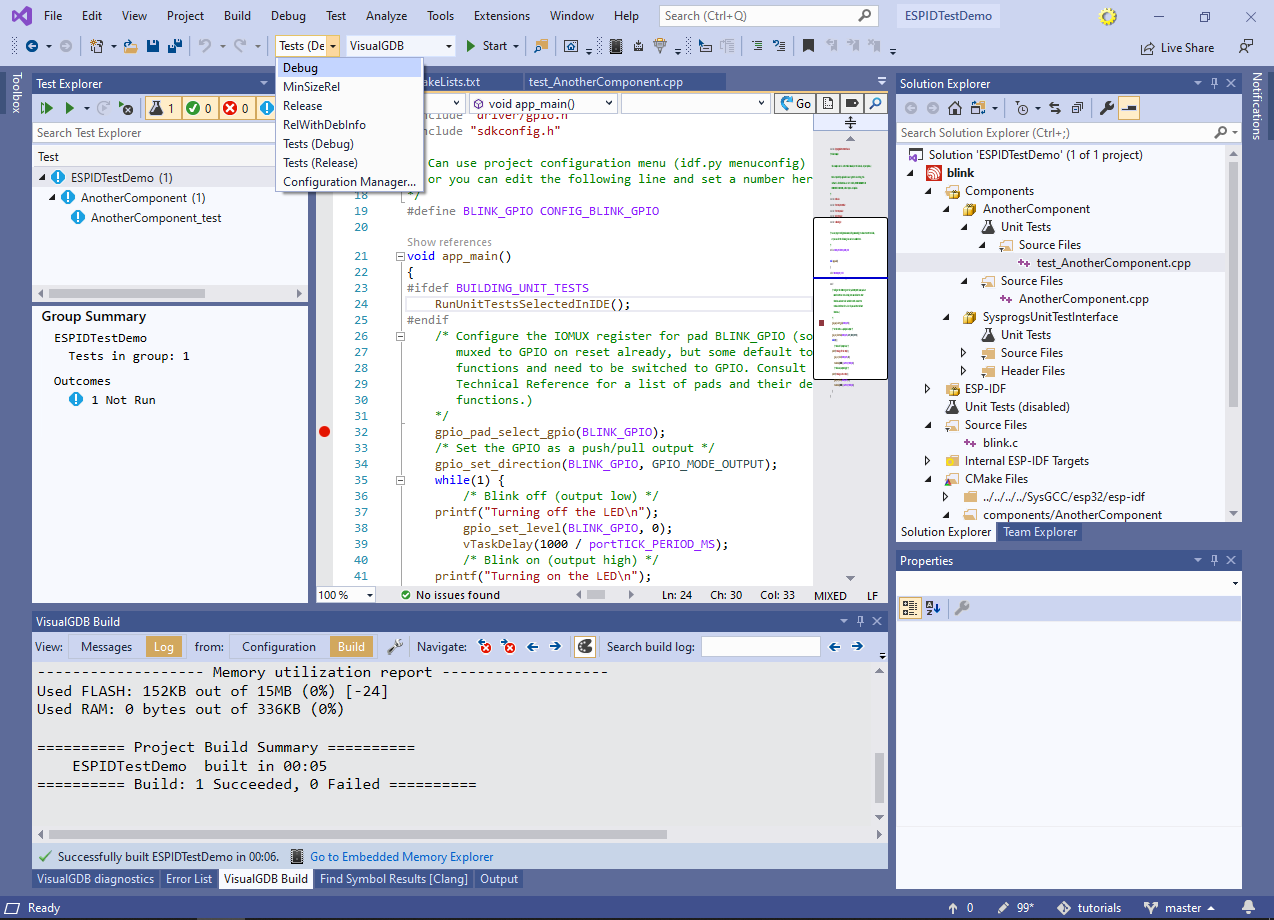
- You can switch back to the Debug configuration (without building the tests) via the Configuration selector in Visual Studio:
- This will stop the tests from being built and will also disable the call to RunUnitTestsSelectedInIDE():