Debugging Multi-Core STM32 Devices with VisualGDB
This tutorial shows how to debug the multi-core STM32H7 devices featuring both an ARM Cortex-M7 and an ARM Cortex-M4 core. We will create 2 projects, one for each core, and will show how to configure our OpenOCD fork to automatically debug both cores at the same time. We will use the STM32H7-Discovery board featuring the STM32H747XI device, however the steps shown in this tutorial will work for other multi-core STM32 devices as well.
Before you begin, install VisualGDB 5.5 or later.
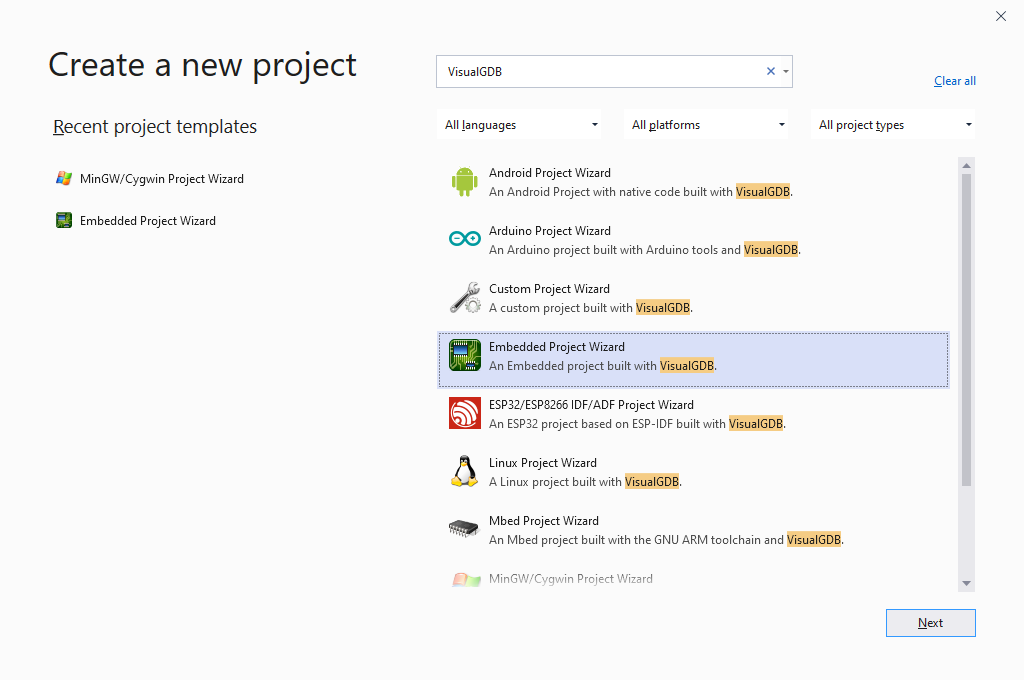
- Start Visual Studio and open the VisualGDB Embedded Project Wizard:
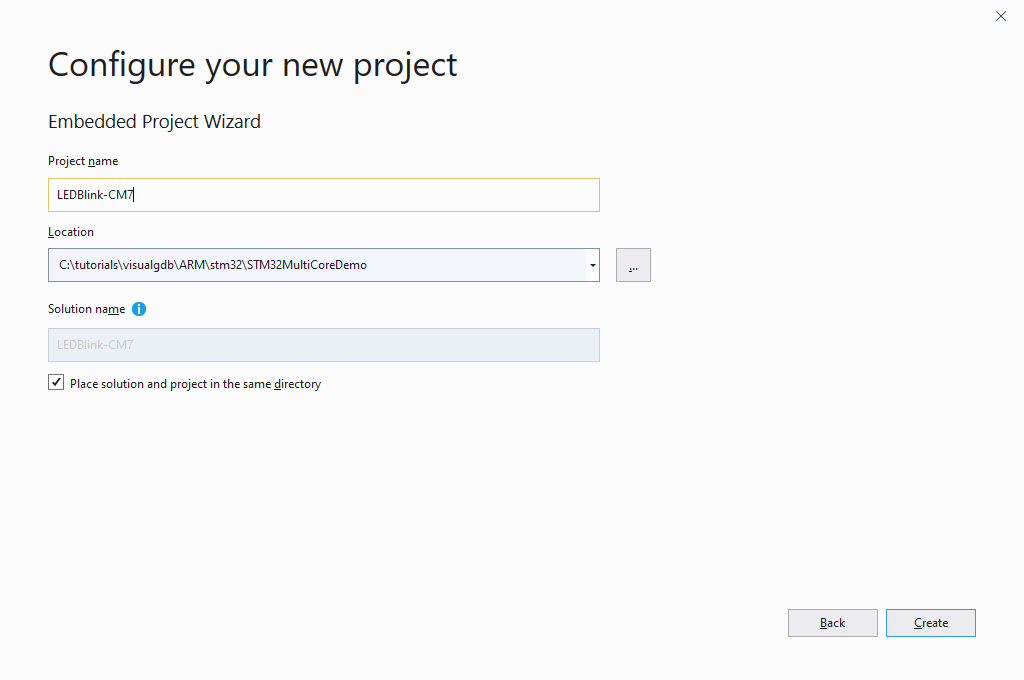
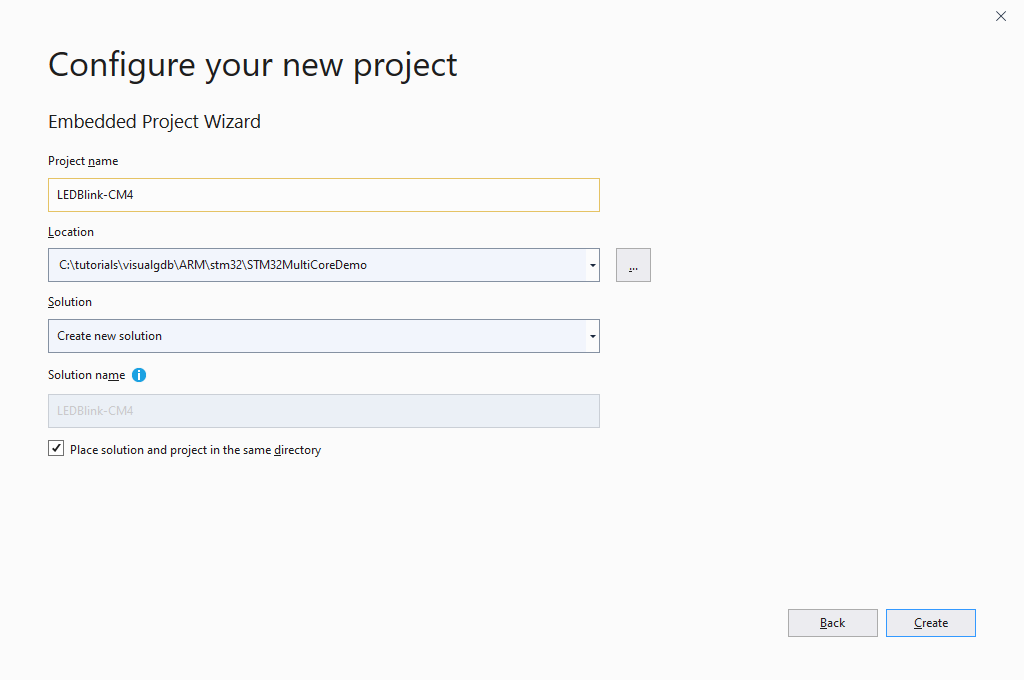
- First, we will create a project for the Cortex-M7 core. Specify the name and location for the new project:
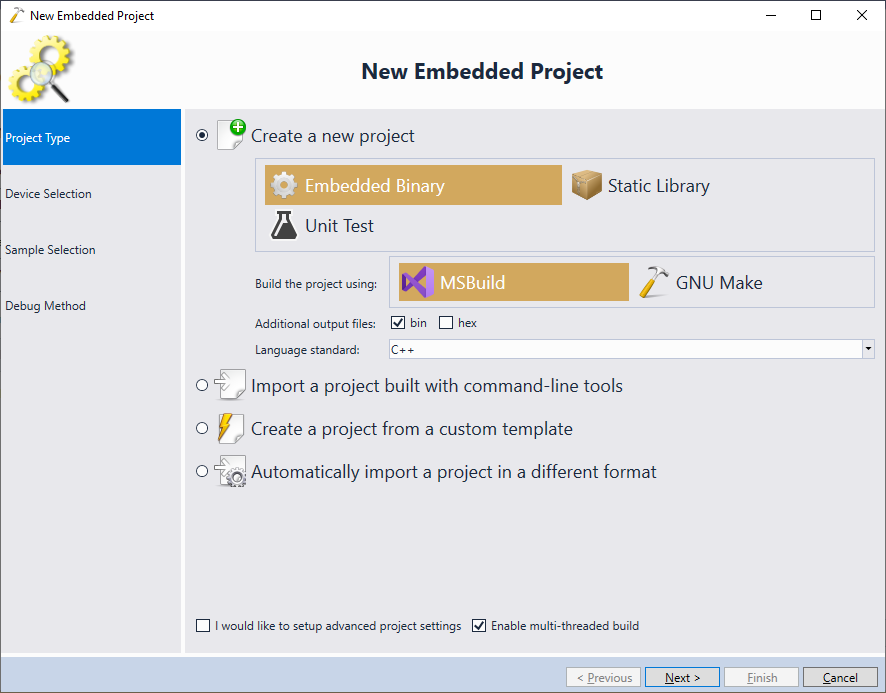
- On the first page of the VisualGDB’s wizard select “Create a new project -> Embedded Binary -> MSBuild” and click “Next” to proceed to the next page:
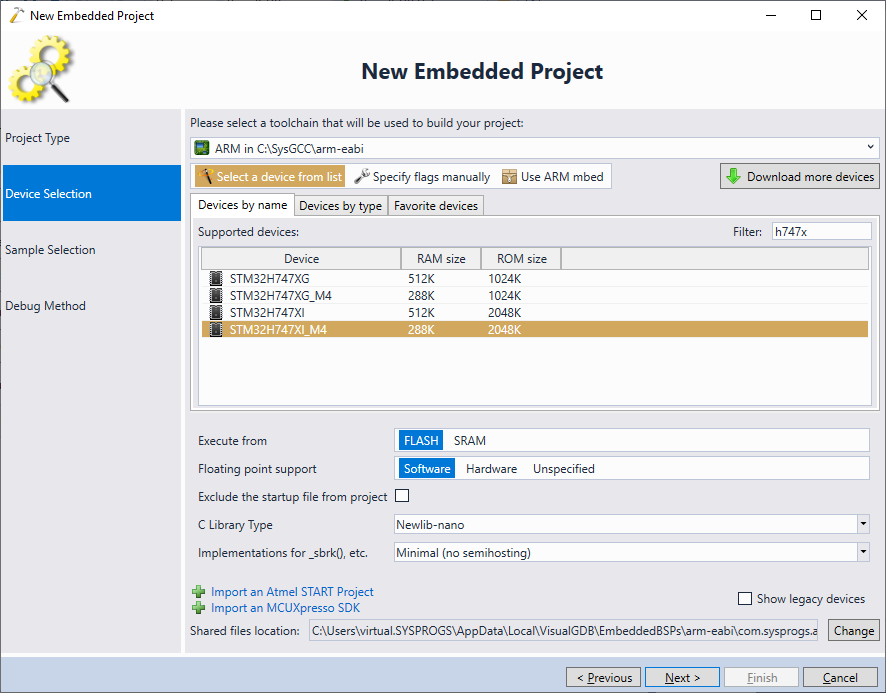
- On the next page select the ARM toolchain and pick your device from the list. Note that the multi-core devices will have 2 entries for each core (in this example, STM32H747XI corresponds to the Cortex-M7 core, while STM32H747XI_M4 corresponds to the Cortex-M4 core):

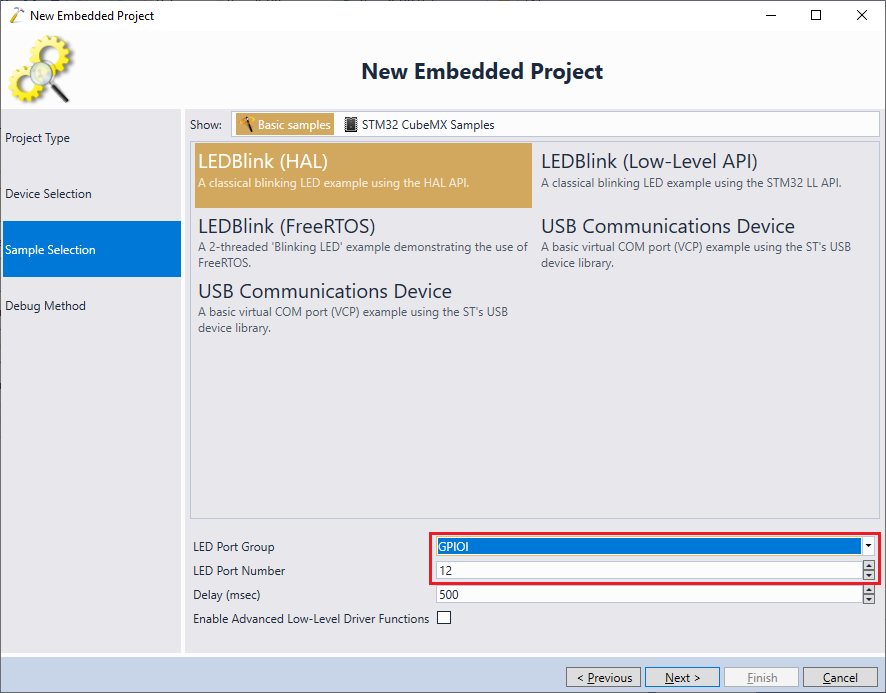
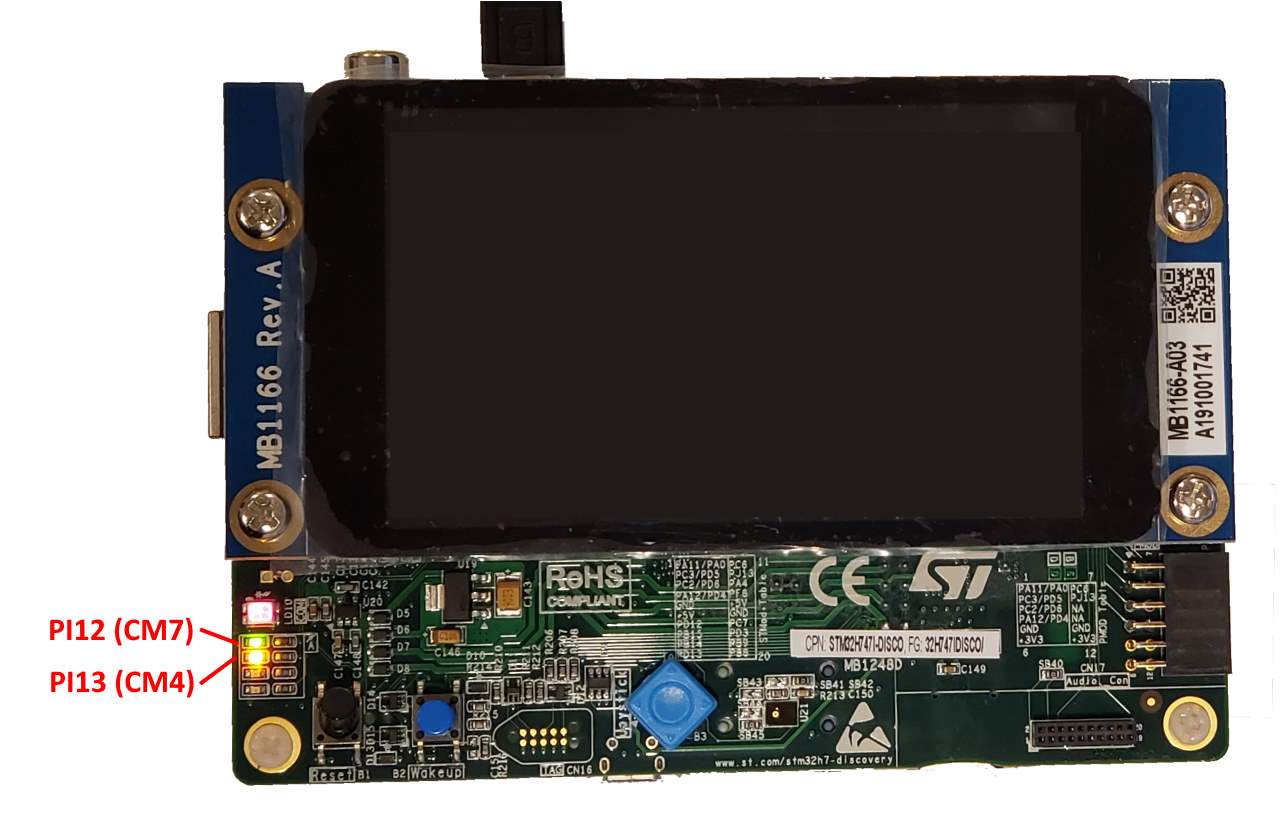
- On the next page pick the LEDBLink (HAL) example and specify the port/pin of the on-board LED. The STM32H7-Discovery board has 4 LEDs connected to ports PI12, PI13, PI14 and PI15, so we will select PI12 for the Cortex-M7 project and PI13 for the Cortex-M4 one:
- Connect your board to the USB port and select it in the “Debug Using” field. Ensure that the “Debugged Device” is detected as “STM32H7xx (Cortex M7 + M4)” and that you can select a specific core below. If not, update your OpenOCD package to the latest version using Tools->VisualGDB->Manage VisualGDB Packages:
 Note: for the best multi-core debugging experience we recommend selecting the ST fork of OpenOCD as shown above.
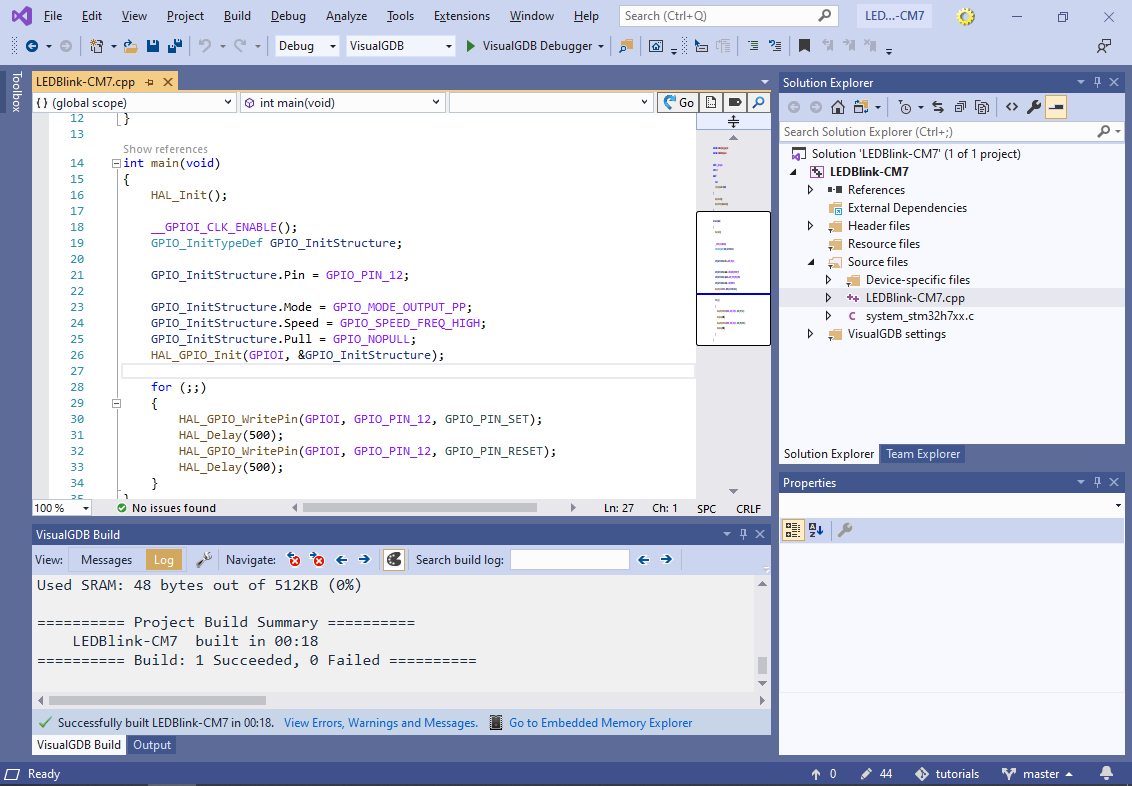
 - Press “Finish” to create the project for the Cortex-M7 core. Build it by pressing Ctrl-Shift-B:
- Now we will create a project for the Cortex-M4 core. Launch another Visual Studio instance and open the VisualGDB Project Wizard again:
- This time, select the STM32H747XI_M4 device:
- Also choose PI13 instead of PI12 as the LED port:

- On the Debug Settings page select the Cortex-M4 core instead of the default Cortex-M7 one:
 Make sure you also uncheck the “reset device” flags, as otherwise starting a debug session with the Cortex-M4 core will reset the Cortex-M7 core.
 - Now you can start debugging both projects, letting each core control one of the on-board LEDs:
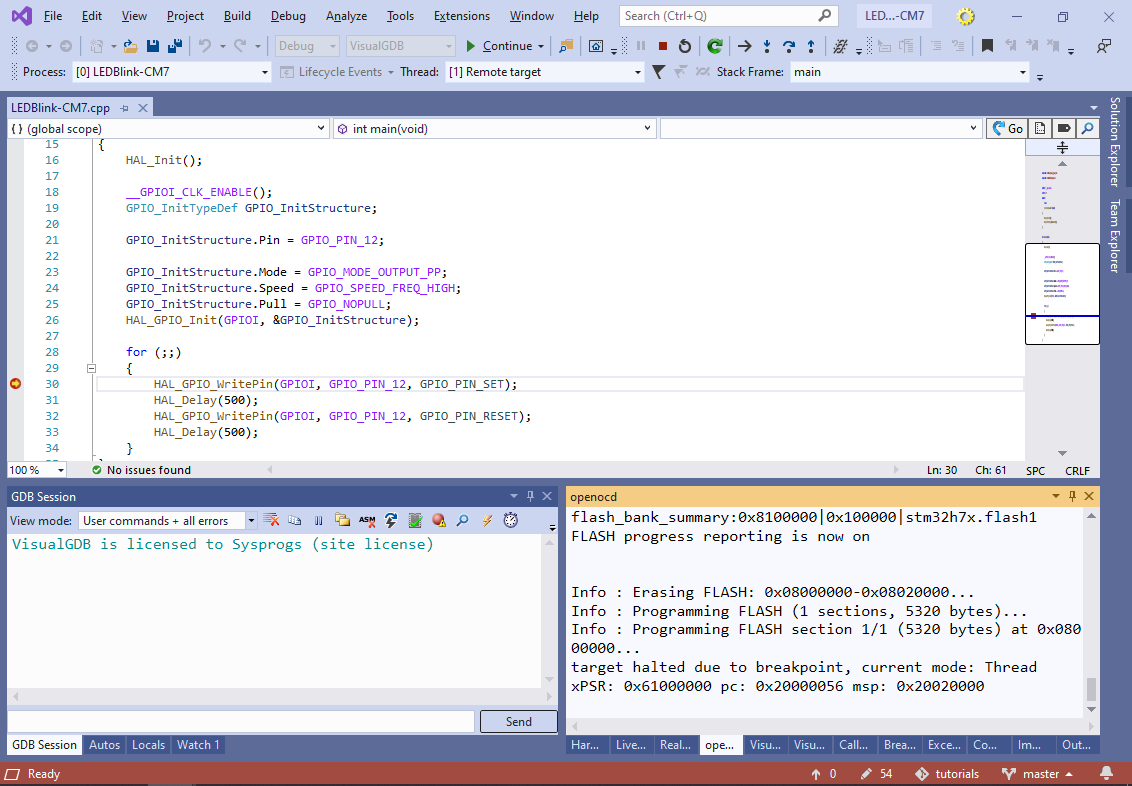
- Set a breakpoint in the for() loop of the Cortex-M7 project and press F5 in its Visual Studio instance to start debugging. Wait for the breakpoint to trigger:
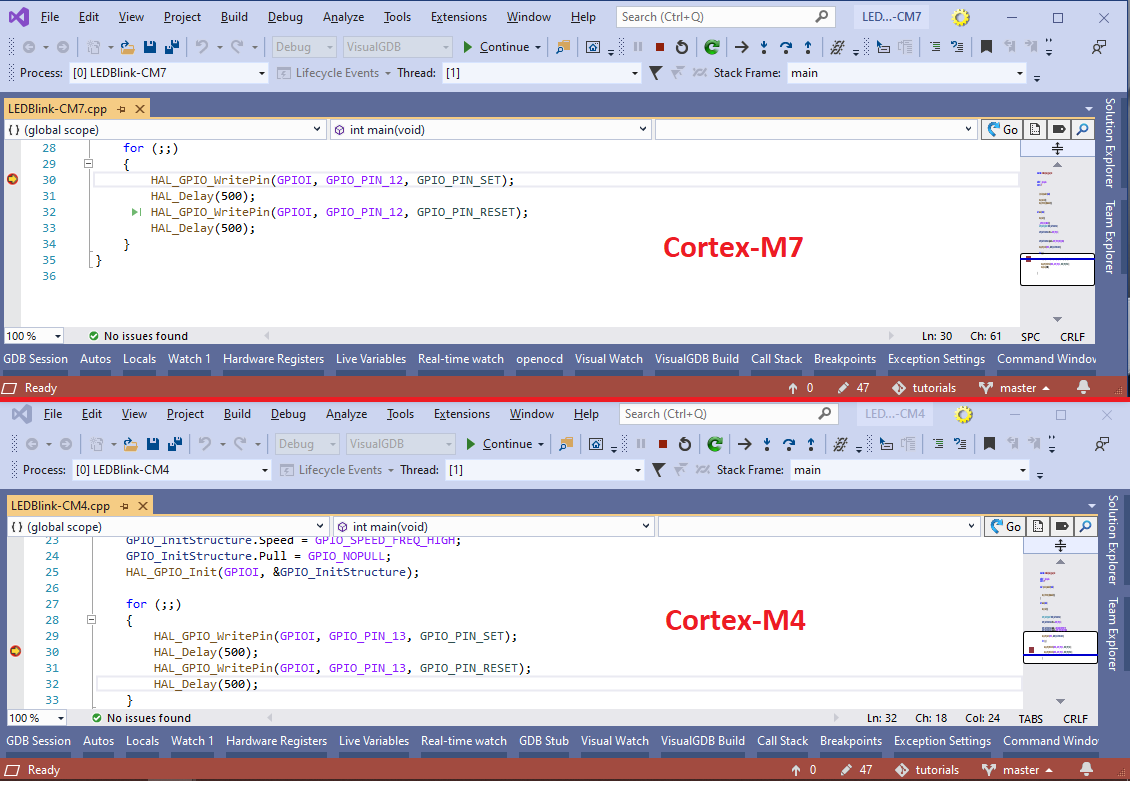
- Switch to the Visual Studio instance that has the Cortex-M4 project open, set a breakpoint there and start debugging it as well:
 The second Visual Studio instance will automatically connect to the OpenOCD session used by the first one, taking control of the Cortex-M4 core.
 - The 2 Visual Studio instances will allow debugging the 2 cores of the STM32H7 device completely independently. E.g. resuming or halting one core will not affect the other one:
 Note that the cores share the same memory space (FLASH and RAM), however the code for them does not overlap. I.e. each core has its own copy of the main() function, HAL_Delay() function, etc., located at different locations in the FLASH memory. Similarly, each core has its own stack in the RAM that must be placed separately from the other core’s stack. You can use the VisualGDB’s Embedded Memory Explorer to explore the memory layout of each of the 2 projects and to understand the memory addresses used by each of them:
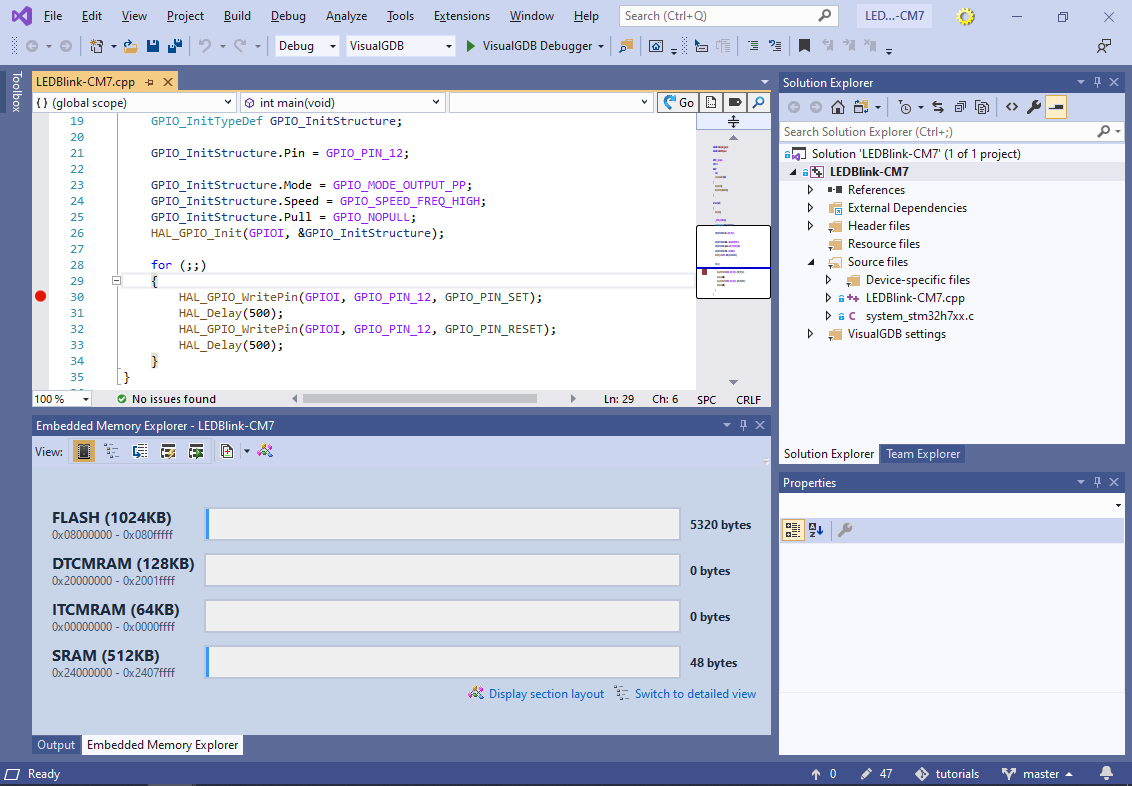
Note that in this tutorial both cores start and run independently. In most practical cases, the Cortex-M7 core would control the Cortex-M4 core, that requires additional debugger setup. See this tutorial for detailed instructions.