Developing projects for the ESP8266 WiFi chip with Visual Studio
This tutorial shows how to create and debug a basic project for the ESP8266 WiFi chip with Visual Studio and VisualGDB. We will show how to:
- Build the ESP8266 firmware in Visual Studio
- Debug the code over JTAG using a common ARM JTAG debugger (we’ll use Segger J-Link)
- Program the SPI FLASH over JTAG
- Work around known problems with the LX106 processor
Before you begin, install VisualGDB 5.0r4 or later.
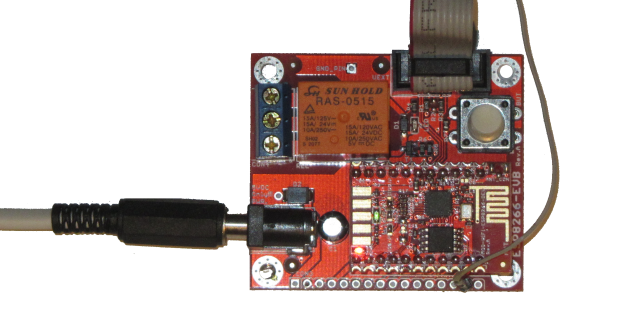
- The first step will be to connect your JTAG debugger to the ESP8266 chip. We will demonstrate it for the Olimex ESP8266-EVB board. The schematics for the board can be found here and the schematic for the MOD-WIFI-ESP8266 module that is attached to the board is here. We will connect the JTAG signals as follows:
ESP8266 Signal JTAG Signal ESP8266 Pin Olimex MOD-WIFI Signal Name Pin on Olimex ESP8266-EVB JTAG20 Pin VDDPST VDD 17 VDD UEXT – 1 1 GND GND PAD GND UEXT – 2 4 MTDI TDI 10 GPIO12 UEXT – 7 5 MTMS TMS 9 GPIO14 UEXT – 9 7 MTCK TCK 12 GPIO13 UEXT – 8 9 MTDO TDO 13 GPIO15 UEXT – 10 13 EXT_RSTB RST 32 RSTB CON3 – 15 15 Warning: if you are using OpenOCD instead of xt-ocd, connect the reset signal to JTAG20 pin 3, not pin 15.
The relevant parts of the schematics are shown below: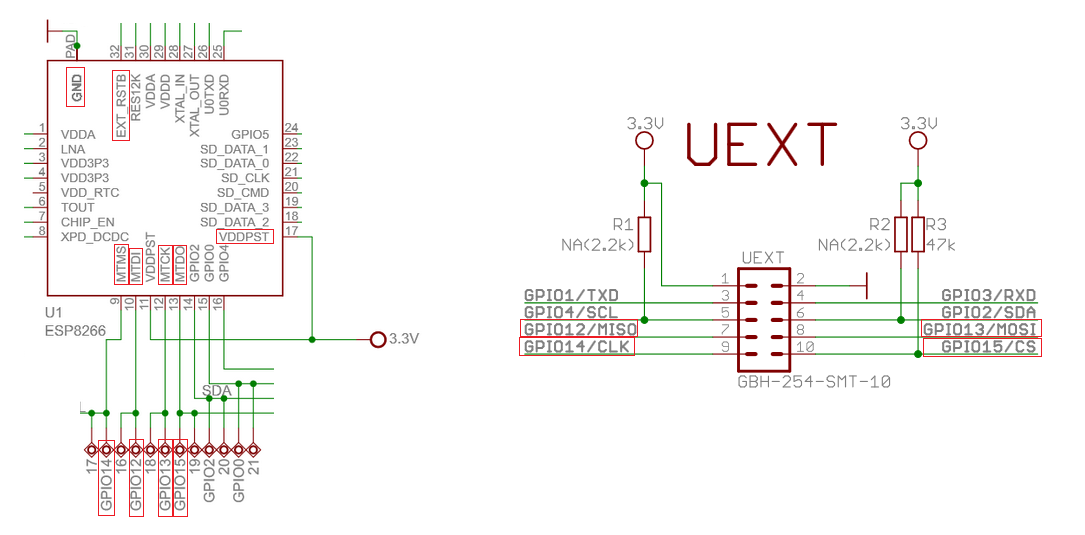 Most of the JTAG signals are available on the UEXT header and only the reset signal needs to be soldered separately. We can also connect the TXD and RXD signals to a USB-to-UART circuit, however the RXD and TXD signals on the Olimex board have levels of 0 to 3.3V and connecting them to a normal UART signals without a level shifter could damage the ESP8266.
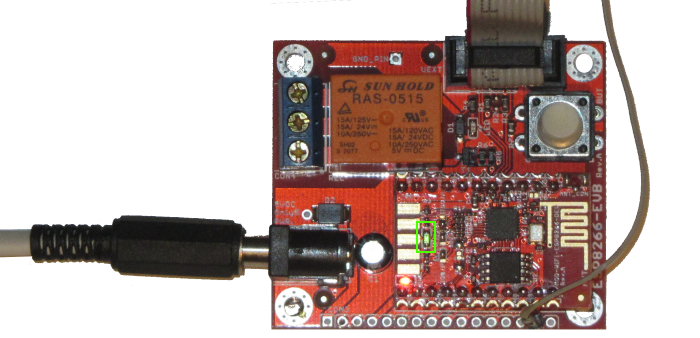
After connecting JTAG and optionally UART your board will look like this: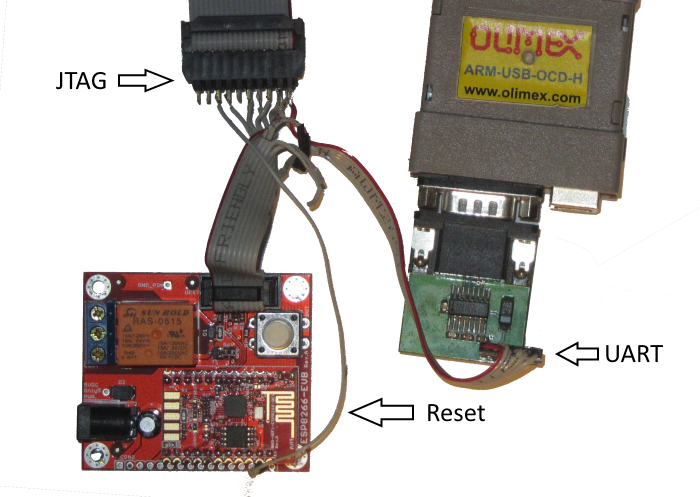
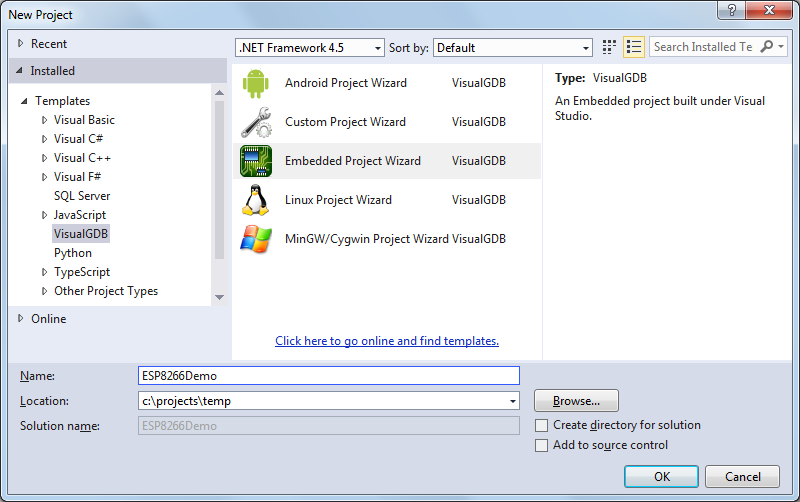
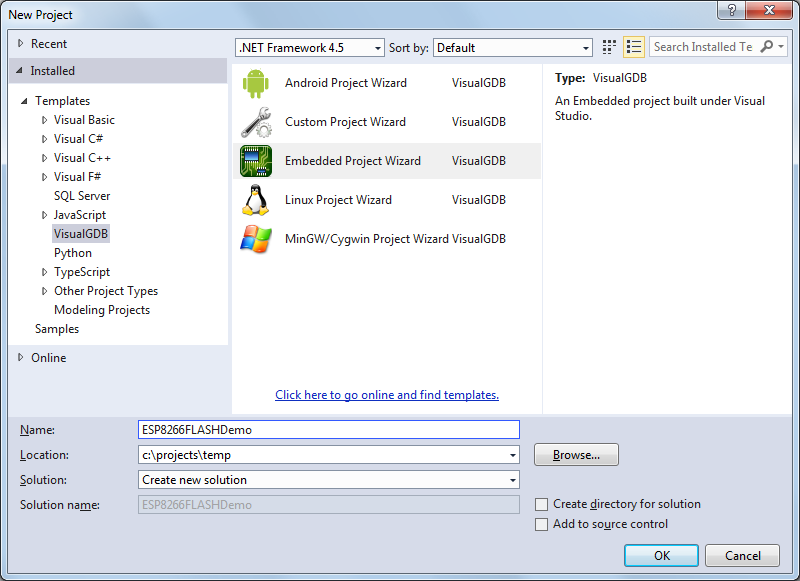
- Start Visual Studio and open the VisualGDB Embedded project wizard:
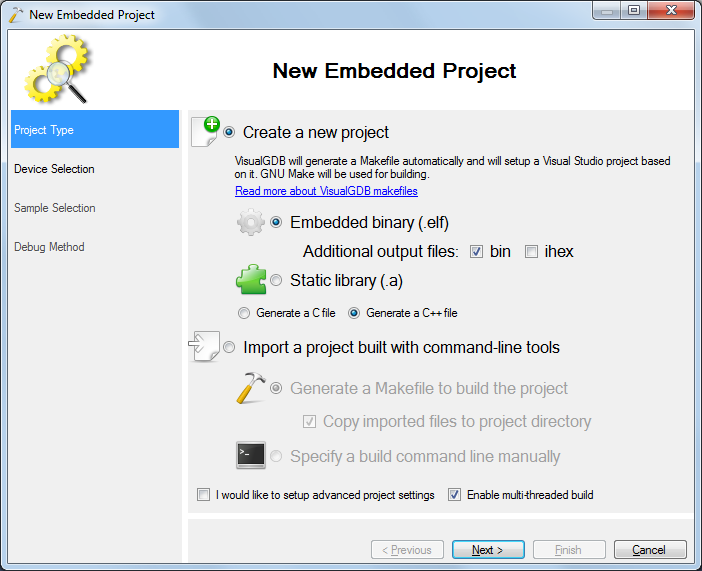
- Proceed with the default settings on the first page:
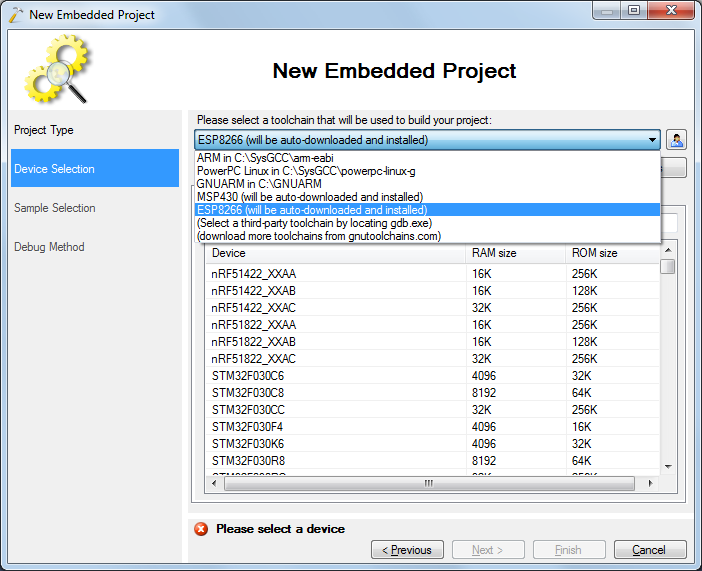
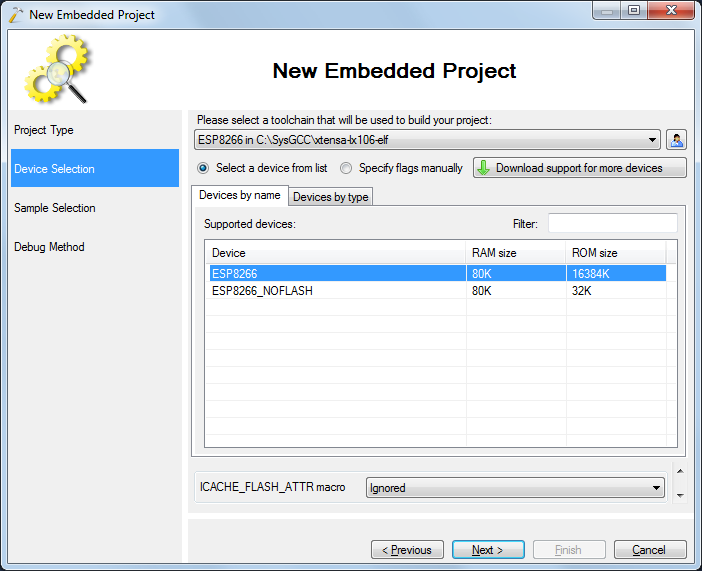
- Then select the ESP8266 toolchain in the toolchain list. If you have not downloaded it yet, VisualGDB will download and install it for you:
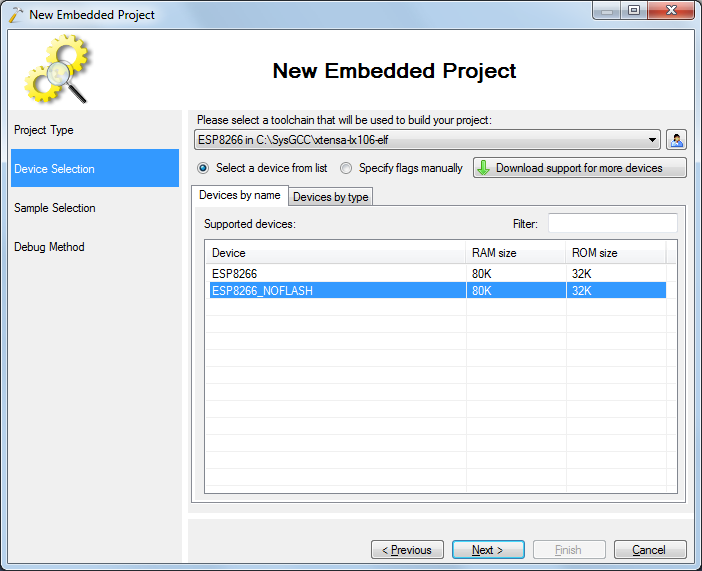
- Our very first project will be as simple as possible and will not use the SPI FLASH. Hence select the ESP8266_NOFLASH in the device list:
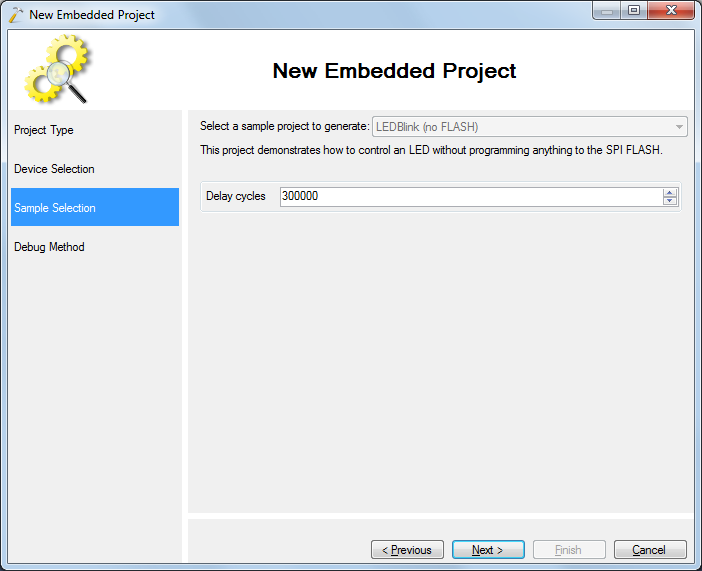
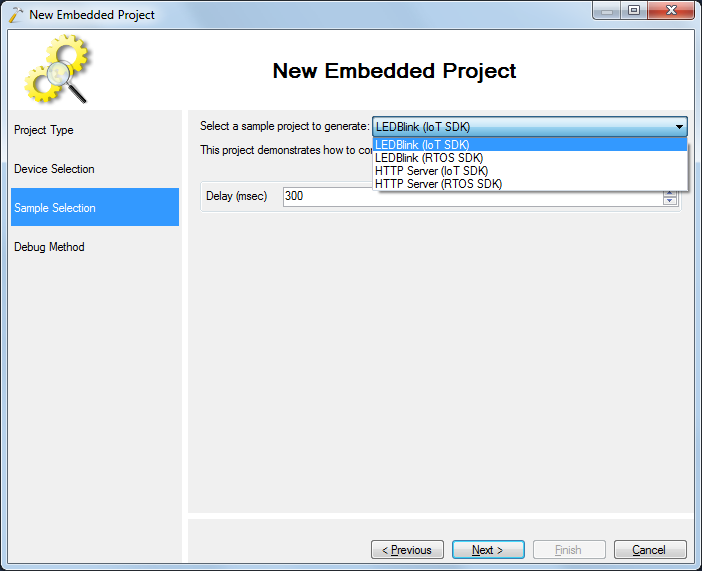
- The “no FLASH” mode only supports one sample project, so simply proceed with the default selection:
- VisualGDB supports 3 debug methods for ESP8266 devices:
- A special OpenOCD port that supports all JTAG programmers supported by the original OpenOCD
- Xtensa OCD Daemon (xt-ocd) that supports ML605, Flyswatter 1/2/3, Jtagkey 2, Olimex tiny-h, Segger J-link, ByteTools Catapult, RVI JTAG and Macraigor probes. This method is obsolete. Please use OpenOCD instead.
- GDB stub from Espressif that does not requre a separate JTAG connection
In this tutorial we will show how to configure the Xtensa OCD Daemon, however for new projects we recommend using OpenOCD instead as described in this tutorial.
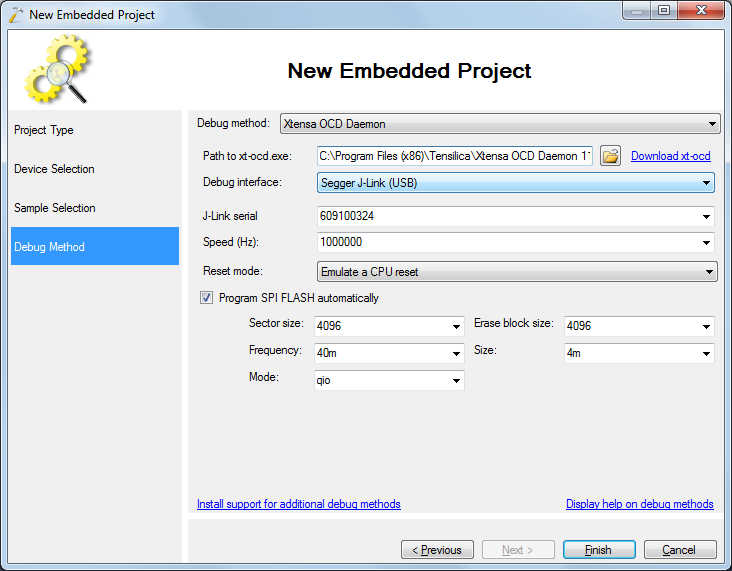
You can leave the default settings for the SPI FLASH, as they will be ignored when debugging a NOFLASH executable.
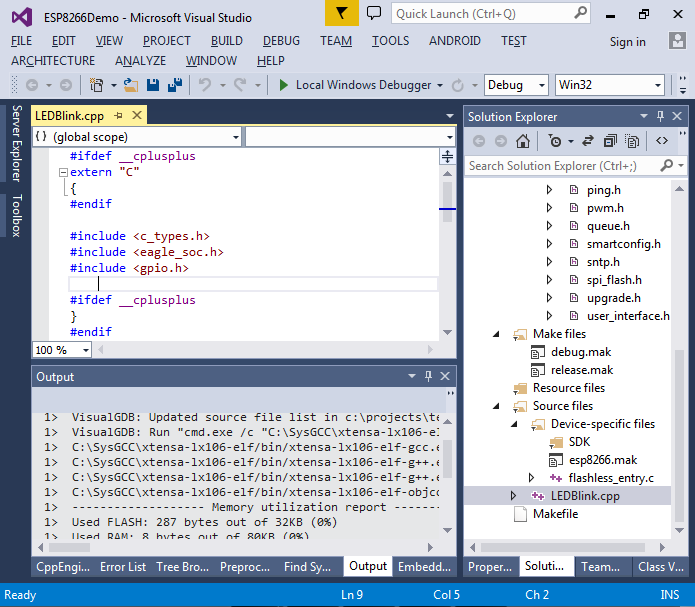
- Press Finish to create your project and build it with Ctrl-Shift-B:
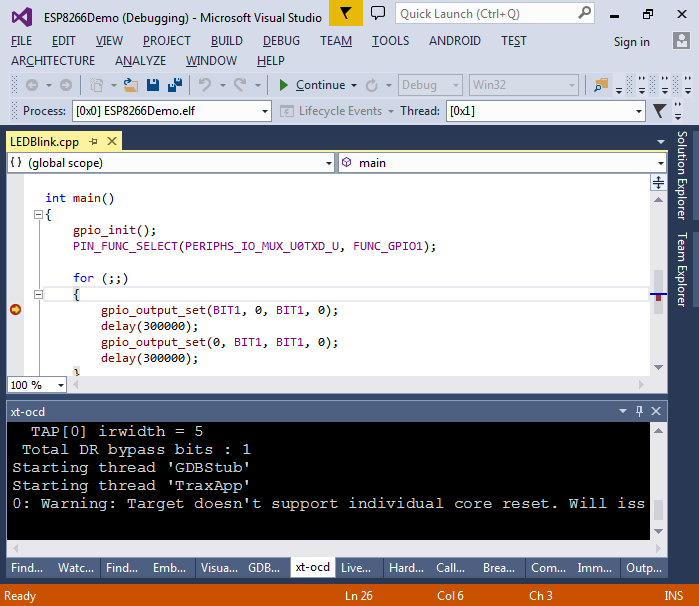
- Press F5 to start debugging. VisualGDB will upload the firmware to the ESP8266. Ensure that the LED starts blinking:
 If you encounter an error, please double-check the following:
- The ESP8266 chip is extremely sensitive to the power. Connect the 5V power to a USB port, powered USB hub, or a 5V charger capable of at least 1A current.
- Sometimes the software running on the ESP8266 can lock up some internal registers. Try holding the bootloader button (large white button on the Olimex board) and replugging the power while holding the button. Then load the program. As the SPI FLASH is not used, using the bootloader mode won’t stop our program from running.
- Double-check the JTAG connection using a multimeter.
- Set a breakpoint at the gpio_output_set() call. It should get triggered immediately:
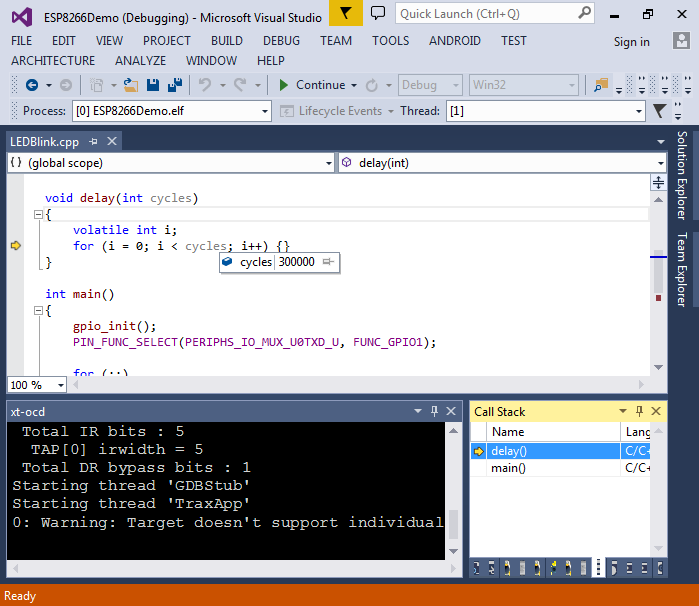
- You can step into your functions and view the local variables as if you are debugging a normal Windows or Linux program:
- Now we will try programming the SPI FLASH over JTAG. Close the solution and open the VisualGDB Project Wizard again:
- Proceed with the defaults on the first page and select the normal ESP8266 device on the second page:
- Select the LEDBlink example using the IoT SDK:
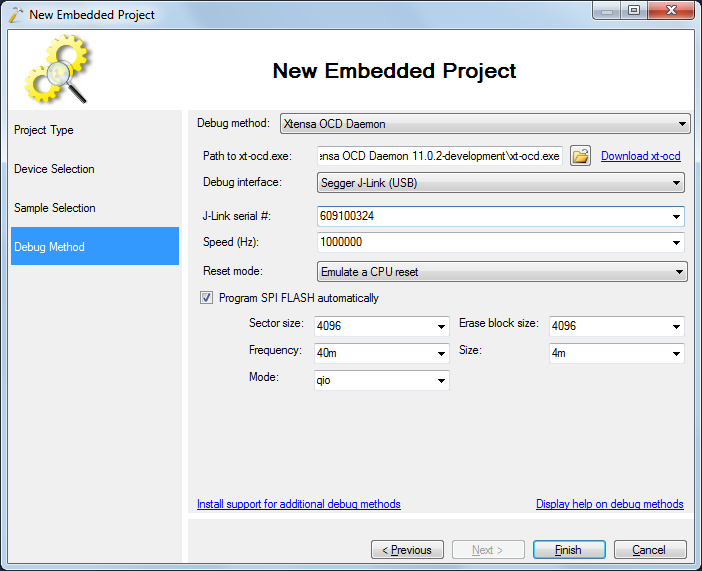
- Specify the debugging settings on the last page of the wizard:
- Now you can build your project and hit F5 to load it into the SPI FLASH:
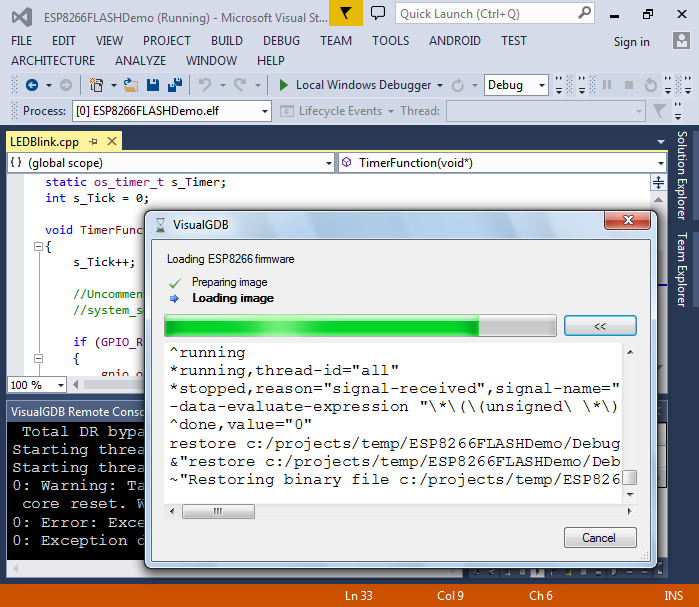 The ESP8266 debugging logic is less reliable as the ARM debugging logic, so the programming sometimes fails. VisualGDB can recover from most conditions, however if you see errors like “cannot access memory” or the progress does not change for too long, simply cancel the programming, replug the power to both ESP8266 and your JTAG programmer and try again.
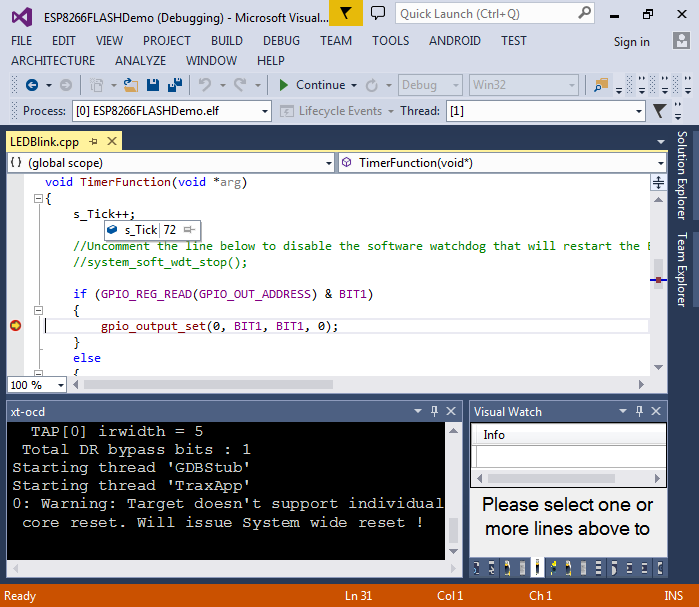
 - Once the programming is complete, you can set breakpoints and step through the code like usual:
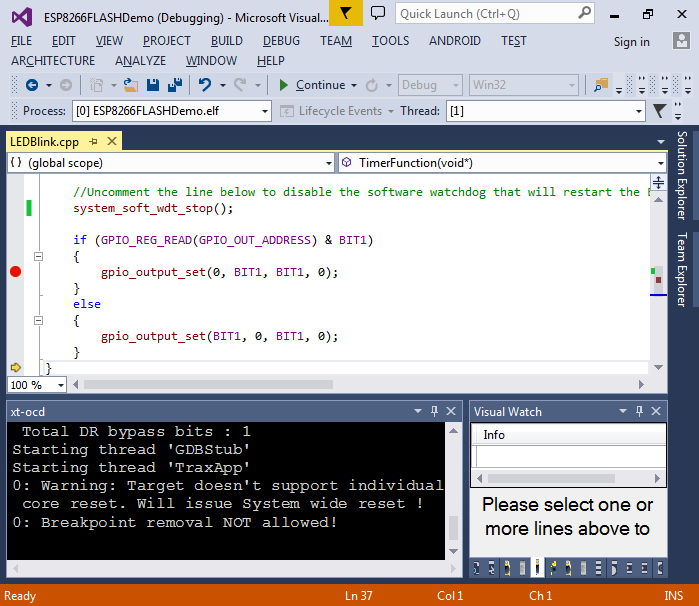
- Note that by default the software watchdog will reset your program if it has been stopped at a breakpoint for too long. To override this behavior, uncomment the system_soft_wdt_stop() call:
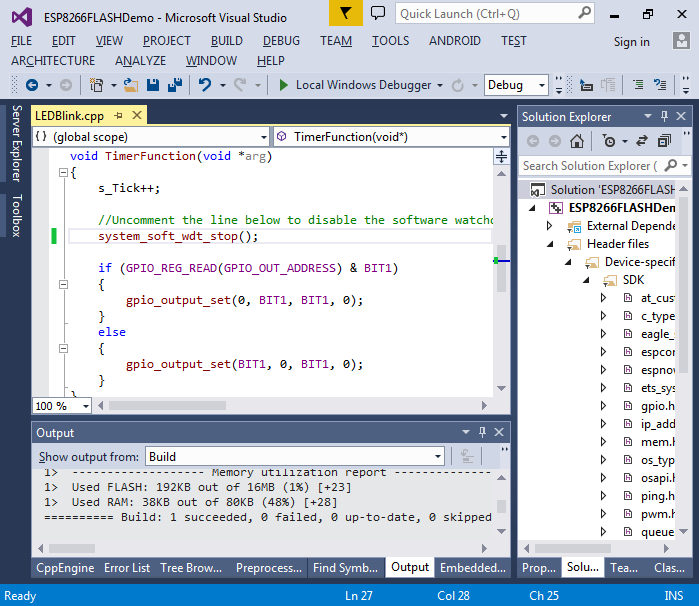
- Now you can step through the code without getting interrupted by the watchdog:
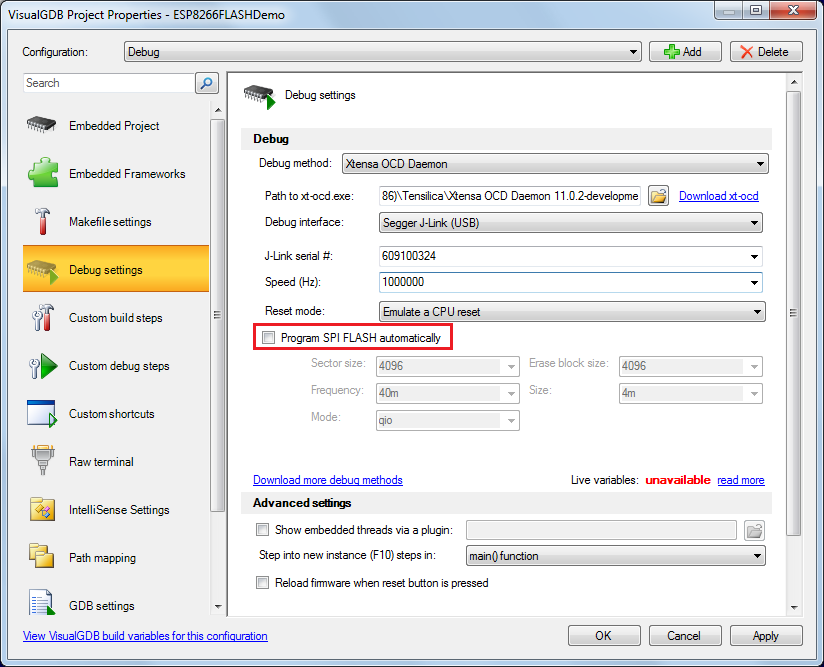
- You can uncheck the “Program SPI FLASH automatically” checkbox if you want to debug the same program several times and do not want to program SPI FLASH each time:
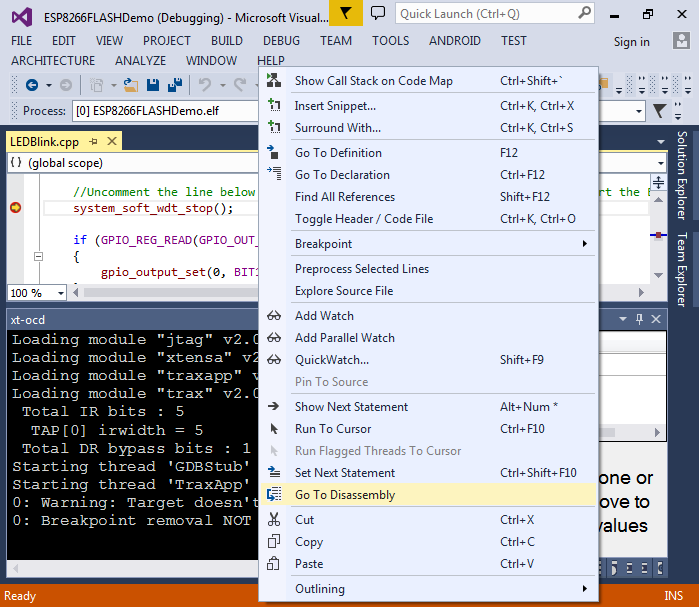
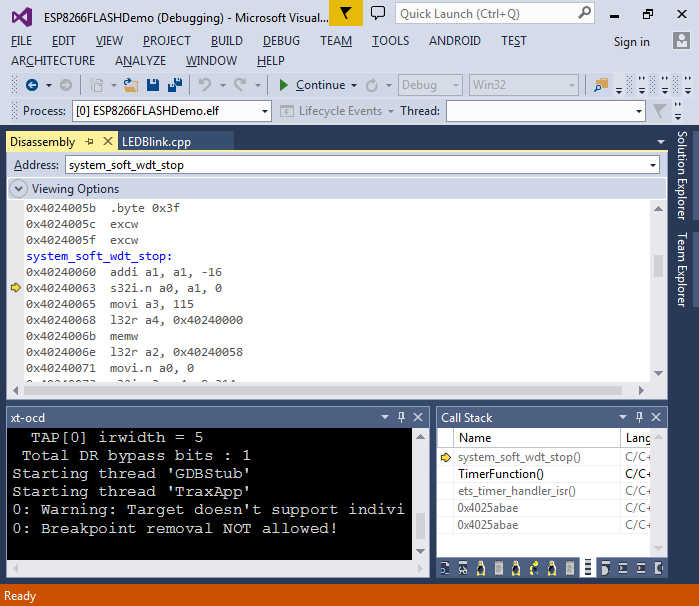
- As the ESP8266 system functions do not come with source code, you cannot step into them directly. However, you can switch to the disassembly mode to view the specific assembly instructions:
- Then you can step into the ESP8266 library functions by pressing F11:
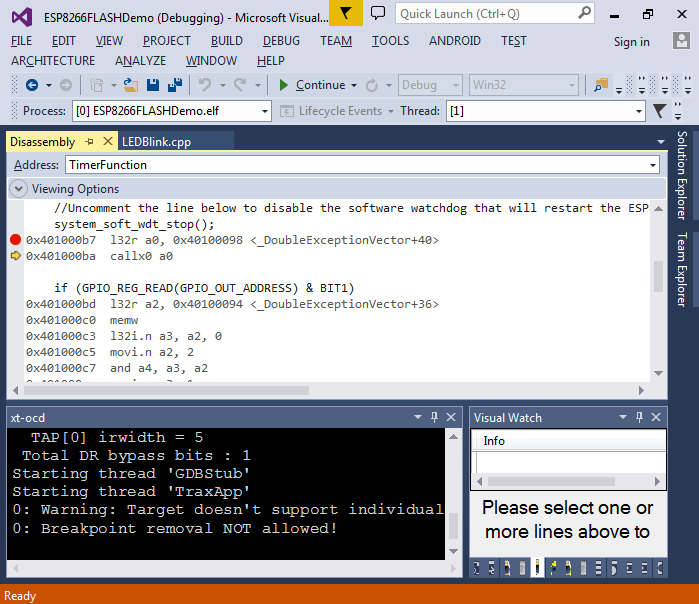
- Note that you won’t see the source for those functions. You can also disassemble a given function by running a “x/<number>i <function name>” command in the GDB Session window:
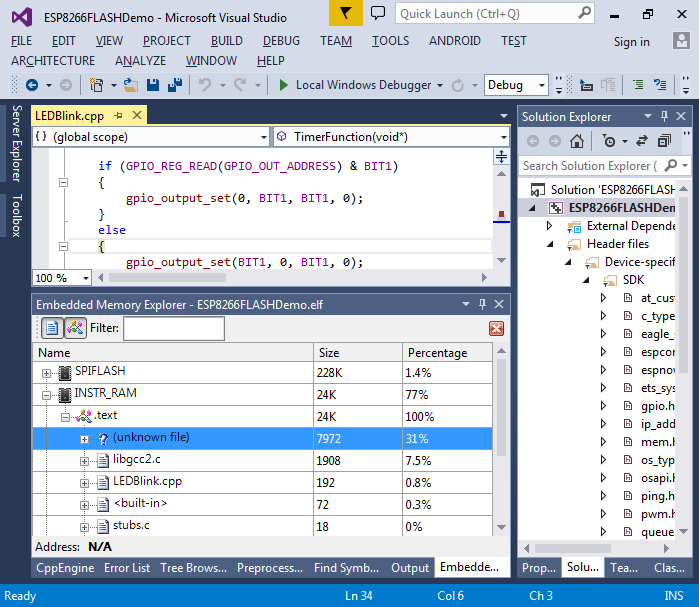
- Finally we will demonstrate how to place your functions directly to the SPI FLASH to preserve RAM. Open the Embedded Memory Explorer and expand the INSTR_RAM memory. You will see that most of it is occupied by various library functions:
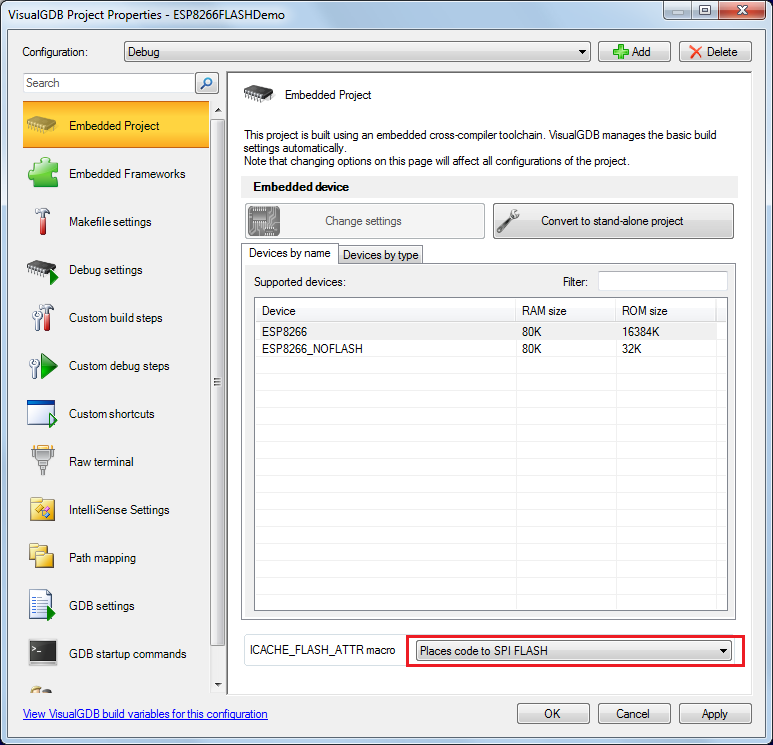
- Open VisualGDB Project Properties and enable the ICACHE_FLASH_ATTR macro:
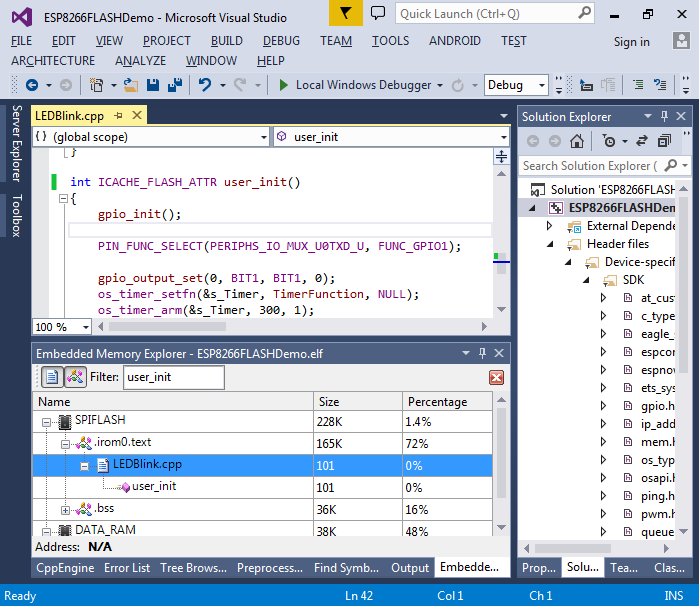
- Add the macro to the user_init() declaration and observe how it was moved to the SPIFLASH area reducing the utilization of INSTR_RAM:
 Having your code run from the SPI FLASH directly saves the limited instruction RAM, however it makes them run slower and limits the breakpoint functionality. As the ESP8266 chip has only one hardware breakpoint, you will only be able to set one breakpoint in a function placed directly to SPI FLASH. Furthermore, while this breakpoint is active, stepping won’t work as it relies on the same hardware breakpoint. Hence it is always recommended to place the functions you intend to debug into the instruction RAM.


