Creating Custom Live Watch Nodes via Live Watch Plugins
This tutorial shows how to use the Live Watch Plugin API to create custom Live Watch nodes showing various information about the debugged program. We will show how to create a “Counter” node displaying the name and value of a counter inside the program. We will also explain how to make the custom nodes plottable and how to optimize the memory reading performance when using Live Watch.
Before you begin, follow this tutorial or clone this Git tag to get a basic Live Watch plugin that creates 2 simple, but not very functional nodes. Once you got the basic setup working, make sure you open the plugin project in Visual Studio and follow the steps below to add functionality to it:
- In the previous tutorial we have implemented a basic ILiveWatchNode showing an empty counter list. In this tutorial we will update it to have actual counter nodes corresponding to instances of the “Counter” struct in the code. Replace the original empty GetChildren() method with the following code that finds a single counter instance called g_Counter and creates a node for it if it was found (see the next tutorial for examples of locating multiple variables automatically):
ILiveWatchEngine _Engine;

public CounterListNode(ILiveWatchEngine engine)
{
	_Engine = engine;
}

public ILiveWatchNode[] GetChildren(LiveWatchChildrenRequestReason reason)
{
	var result = new List<ILiveWatchNode>();
	var counter = _Engine.Symbols.LookupVariable("g_Counter");
	if (counter != null)
		result.Add(new CounterNode(_Engine, counter));
	return result.ToArray();
}
Then, go to the CounterNode word, press Ctrl+. and select “Generate class ‘CounterNode’“:

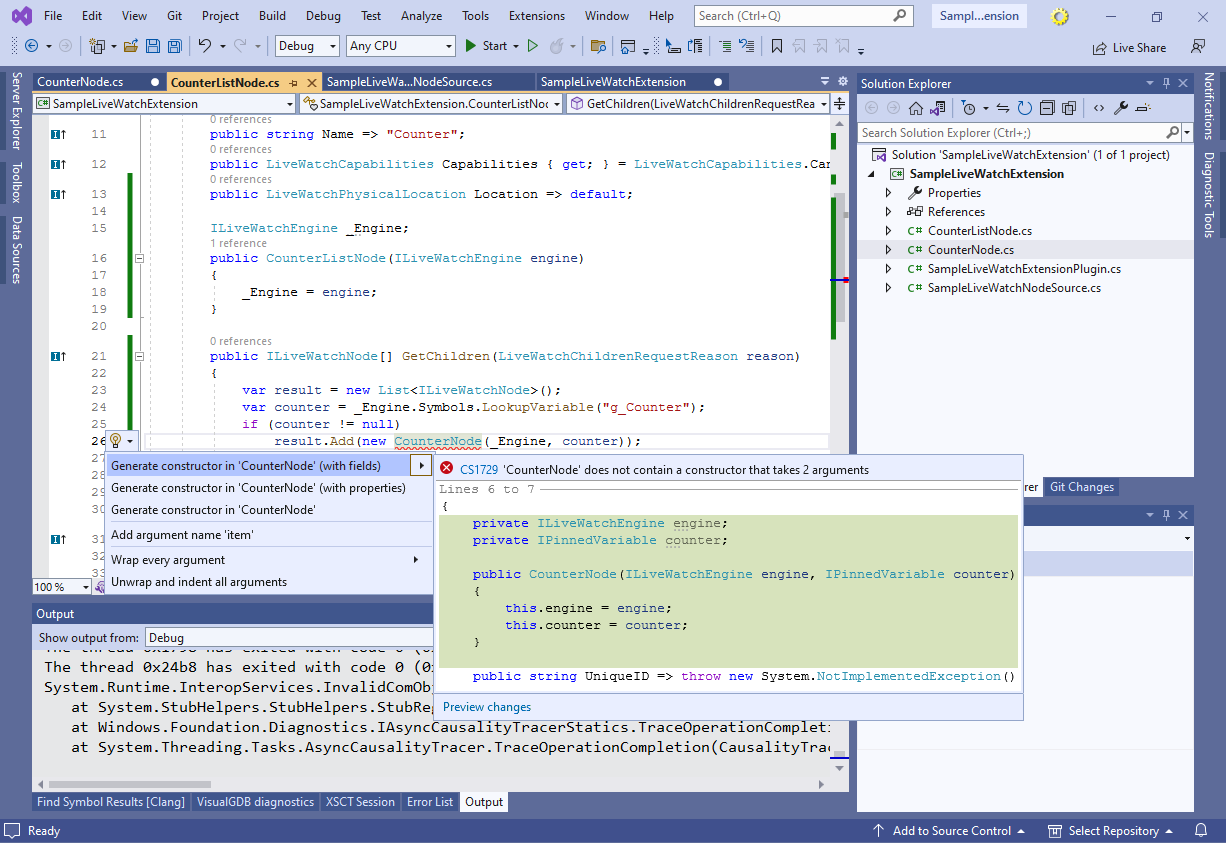
- Go back to the CounterNode instantiation and generate a constructor with fields:
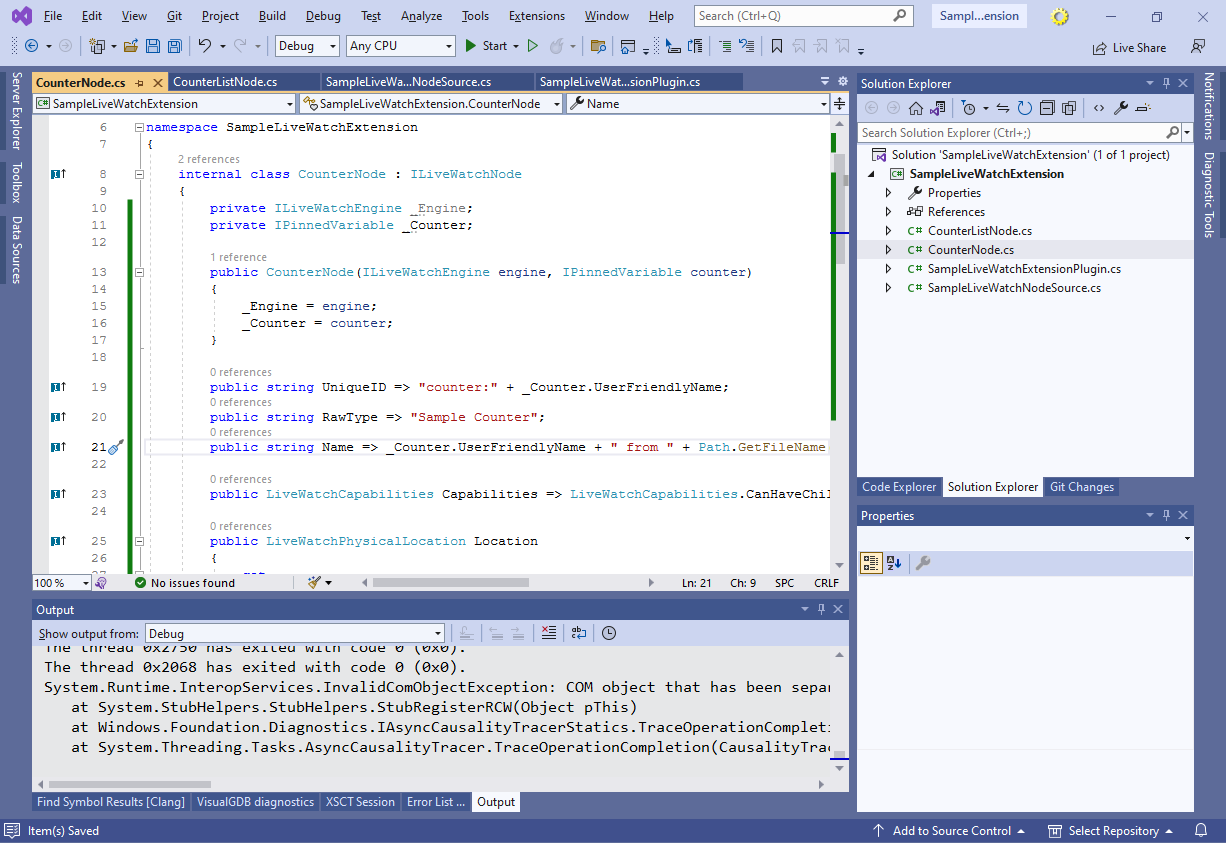
- Finally, click on the ILiveWatchNode interface name near the generated CounterNode declaration and have Visual Studio implement it for you. You can then tweak the generated implementation to look as shown below:
internal class CounterNode : ILiveWatchNode
{
	private ILiveWatchEngine _Engine;
	private IPinnedVariable _Counter;

	public CounterNode(ILiveWatchEngine engine, IPinnedVariable counter)
	{
		_Engine = engine;
		_Counter = counter;
	}

	public string UniqueID => "counter:" + _Counter.UserFriendlyName;
	public string RawType => "Sample Counter";
	public string Name => _Counter.UserFriendlyName + " from " + Path.GetFileName(_Counter.SourceLocation.File ?? "");
	public LiveWatchCapabilities Capabilities => LiveWatchCapabilities.CanHaveChildren;

	public LiveWatchPhysicalLocation Location
	{
		get
		{
			return new LiveWatchPhysicalLocation(_Counter.Address,
				_Counter.SourceLocation.File,
				_Counter.SourceLocation.Line);
		}
	}

	public void Dispose()
	{
	}

	public ILiveWatchNode[] GetChildren(LiveWatchChildrenRequestReason reason)
	{
		return null;
	}

	public void SetSuspendState(LiveWatchNodeSuspendState state)
	{
	}

	public void SetValueAsString(string newValue)
	{
		throw new NotSupportedException();
	}

	public LiveWatchNodeState UpdateState(LiveWatchUpdateContext context)
	{
		return default;
	}
}
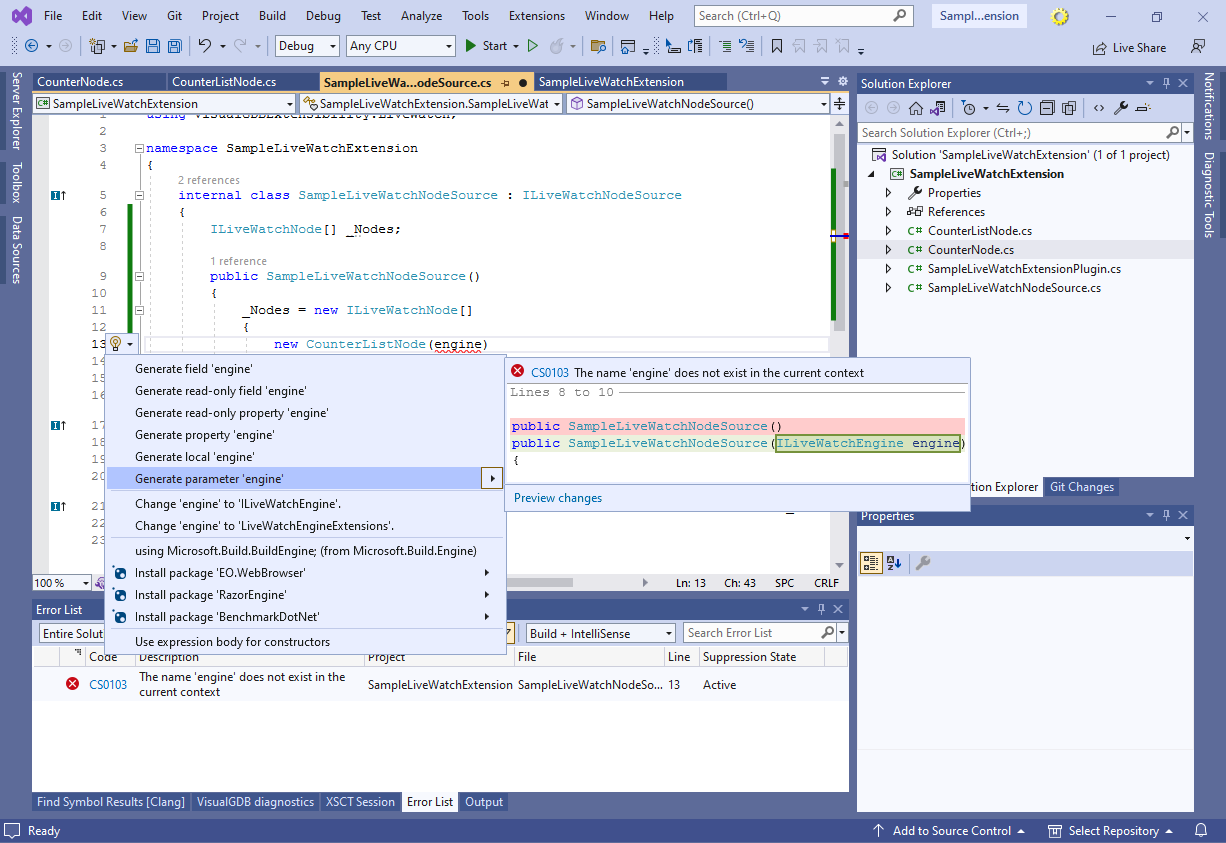
- Note that we designed the CounterNode class to keep a reference to the ILiveWatchEngine instance (.Net will automatically take care of reference counting and deallocation), and hence needed to pass it to CounterListNode. Update the SampleLiveWatchNodeSource() constructor to take a reference to it and use it when instantiating CounterListNode(). You can let Visual Studio do it for you, or simply add it manually:
- Finally, update the CreateNodeSource() method to pass the engine reference to SimpleLiveWatchNodeSource:
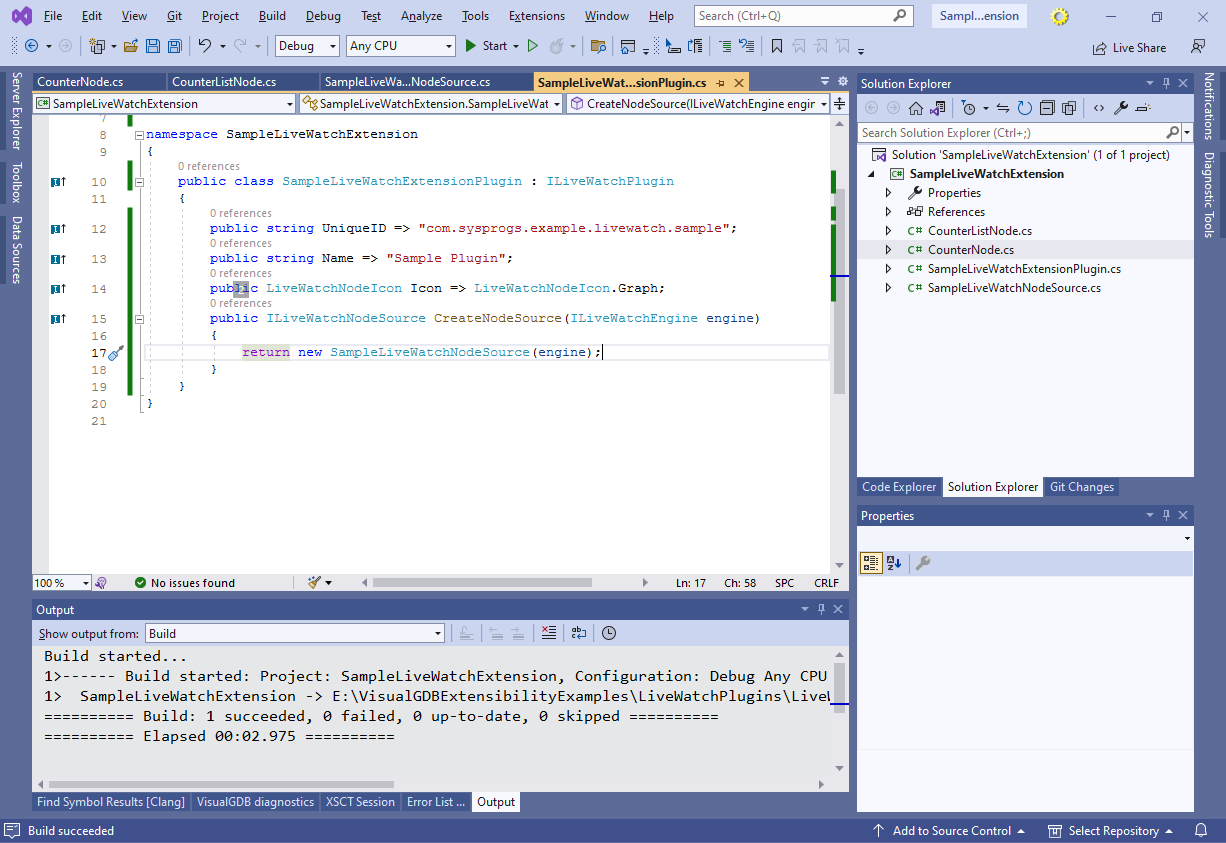
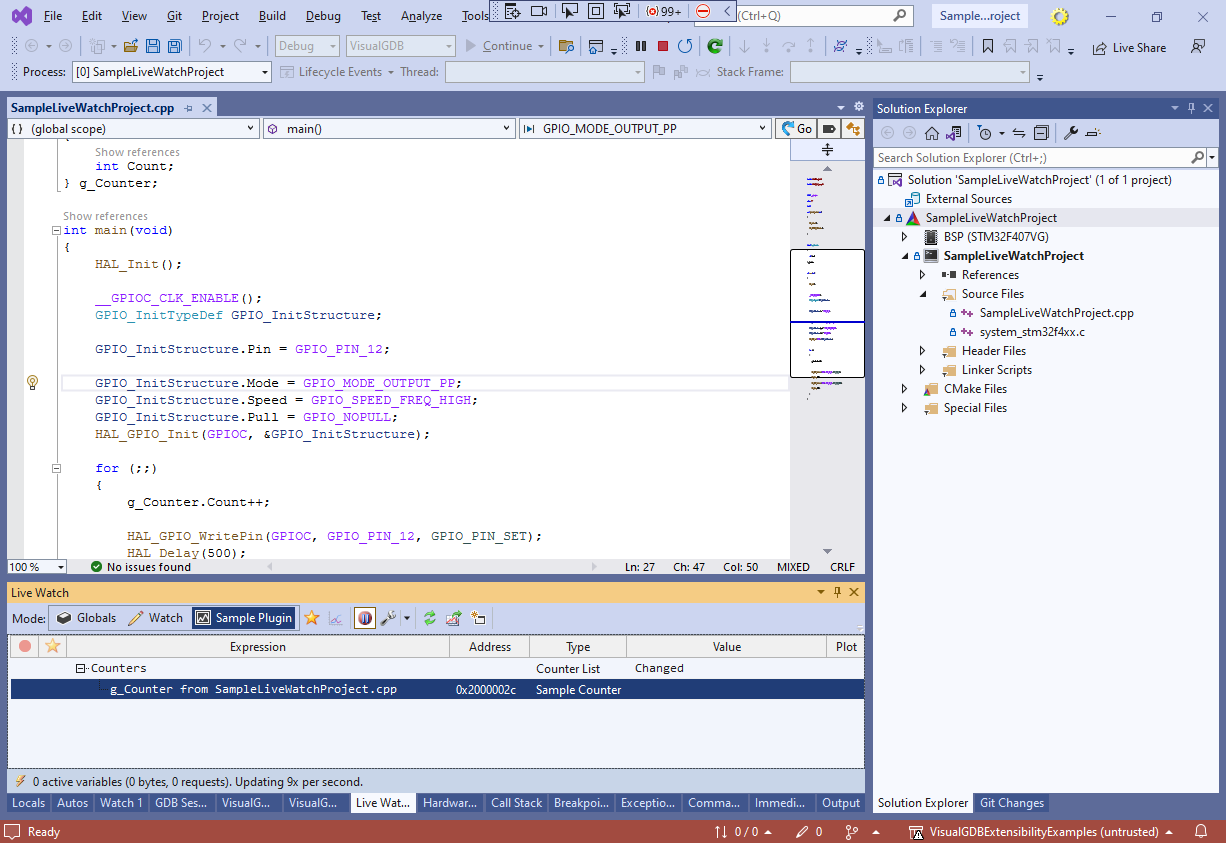
- Now you can build and run the plugin. This will open another Visual Studio instance where you can start debugging your embedded project and will see the counter node in the Live Watch view:
- If you set a breakpoint inside the CounterListNode.GetChildren() method before the child node is created for the first time, you can inspect the value of counter in the debugger. See how VisualGDB automatically determined the address and size of the variable based on the DWARF debugging symbols:
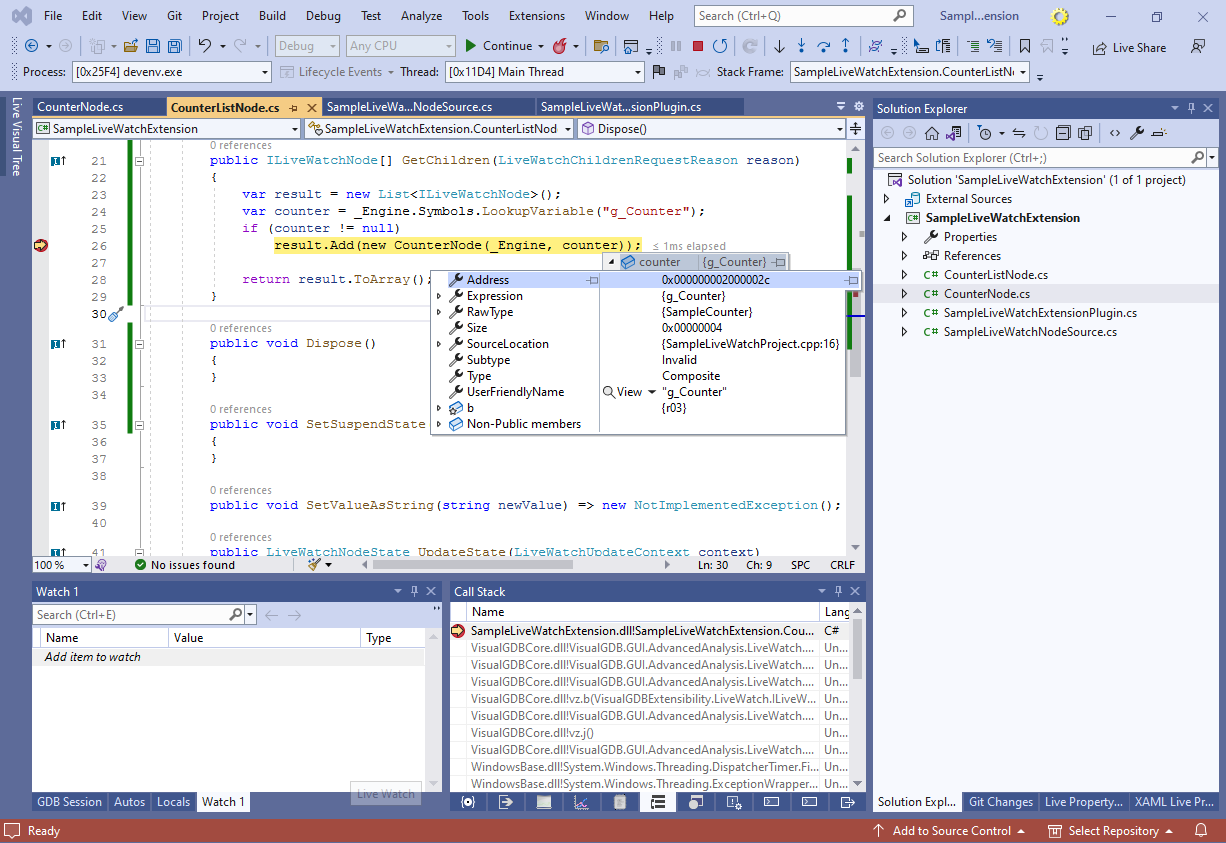 If you set the breakpoint after the variable was already shown, simply restart the embedded debug session (not the plugin debugging session) and it will be queried again.
 - Now we will modify the counter node to display the actual counter value. Set a breakpoint in its constructor, restart the embedded debug session, and once the breakpoint hits, add the following code to the constructor:
            var countField = counter.LookupChildRecursively("Count");
            if (countField != null)
            {
                _LiveVar = _Engine.CreateLiveVariable(countField);
            }
You can let Visual Studio generate the definition of _LiveVar field for you, or simply define it as “private readonly ILiveVariable _LiveVar;“.
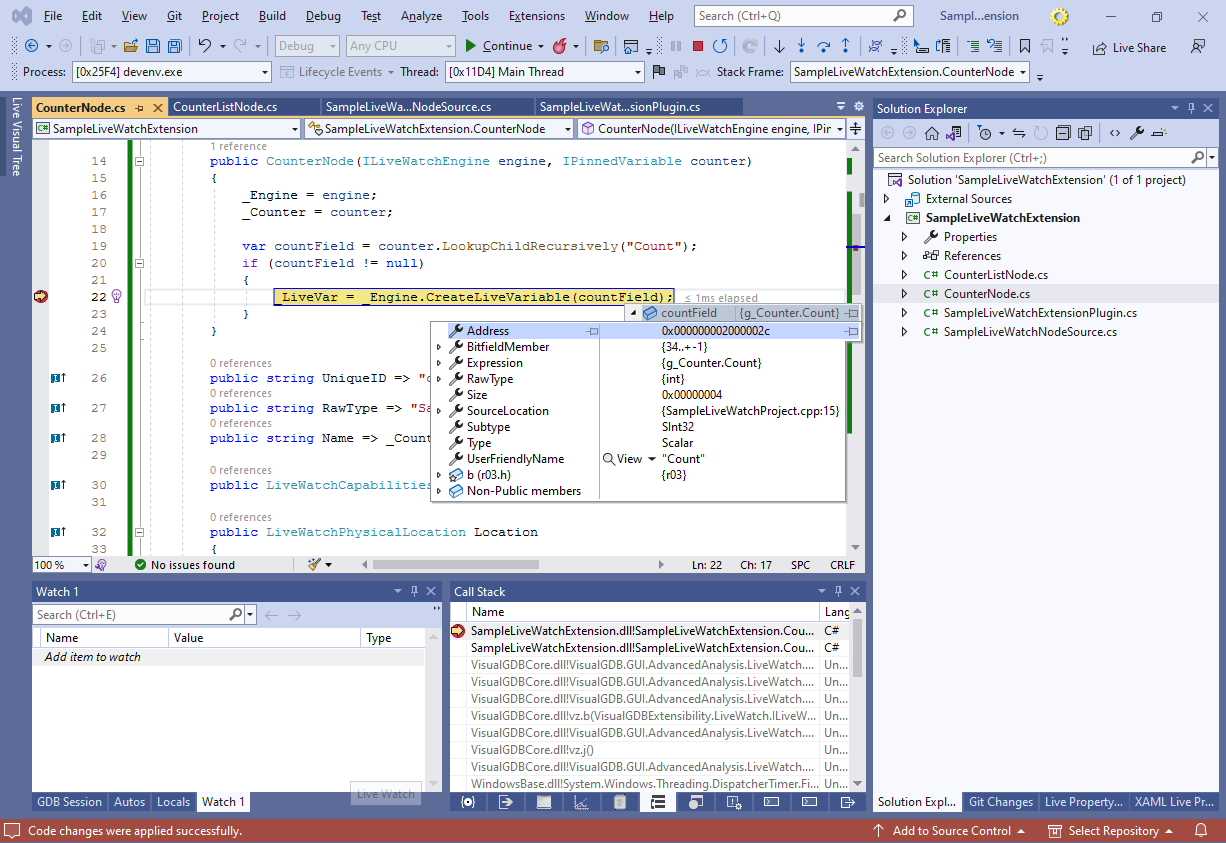
- If you step over the CreateLiveVarible() call, you will see how the live variable object knows the address and size of the variable, but doesn’t know anything about the type or layout. This is intentional – VisualGDB handles the target symbols via the ILiveSymbolParser interface (engine.Symbols) and the actual target memory via ILiveMemoryManager (engine.Memory):
- Set a breakpoint in the UpdateState() method and once it triggers, add the following code there:
        public LiveWatchNodeState UpdateState(LiveWatchUpdateContext context)
        {
            var state = new LiveWatchNodeState();
            var value = _LiveVar.GetValue();
            if (value.IsValid)
                state.Value = value.ToUlong().ToString();

            return state;
        }
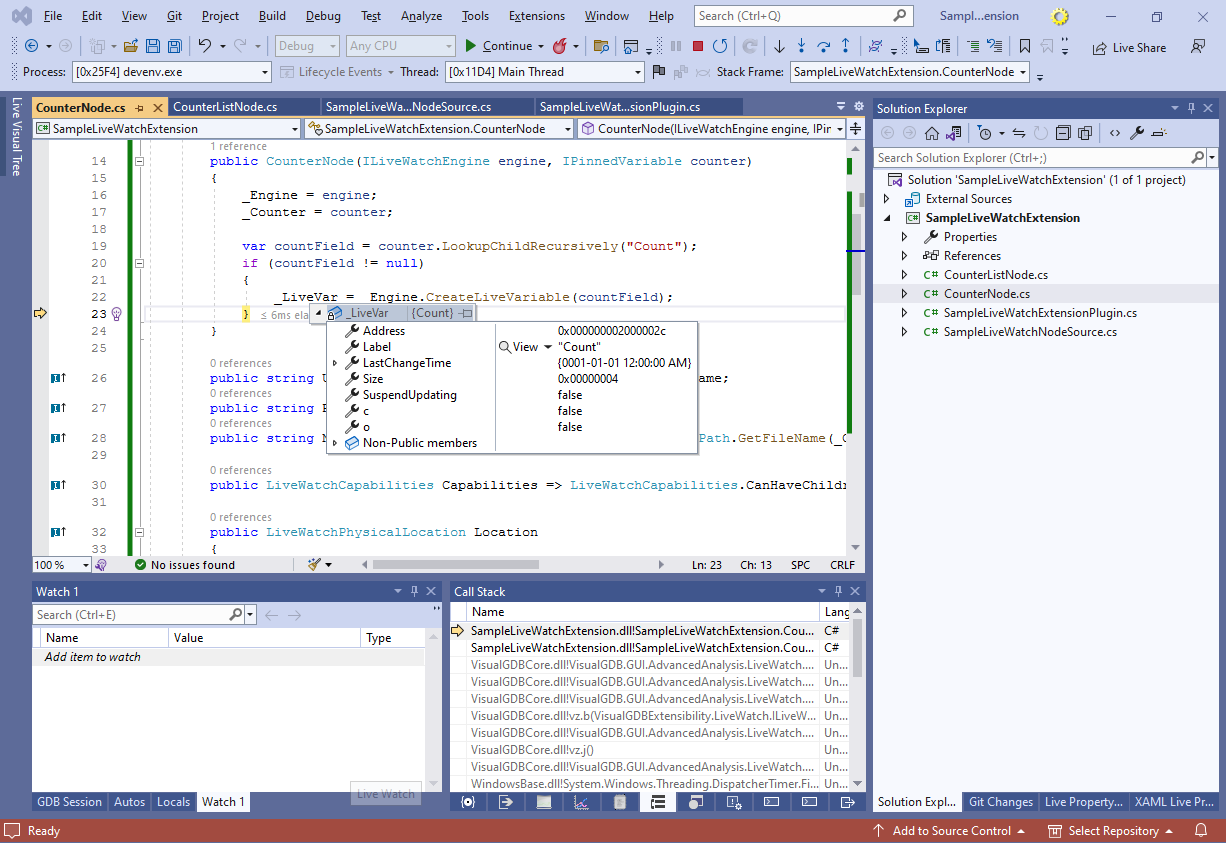
Step through it to see how the value of the variable is just a raw array of bytes with a timestamp:

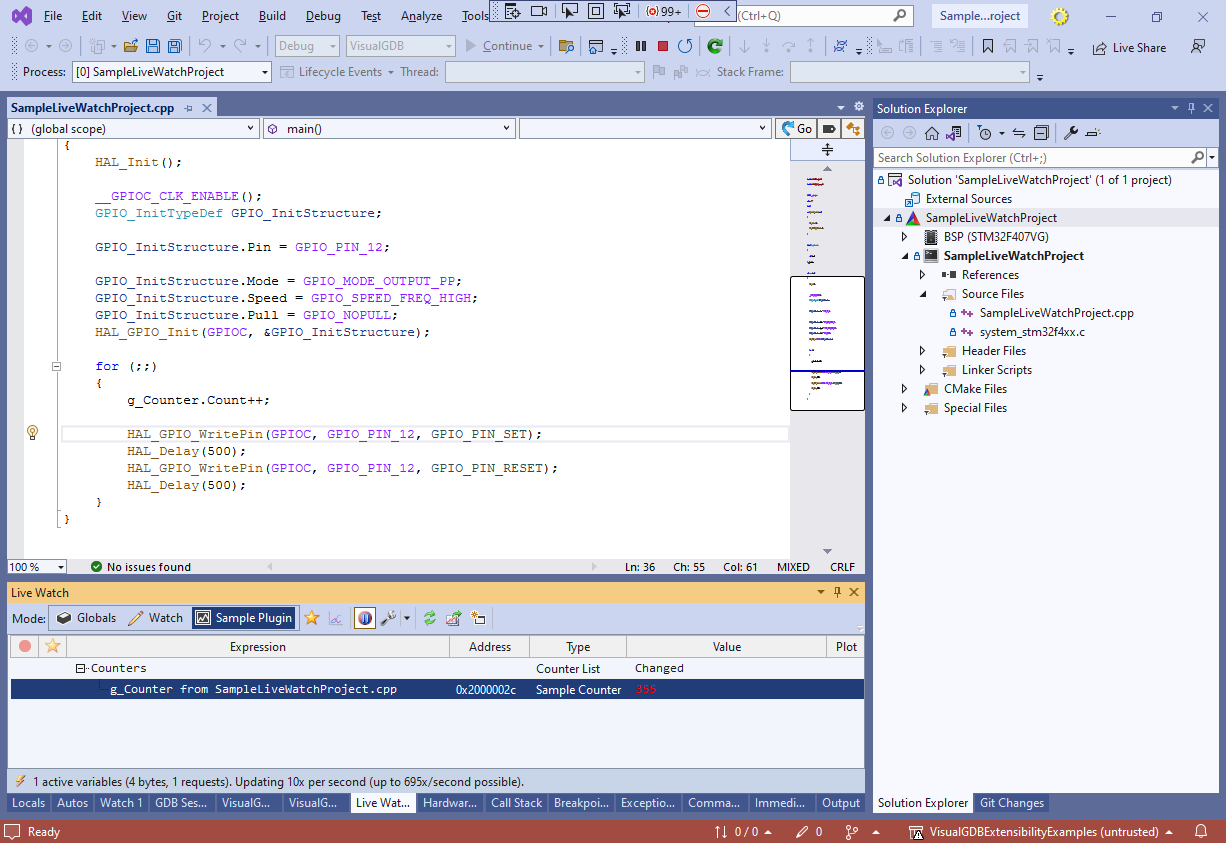
- Remove the breakpoint and resume the execution. The counter value will now appear in the “Value” column for the node:
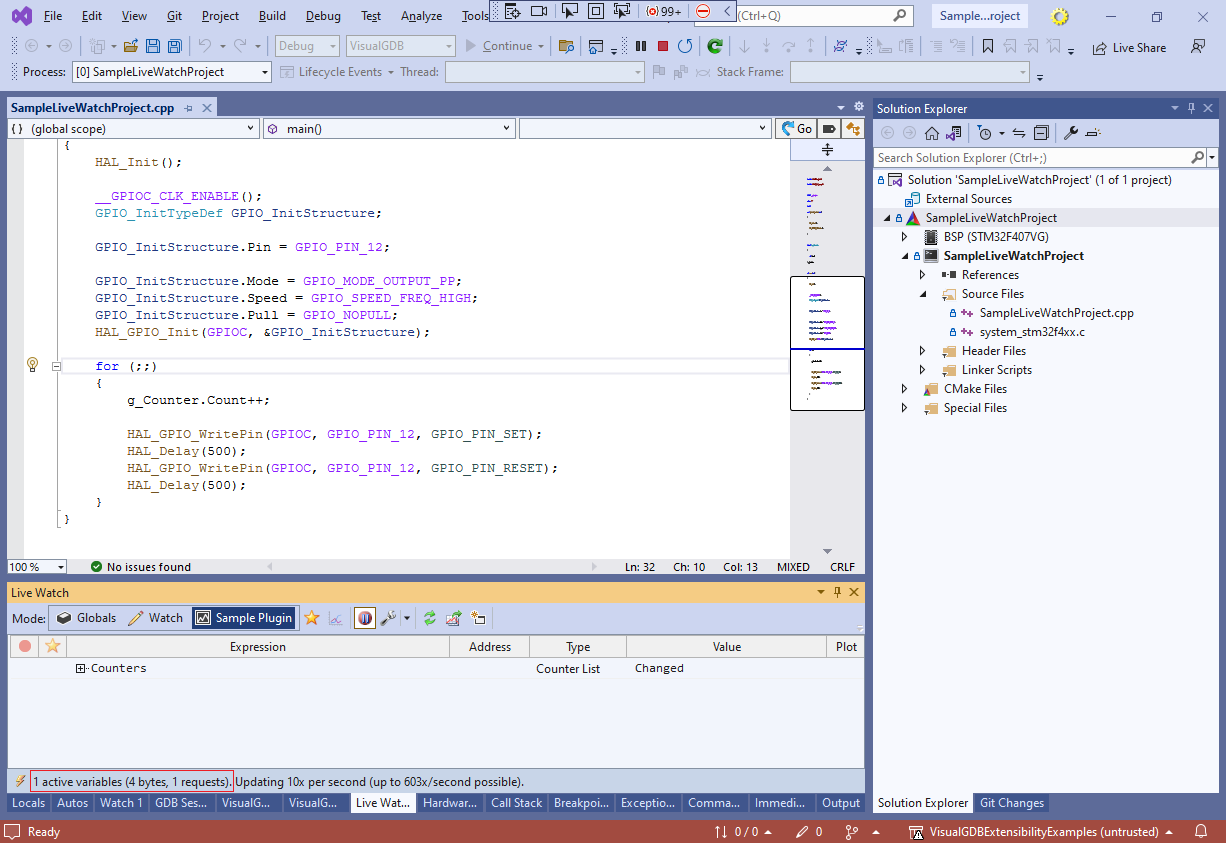
- Before we go any further, try collapsing the Counters list and take a note of the active variable count below:
 Despite having hidden the CounterNode, the underlying live variable is still being queried. This is not a problem for 1 node, but if your program had 1000 counters and you were only observing one of them, it would lower the performance quite a bit!
 - In order to avoid it, we will need to add some logic to the SetSuspendState() method. Set a breakpoint there and try collapsing the Counters list again:
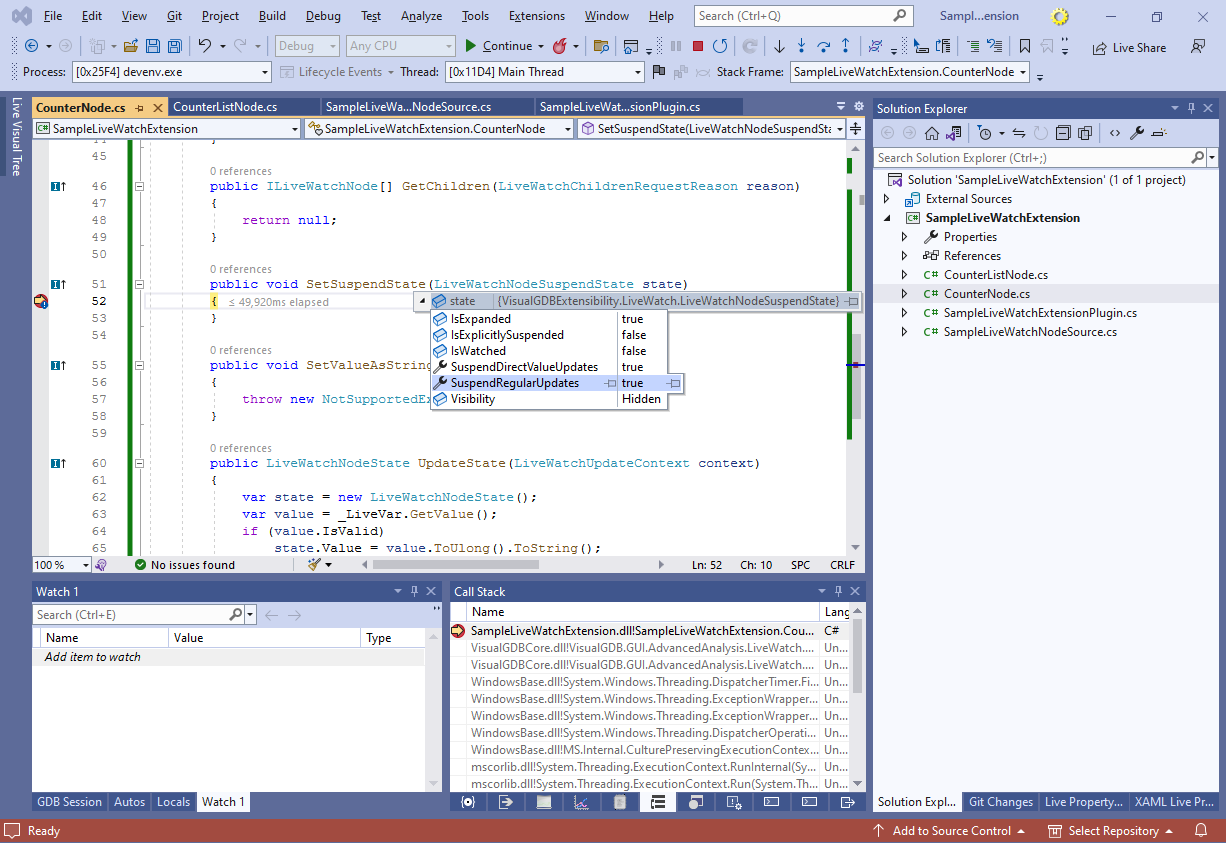 Note how SetSuspendState() got called, indicating that the node is hidden. VisualGDB distinguishes visible nodes, hidden nodes (e.g. if they are scrolled out), hidden nodes with visible children, and hidden but otherwise monitorred (e.g. plotted) nodes. In most cases, you can rely on the SuspendRegularUpdates and SuspendDirectValueUpdates properties. If the node is not directly visible and not plotted, the SuspendDirectValueUpdates will be set to true. If none of the node’s children are visible either, SuspendRegularUpdates will turn to true as well. You can use these fields to set the SuspendUpdating field of the live variable:
        public void SetSuspendState(LiveWatchNodeSuspendState state)
        {
            if (_LiveVar != null)
                _LiveVar.SuspendUpdating = state.SuspendRegularUpdates;
        }
If you resume the program now, collapsing the counter list will automatically reduce the number of active variables to 0:
 It is also recommended to dispose of the _LiveVar variable in the CounterNode’s Dispose() method (“?.” stands for “do it if _LiveVar is not null“):
        public void Dispose()
        {
            _LiveVar?.Dispose();
        }
VisualGDB will call the node’s Dispose() method when the node was permanently deleted, and calling _LiveVar.Dispose() will remove the variable from the updated variable list. In this tutorial, however, it is not strictly necessary: the list of counters does not change throughout the debug session, and disposing of the live variable at the end of the debug session will not change anything anymore, as VisualGDB stops polling the target memory at that time.
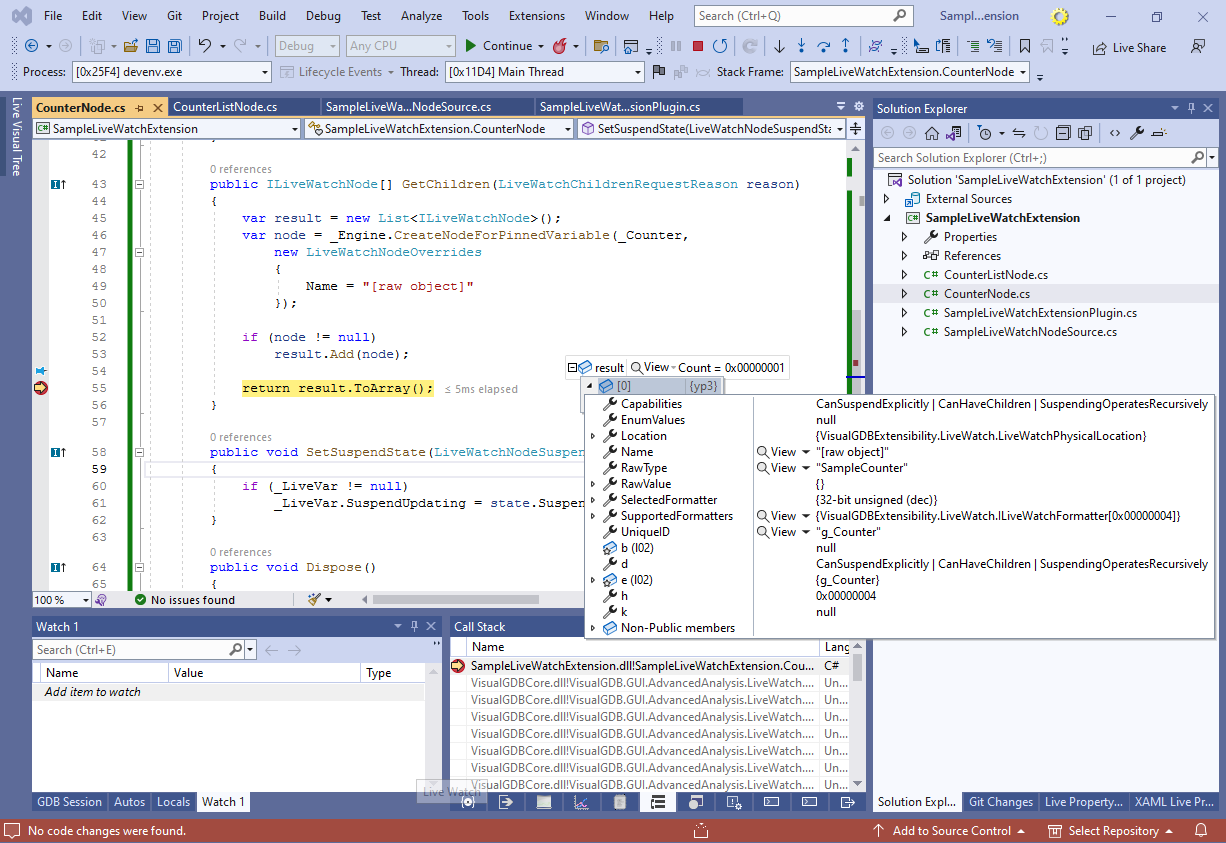
- Now we will change the CounterNode logic to show the original live variable (of type “struct SampleCounter“) with all of its fields. This can be done by calling CreateNodeForPinnedVariable() and returning it from the list of children as shown below:
        public ILiveWatchNode[] GetChildren(LiveWatchChildrenRequestReason reason)
        {
            var result = new List<ILiveWatchNode>();
            var node = _Engine.CreateNodeForPinnedVariable(_Counter,
                new LiveWatchNodeOverrides
                {
                    Name = "[raw object]"
                });

            if (node != null)
                result.Add(node);

            return result.ToArray();
        }
Nodes created via this interface will automatically handle suspension, plotting, cleanup, etc, so you won’t need to worry about it:
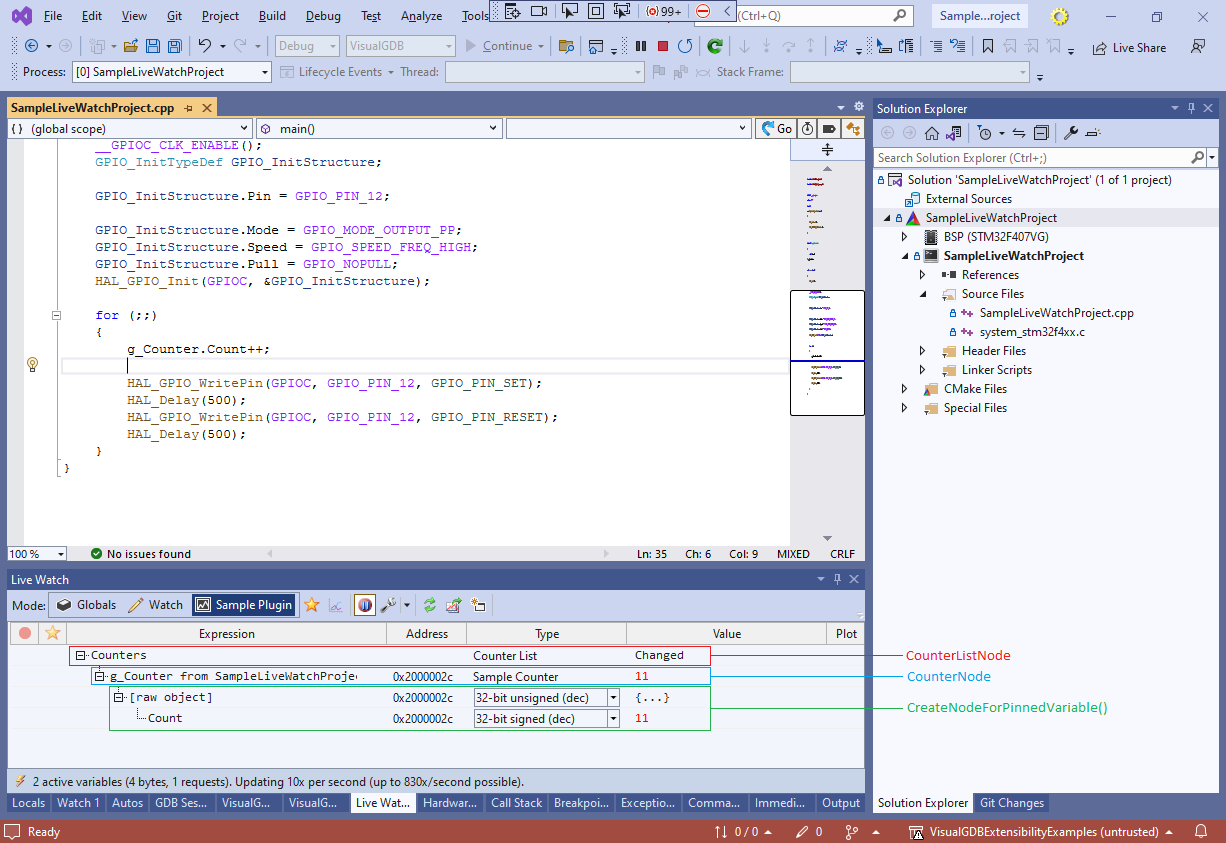
- Resume the debug session. Note how the Live Watch window now contains 4 nodes: the counter list node, the counter node, and the raw g_Counter node (with the name overridden to [raw object]) that is automatically managed by VisualGDB and creates its children when expanded:
- If you are frequently using Live Watch, consider setting it to activate at the beginning of each session via the Tool Window Behavior Configurator:

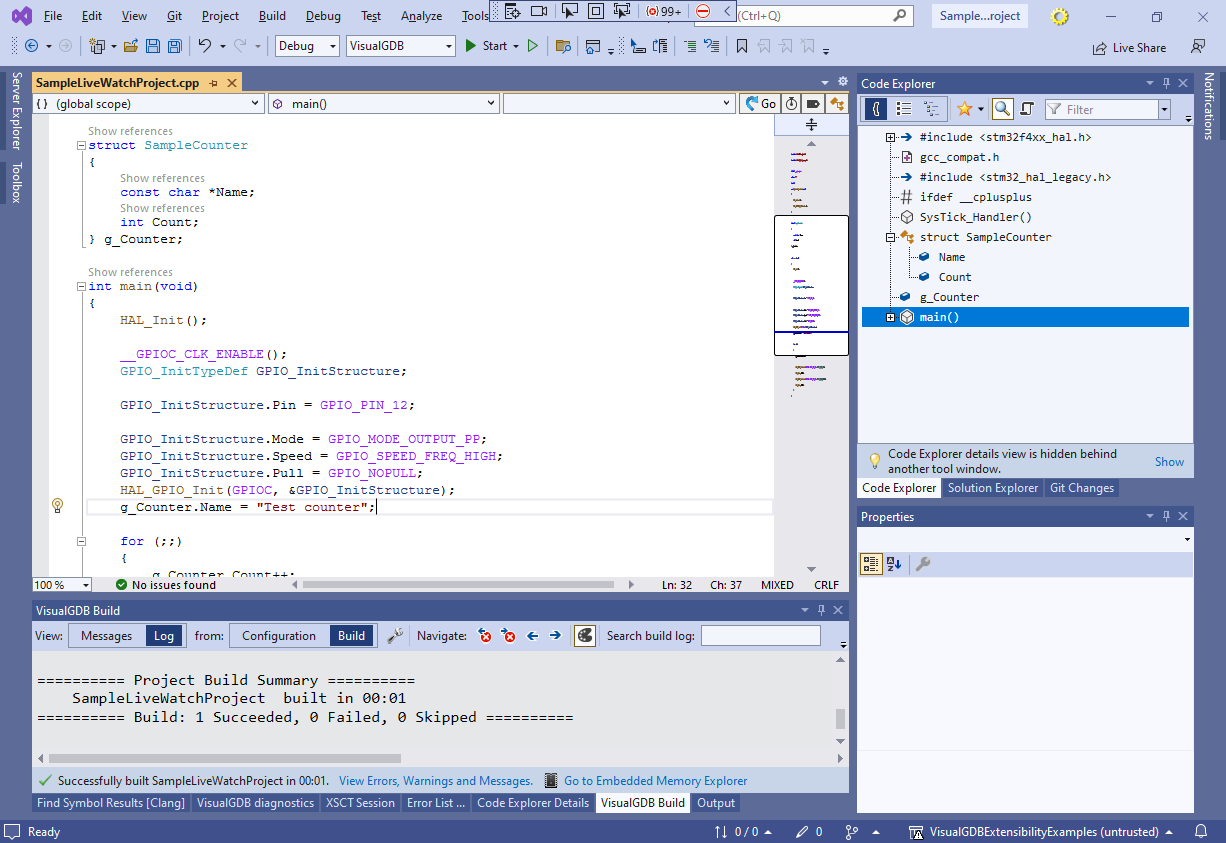
- Showing the value of the only structure field in a custom Live Watch node won’t help the debugging a lot, however combining the values of multiple fields in a meaningful summary line could. We will demonstrate it by parsing and showing custom names for the counter objects. First, add a Name field to the SampleCounter struct and set it to “Test counter” inside main():
- Then, go to the constructor of CounterNode(), locate the Name field and create a live variable if it is found:
            if (counter.LookupChildRecursively("Name") is IPinnedVariable nameField)
                _NameVar = _Engine.CreateLiveVariable(nameField);
If you are new to C#, the “if (<…> is IPinnedVariable nameField)” is just a shorthand for declaring the nameField variable and checking that it’s not null in one statement.

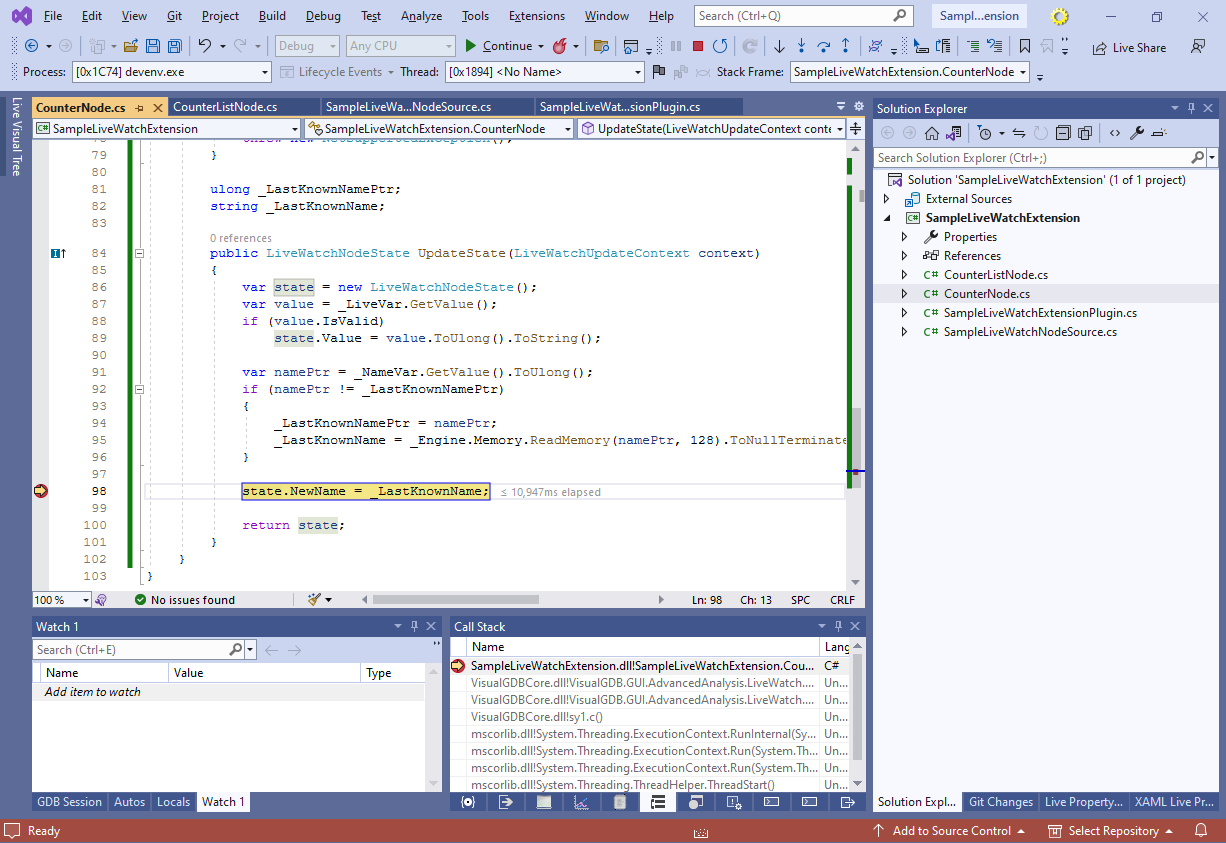
- Add the _LastKnownNamePtr and _LastKnownName fields as shown below and update the UpdateState() method to read the name from the ‘Name’ field:
            var namePtr = _NameVar.GetValue().ToUlong();
            if (namePtr != _LastKnownNamePtr)
            {
                _LastKnownNamePtr = namePtr;
                _LastKnownName = _Engine.Memory.ReadMemory(namePtr, 128).ToNullTerminatedString();
            }
            state.NewName = _LastKnownName;
 Note that the actual memory accesses on the target will look as follows:
- VisualGDB will automatically read both Name (just pointer) and Count fields before updating any Live Watch nodes because we have created (and not suspended) the corresponding Live Variable objects. Because the fields are adjacent, they both will be read within 1 sequential read operation. Non-sequential would also be grouped by VisualGDB to minimize latency.
- When UpdateState() is invoked by VisualGDB, it calls the GetValue() method that immediately returns the value read in the previous step.
- If the value of the pointer has changed, the plugin will call ReadMemory() that will read the actual target memory, adding some latency. However, because we only re-read the actual string contents when the pointer changes, it should not happen too often.
- If you resume the debug session now, you will see that the name of the CounterNode changed to “Test Counter”:
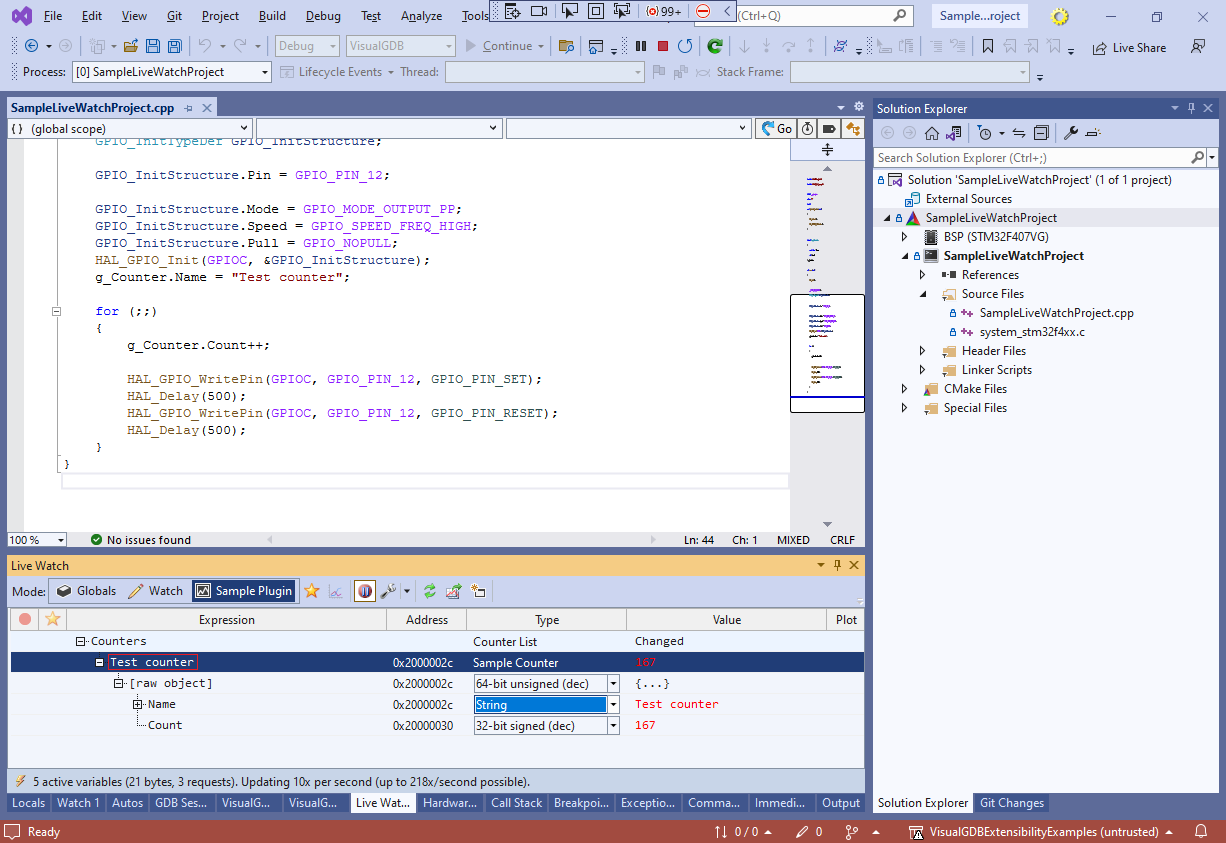 Also note how the [raw object] node now shows both fields of the SampleCounter struct because VisualGDB maintains this node automatically.
 - If you carefully compare the node for the Count field against the “Test Counter” node created by the plugin, you will notice that the Count node supports breakpoints and plotting, but the plugin’s node does not:
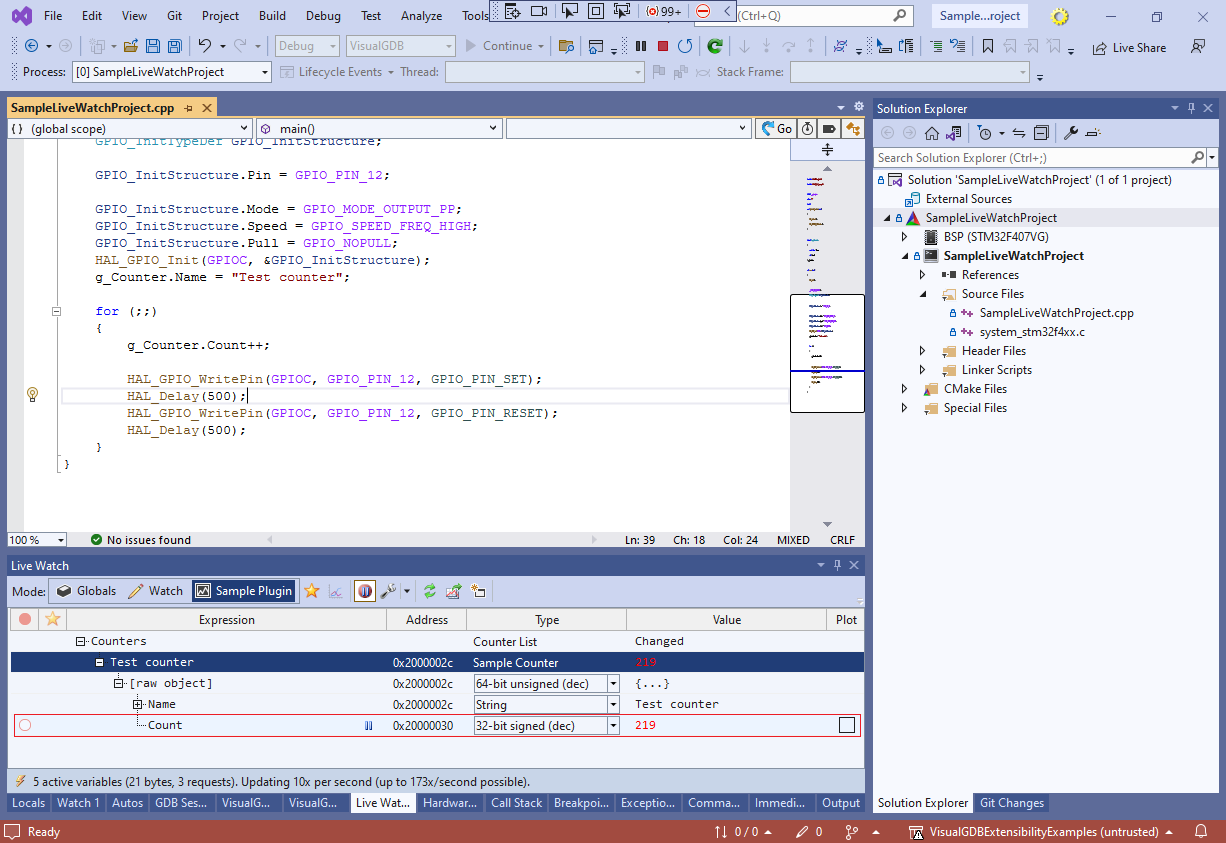 This happens because plotting and breakpoints require the node to report some additional information (raw value and the means of converting it to a number). We will fix it in the next step.
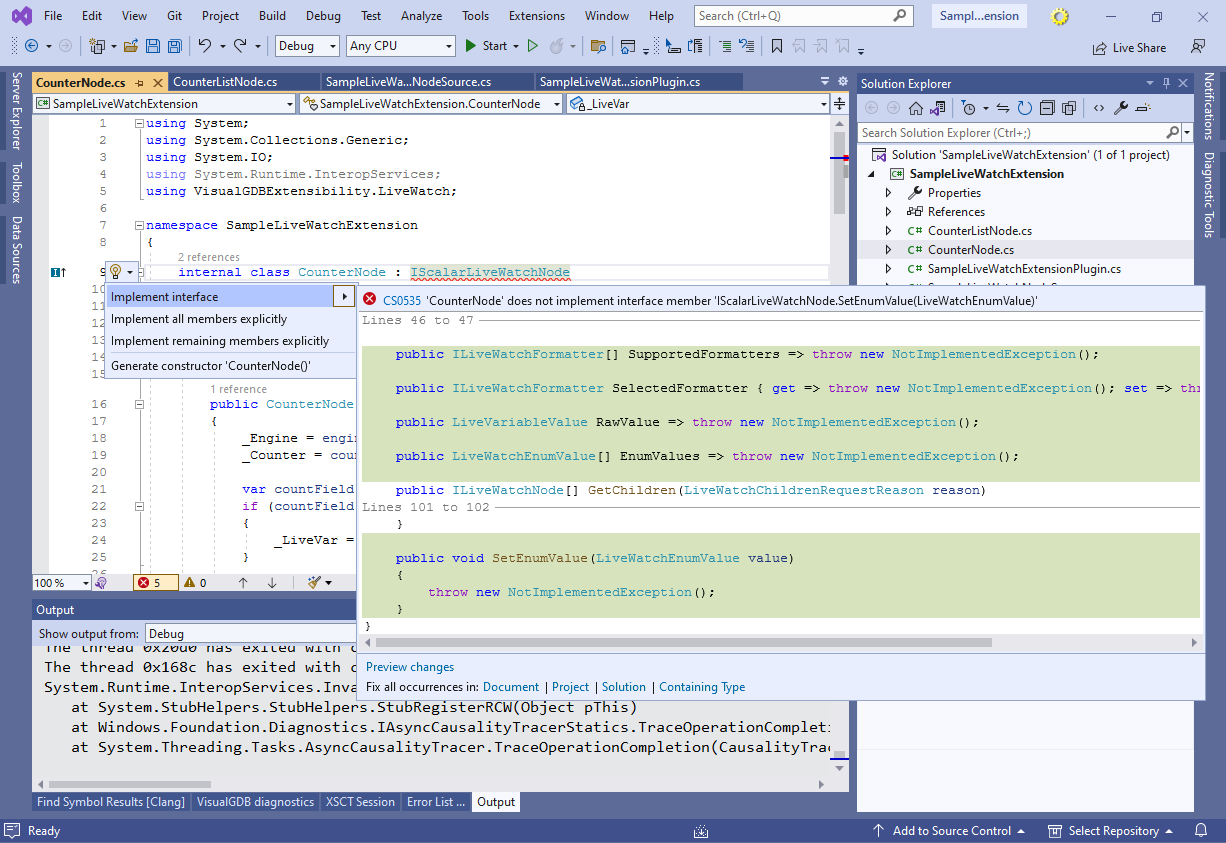
 - Change the CounterNode class to implement the IScalarLiveWatchNode interface. Visual Studio can automatically generate the missing method/property implementations for you:
 Also, update the node capabilities accordingly:
public LiveWatchCapabilities Capabilities => LiveWatchCapabilities.CanHaveChildren | LiveWatchCapabilities.CanPlotValue | LiveWatchCapabilities.CanSetBreakpoint;
- Update the property implementations as shown below:
        public ILiveWatchFormatter[] SupportedFormatters { get; }
        public ILiveWatchFormatter SelectedFormatter { get; set; }
        public LiveVariableValue RawValue { get; private set; }
        public LiveWatchEnumValue[] EnumValues => null;
If you are new to C#, here’s a quick explanation of the property syntax:
- SupportedFormatters is a read-only property that can only be set in a constructor, and will always return the value set in the constructor.
- SelectedFormatter is a read-write property that can be set by this class, or by VisualGDB when you select a formatter in the Live Watch window.
- RawValue is a read-write property, that can be read by everyone, but set anywhere within this class.
- EnumValues is a read-only property (basically, a function looking like a field) that always returns null when called.
- Add the following 2 lines to the end of the CounterNode’s constructor:
            SupportedFormatters = _Engine.GetFormattersForSize(4, ScalarVariableType.UInt32);
            SelectedFormatter = SupportedFormatters?.FirstOrDefault();
The SupportedFormatters correspond to the format list (e.g. 32-bit unsigned (dec)) shown in the Type column of the Live Watch window. Although you could implement them yourself via this interface, it is much easier to simply have VisualGDB return a list of all formatters for 32-bit types. You can also filter them by name or ID if you wish.
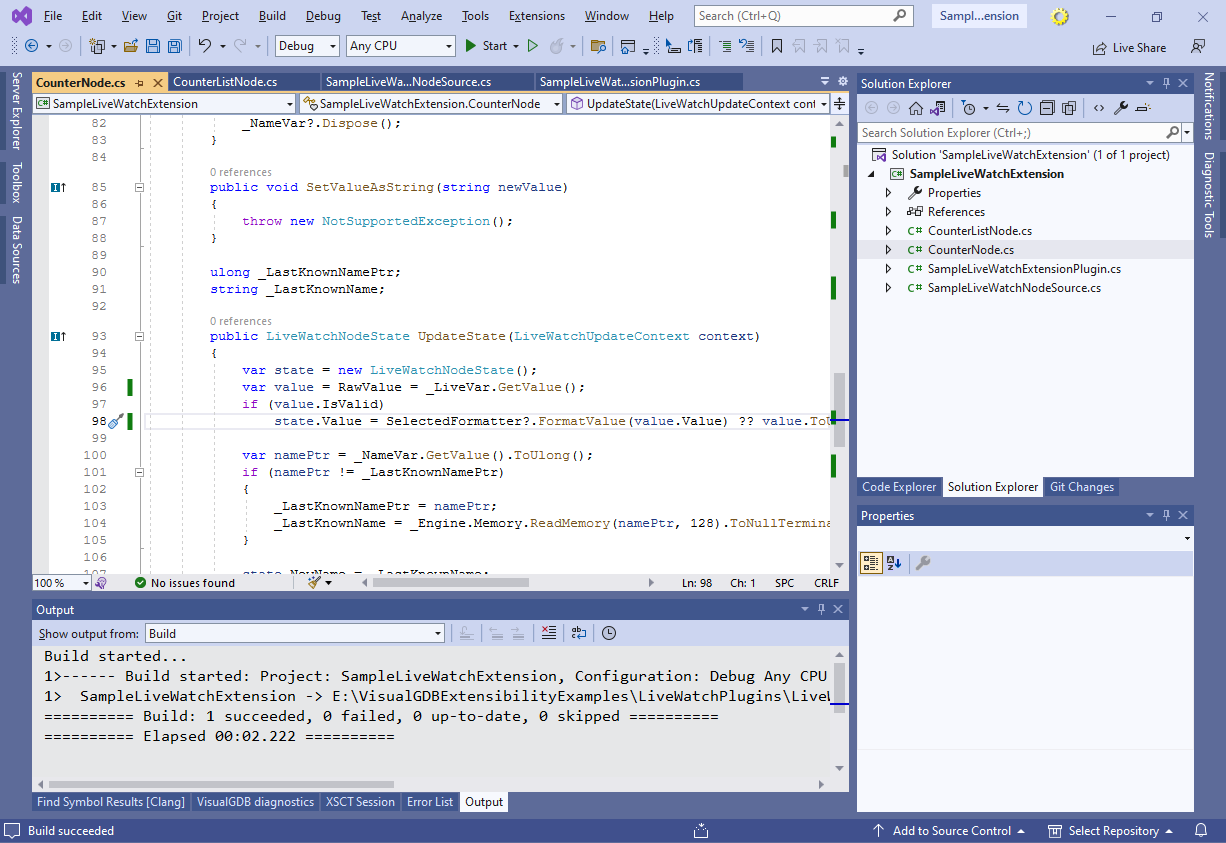
- Update the UpdateState() method to automatically set the RawValue property to the last known value of the counter, and use SelectedFormatter to convert it to a string:
var value = RawValue = _LiveVar.GetValue();
if (value.IsValid)
    state.Value = SelectedFormatter?.FormatValue(value.Value) ?? value.ToUlong().ToString();
the “?.” and “??” syntax above is a convenient way to write this:
if (SelectedFormatter != null)
    state.Value = SelectedFormatter.FormatValue(value.Value);
else
    state.Value = null;

if (state.Value == null)
    state.Value = value.ToUlong().ToString();
- Run the debugging session again. You will now be able to plot the value of the Test counter node and set live watch breakpoints on it:
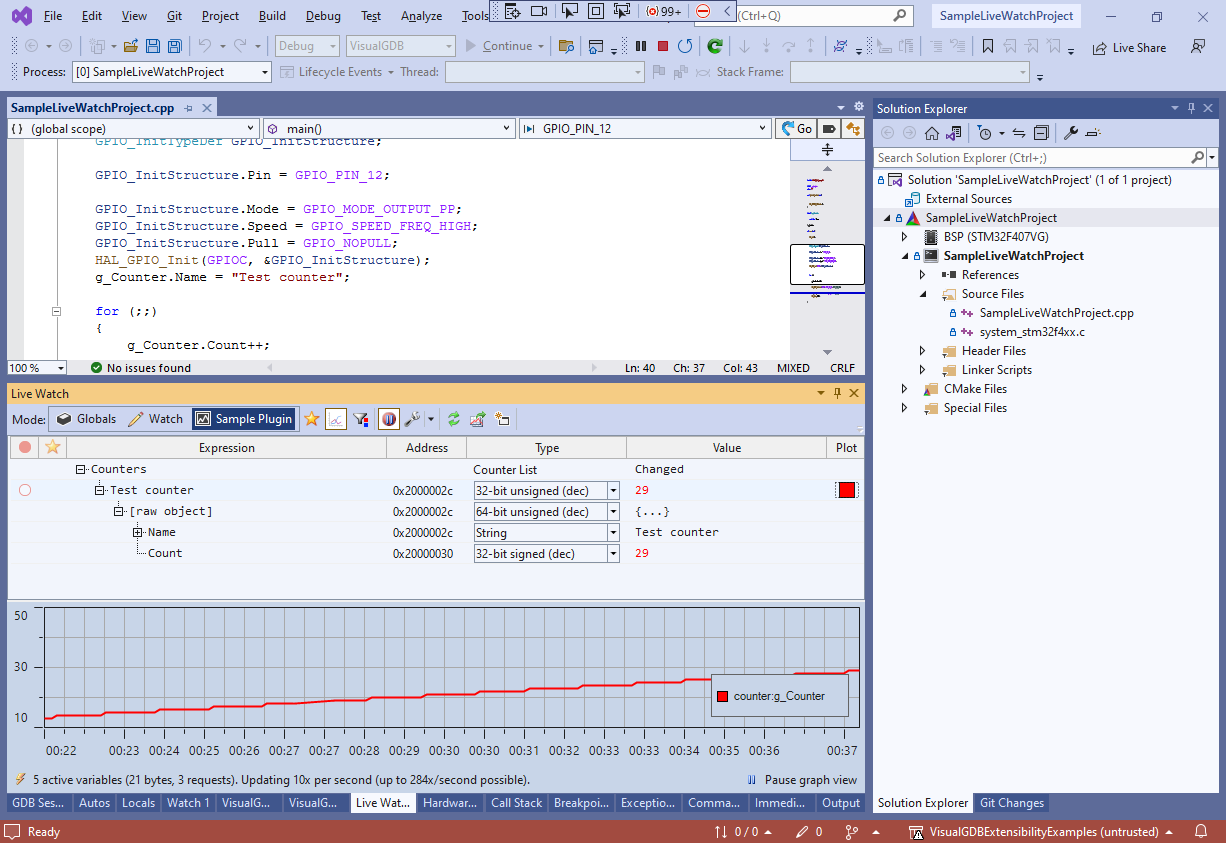 You can also now switch between the decimal and hexadecimal representation of Test Counter via the Type column. It will affect the SelectedFormatter field that is used in the UpdateState() method to convert the raw value to a string.
You can also find a detailed reference of Live Watch classes and interfaces here.
Now that you know how to create custom Live Watch nodes for your objects, see our next tutorial to learn how to discover these objects both statically and dynamically, and automatically create the nodes for them.