Debugging Linux projects on STM32MP1 Devices
This tutorial shows how to build and debug a basic Linux project for the STM32MP1 device running the OpenSTLinux distro. We will create a basic C++ application and will show how to debug and profile it from Visual Studio with VisualGDB.
Building the Linux projects for the STM32MP1 devices requires a cross-toolchain (also known as SDK) that matches the SD card image used by your board. You can obtain the SDK using one of the following methods:
- Build an SD card image and a matching SDK from sources. Follow our STM32MP1 SDK building tutorial for detailed steps. This requires setting up a separate Linux VM and normally takes several hours, but allows customizing your SD card layout by editing the bitbake scripts.
- Alternatively, download prebuilt SD card images and a toolchain from our Github page, then install the Linux cross-toolchain on your Linux VM.
It is also possible to use a Windows cross-toolchain to build STM32MP1 Linux applications, however this tutorial will show how to use the Linux-based cross-toolchain, as it is the only toolchain type that can be produced fully automatically using BitBake.
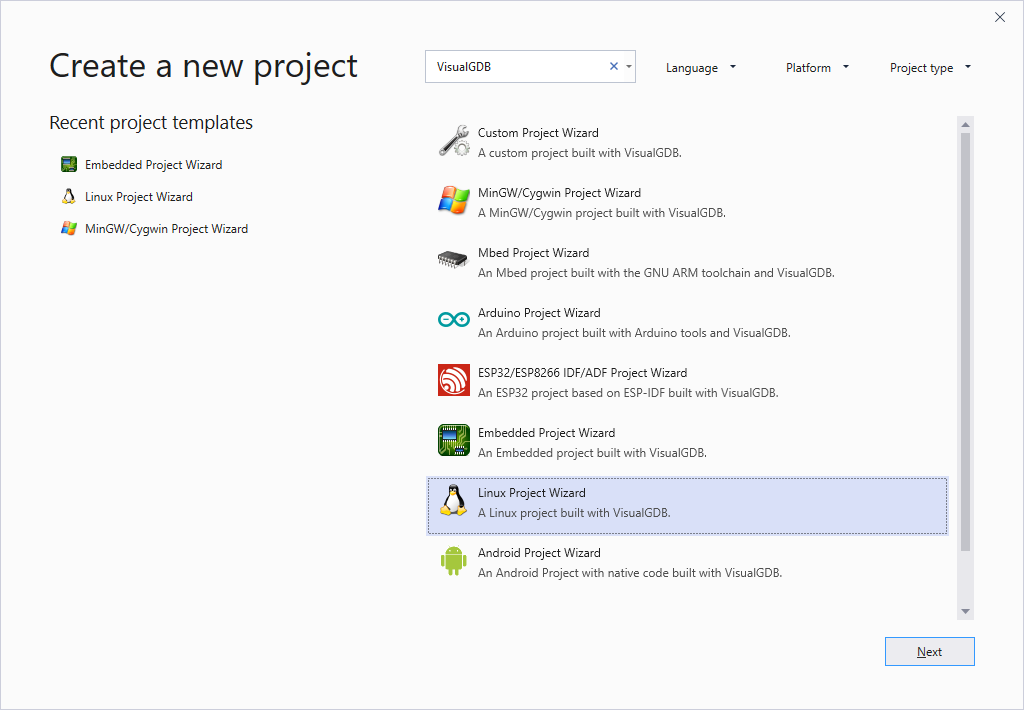
- Start Visual Studio and launch the VisualGDB’s Linux project wizard:
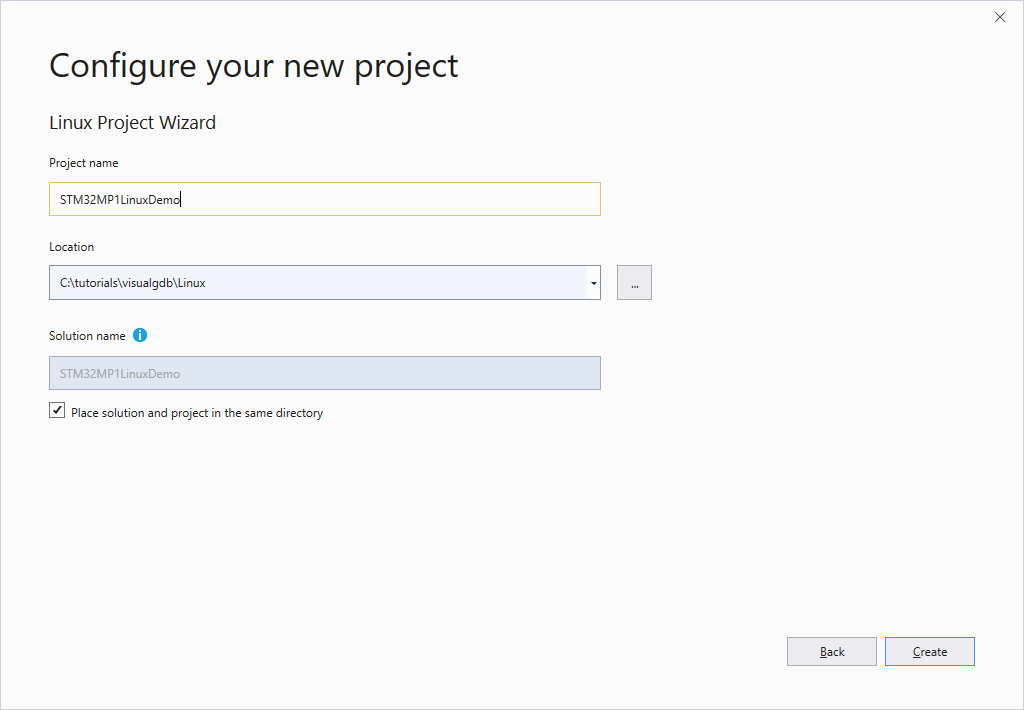
- Specify the location and name for the project you are creating:
- On the first page of the wizard select “Create a new project -> Application -> MSBuild”:

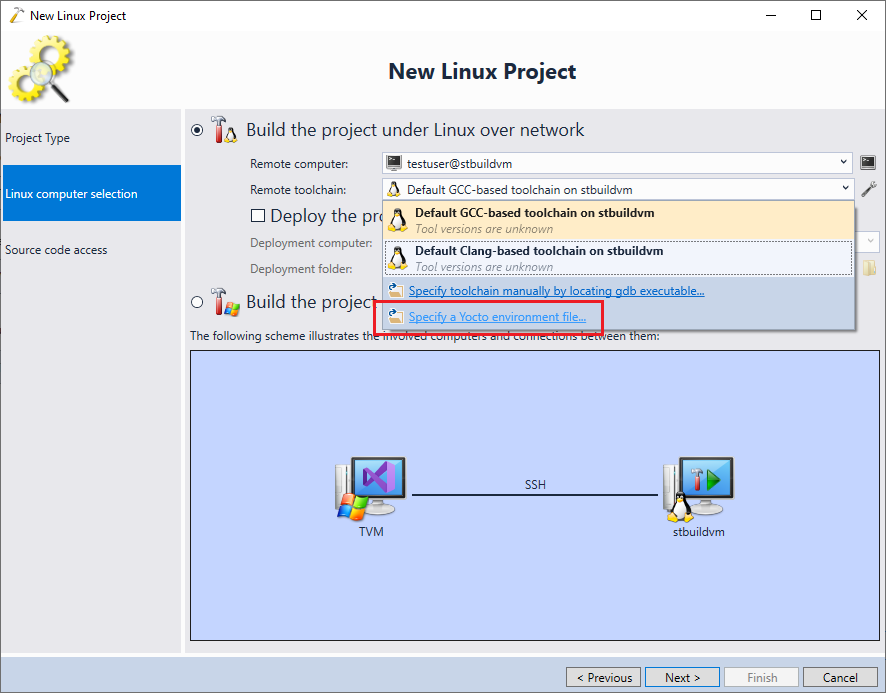
- On the second page select the Linux machine where you have installed the OpenSTLinux SDK. If you haven’t done this yet, follow this tutorial to build it from sources. Then click “Specify a Yocto environment file” in the toolchain selector:
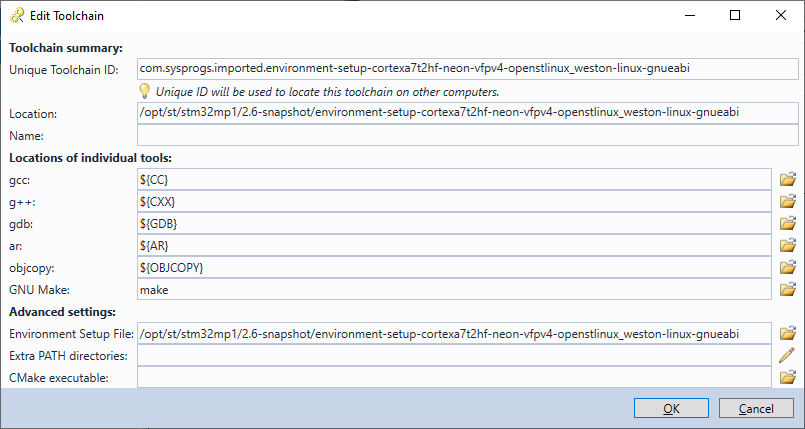
- Point VisualGDB to the environment-setup script that is a part of the SDK:

- VisualGDB will import the environment setup file and will display a summary of the compilation and debugging tools. As the Yocto environment setup files specify the tools via environment variables, most of the tool paths will simply reference those variables (e.g. ${CC}):
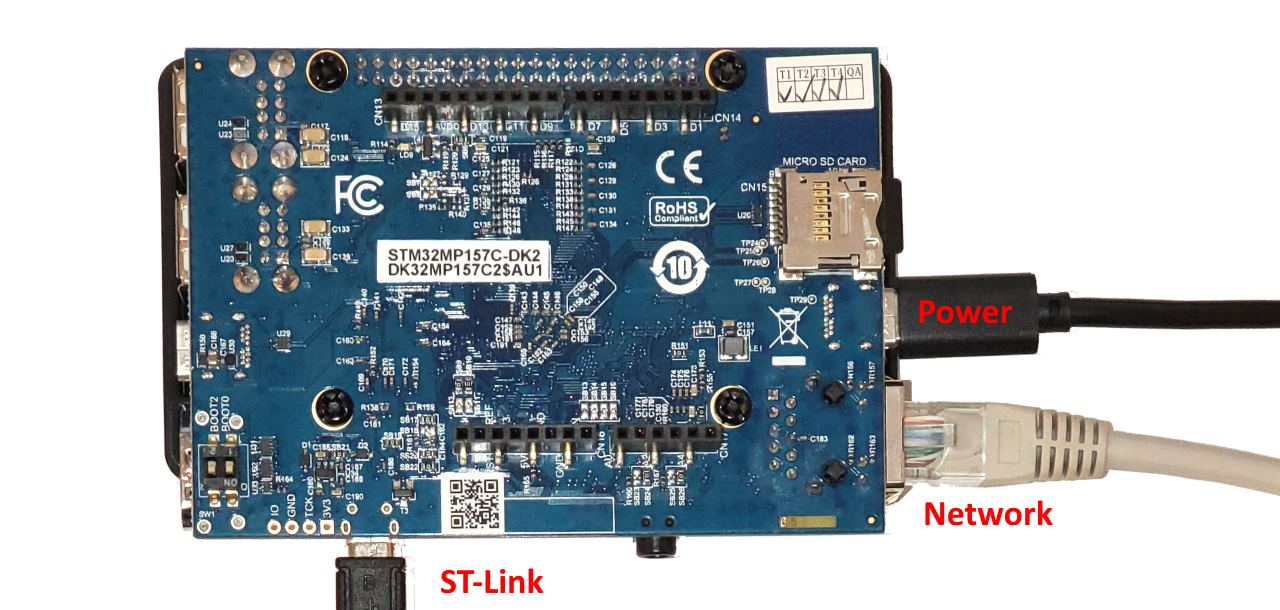
- Connect the power and the network to your STM32MP1 board and wait for it to start. Alternatively, you can connect the ST-Link’s USB connector and use the serial terminal to find out the board’s IP address and host name (the default hostname should be simply stm32mp1):
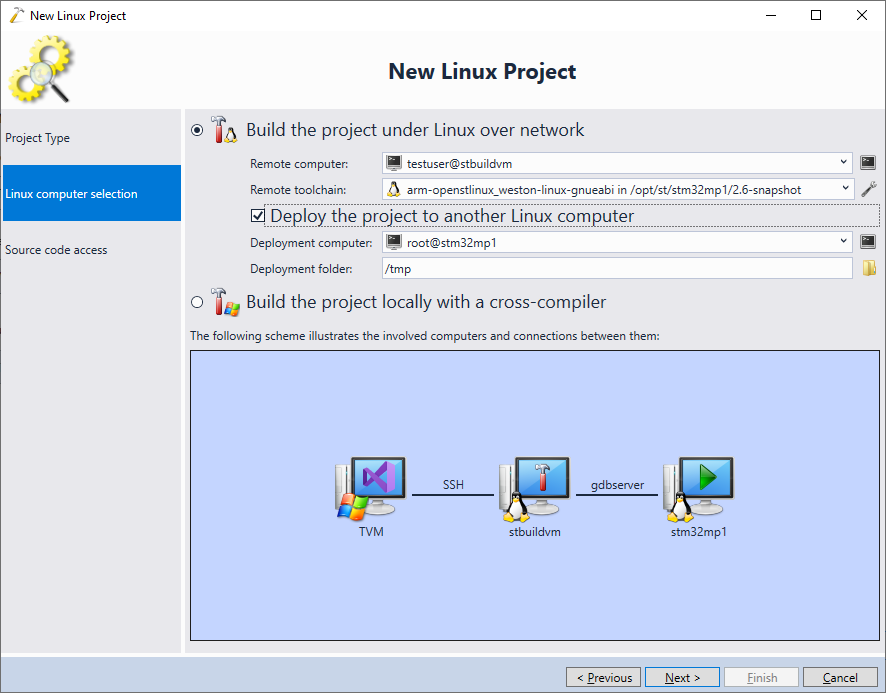
- In the VisualGDB Project Wizard check the “Deploy the project to another Linux computer” checkbox and select an SSH connection for your STM32MP1 board. If you are using the default SD card images, the host name for the board will be stm32mp1, the user name should be root and the password should be blank:
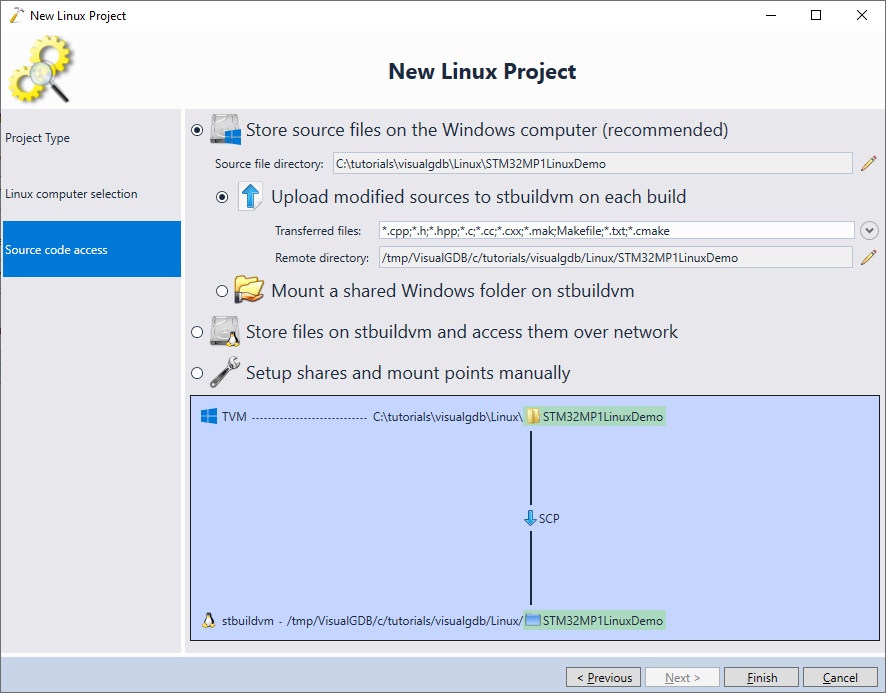
- Proceed with the default settings for storing the source code and click “Finish” to create the project:
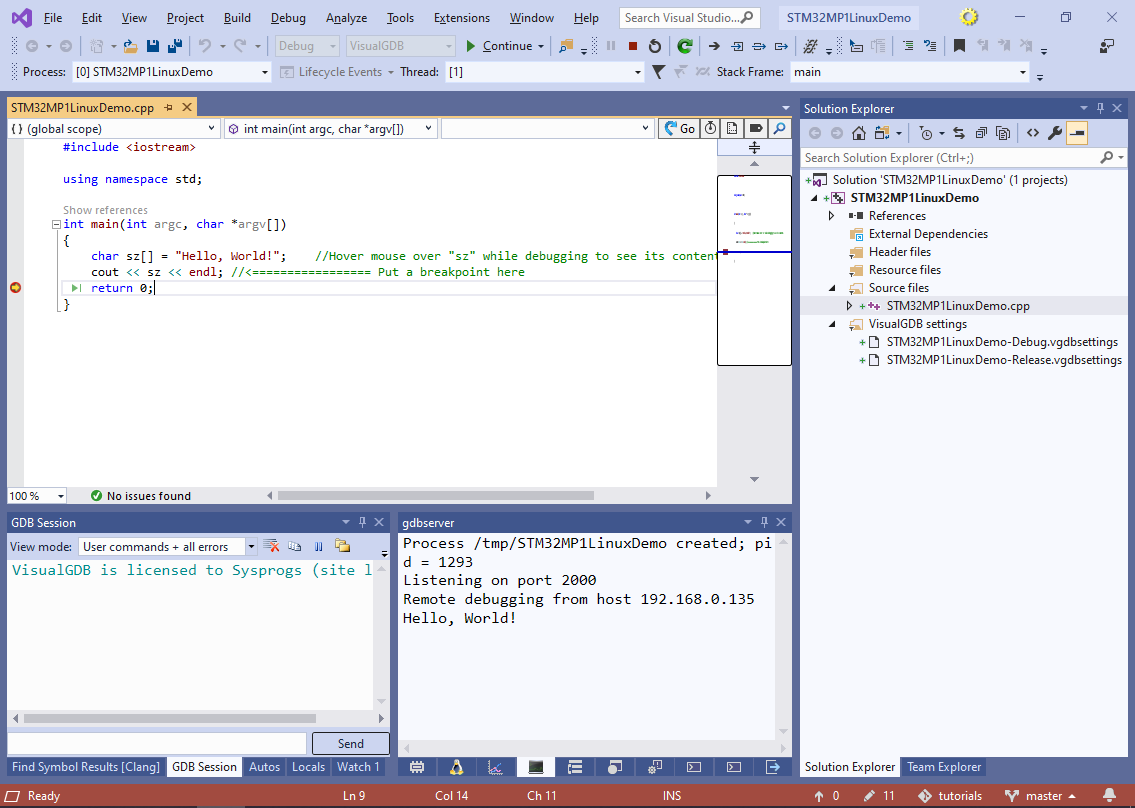
- Once VisualGDB generates the project, set a breakpoint in the main() function and press F5 to build and run it. Ensure that you see the output from the project in the gdbserver window:
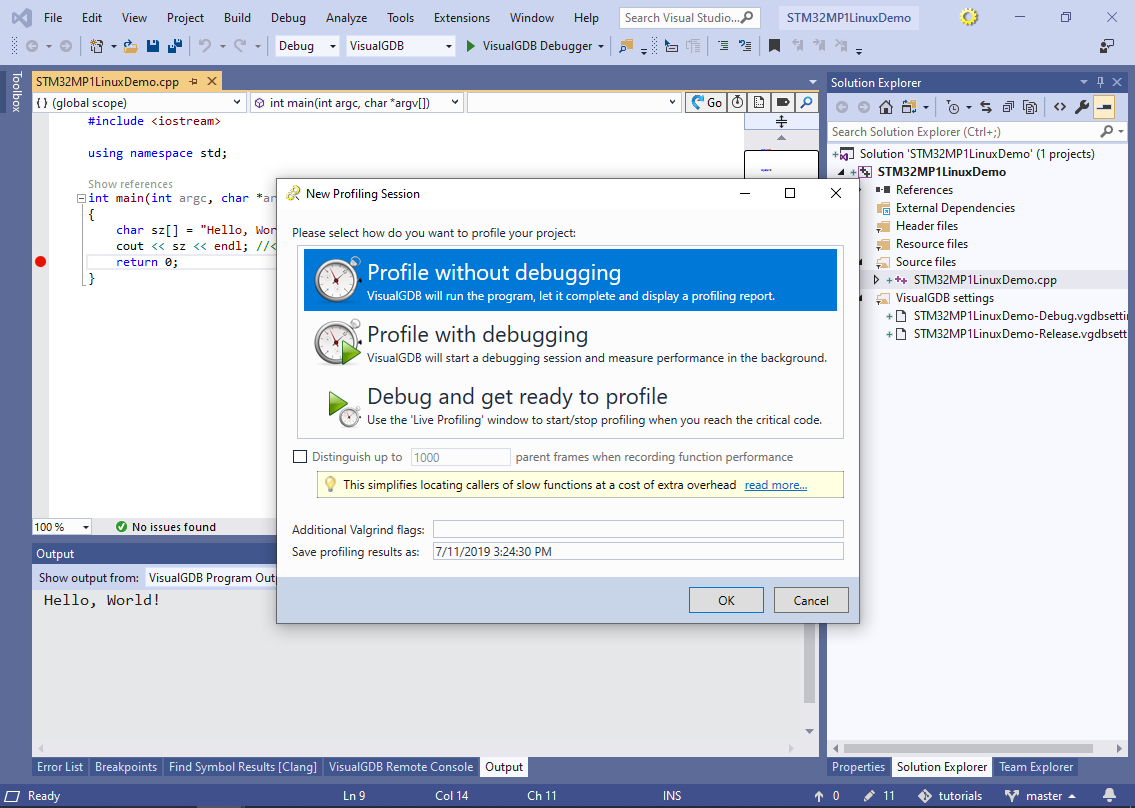
- The OpenSTLinux distro includes the valgrind profiler, so you can easily analyze the performance of your application. Select Analyze->Analyze Performance with VisualGDB->Profile withotu debugging:
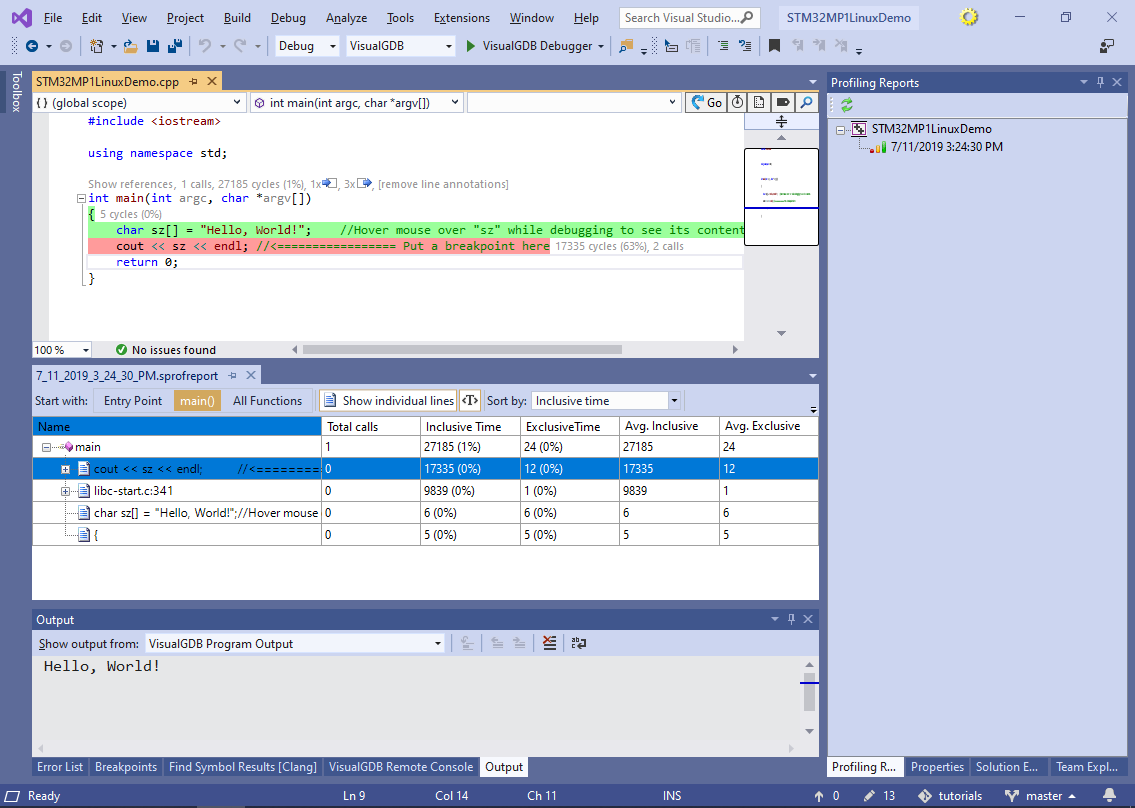
- This will launch a profiling session, showing the amount of CPU time spent in each function and each line of the code:
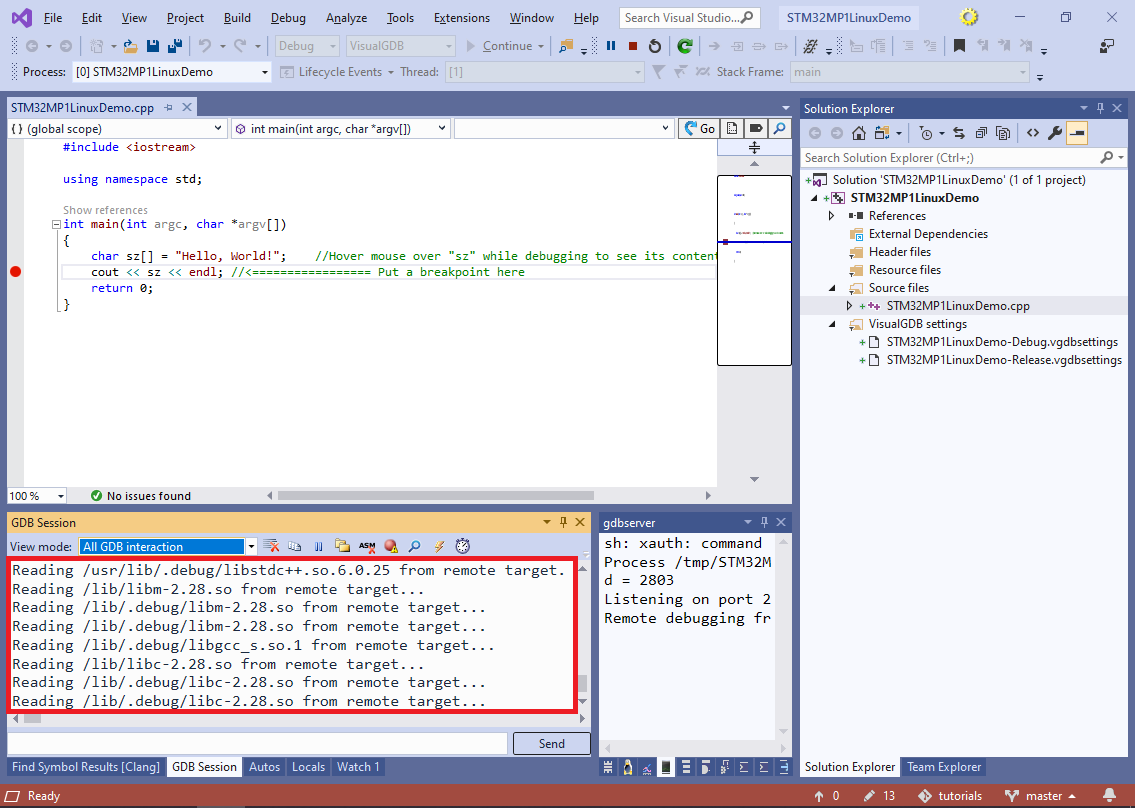
- Note that if you are using the default settings, starting a debug session will take several seconds. If you switch the GDB Session window to the “All GDB Interaction” mode, you will see that most time is spent by gdb downloading shared libraries from the target:
- This can be eliminated by explicitly specifying sysroot – the location of the build machine containing copies of various system headers and libraries. Normally it would be located under the sysroots/cortexa7t2hf-neon-vfpv4-openstlinux_weston-linux-gnueabi subfolder inside the OpenSTLinux SDK. Add the “set sysroot <sysroot path>” command to the additional GDB commands field in VisualGDB Project Properties:
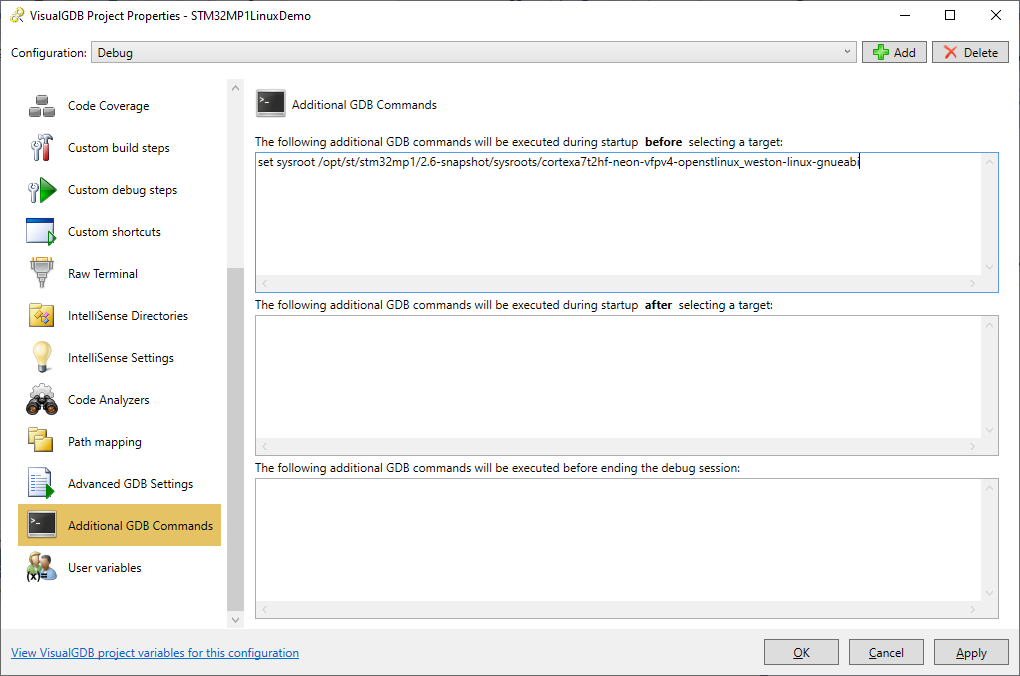 Now the debug sessions will start much faster because gdb will use the libraries from the sysroot folder instead of downloading them from the STM32MP1 board.