Creating MinGW64 applications with Visual Studio
This tutorial shows how to create a MinGW64-based application with Visual Studio and debug it with VisualGDB.
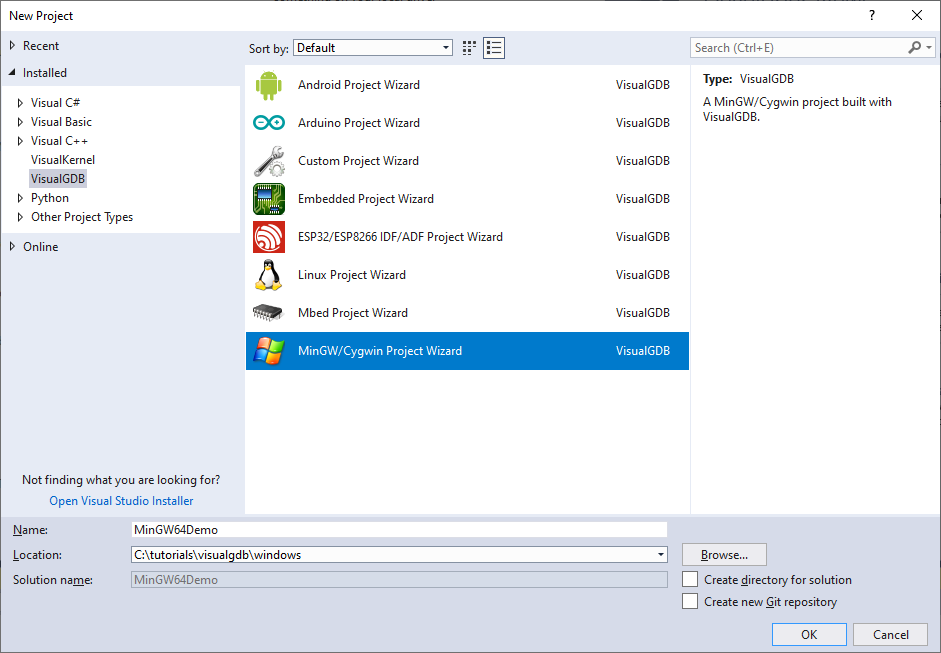
- Download and install VisualGDB. Open Visual Studio, select File->New Project->VisualGDB and pick the MinGW/Cygwin project wizard:
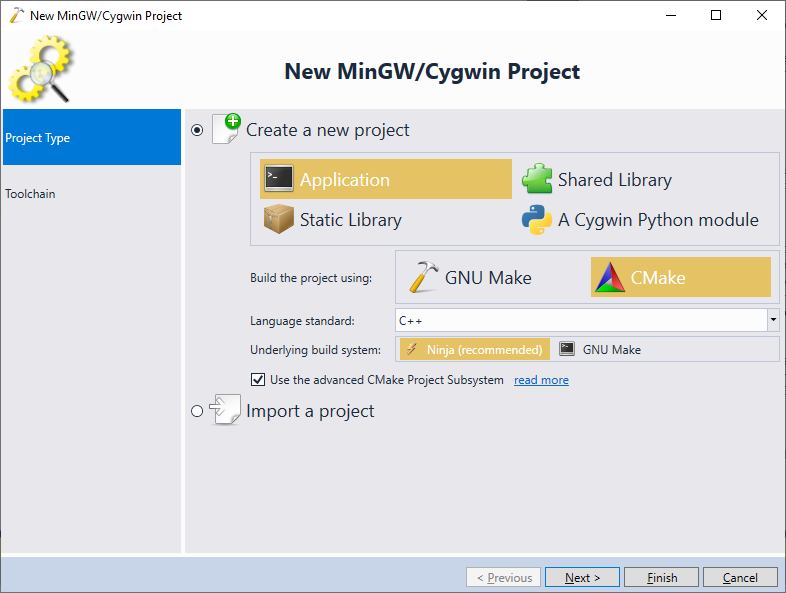
- On the first page of the wizard select Create a new Project => Application. VisualGDB can create MinGW64 projects using either GNU Make, or CMake. In this tutorial we will show the more advanced CMake option. Select CMake, Ninja and check the “Advanced CMake project Subsystem” checkbox:
- If you have not installed MinGW64 yet, select the auto-download option from the list:
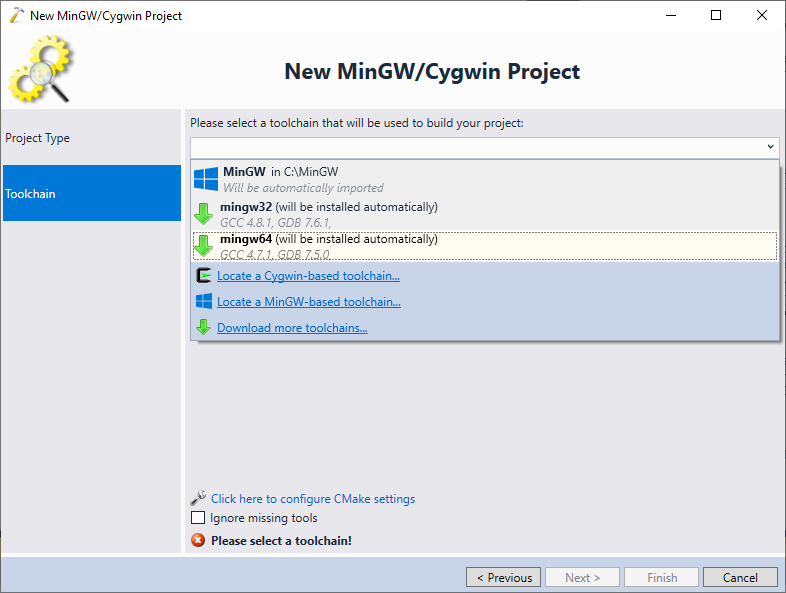
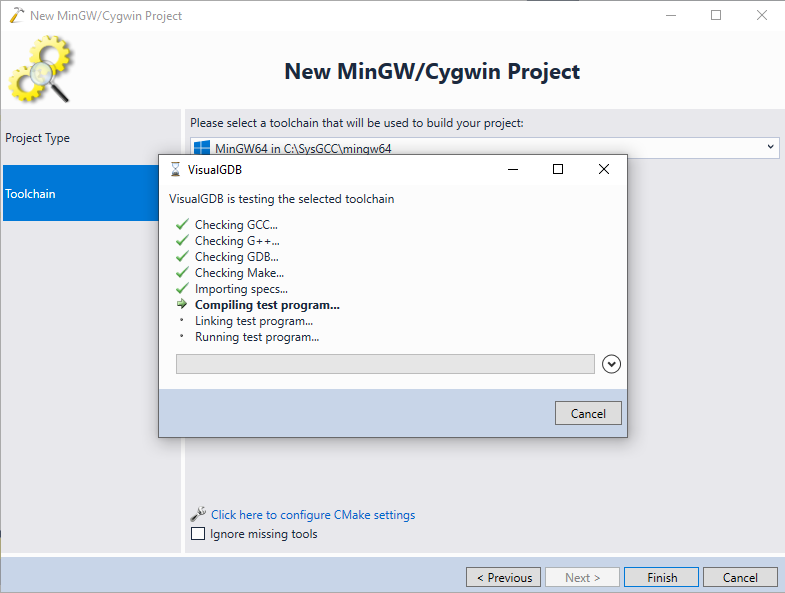
- Once the toolchain is installed it will appear in the normal toolchain list in the wizard. Press Finish to complete the wizard and wait for VisualGDB to test the toolchain consistency:
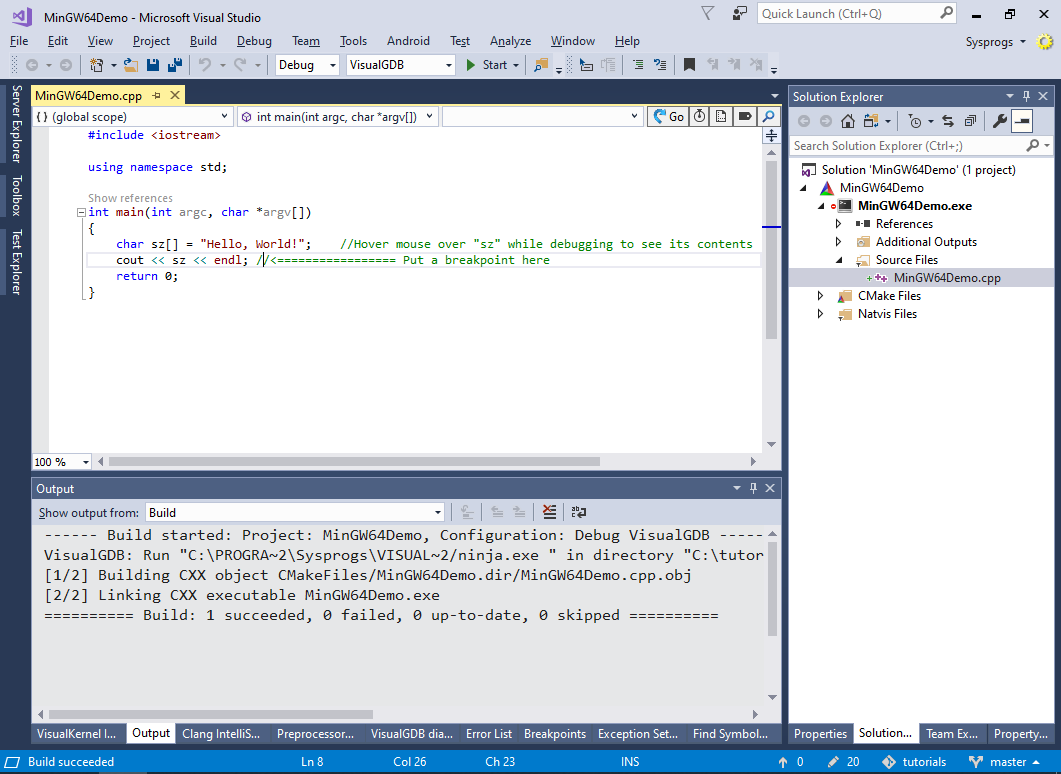
- Your Visual Studio project will be now created. Press Ctrl-Shift-B to build it.
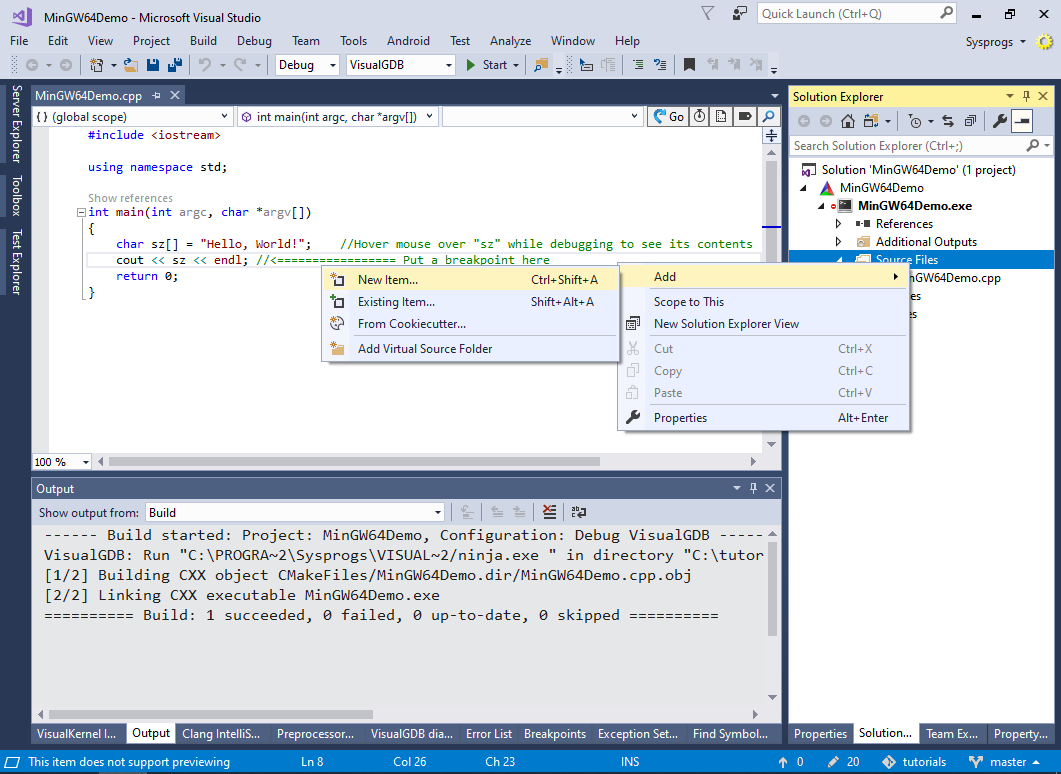
- Now we will show how to add new code to the project using the Advanced CMake Project Subsystem and Clang IntelliSense. Right-click on the executable node in Solution Explorer and select Add->New Item:
- Pick “Source file” and specify the name for the new file:
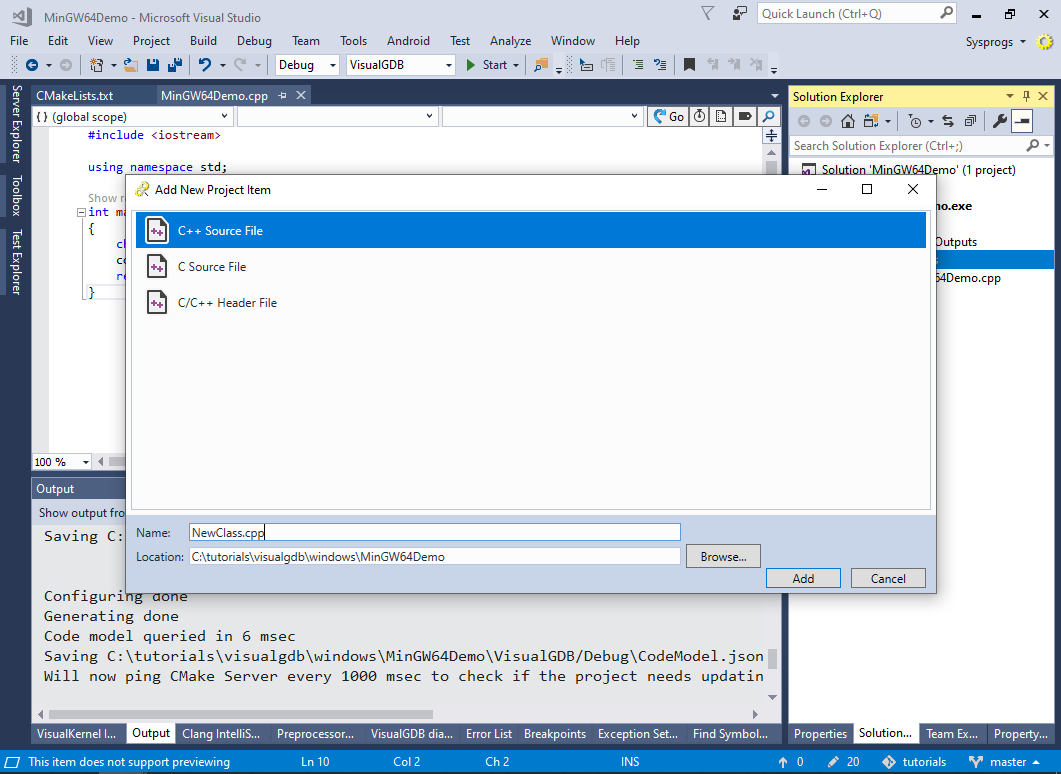
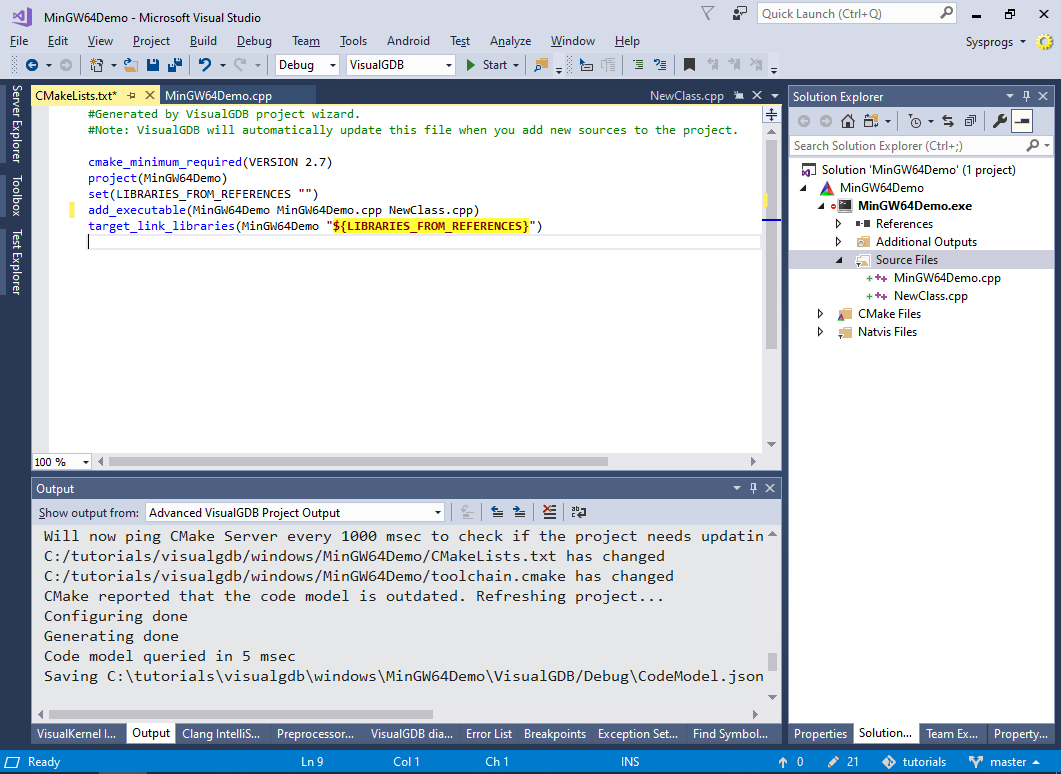
- VisualGDB will create the new source file and will automatically update the add_executable() statement in the CMakeLists.txt file:
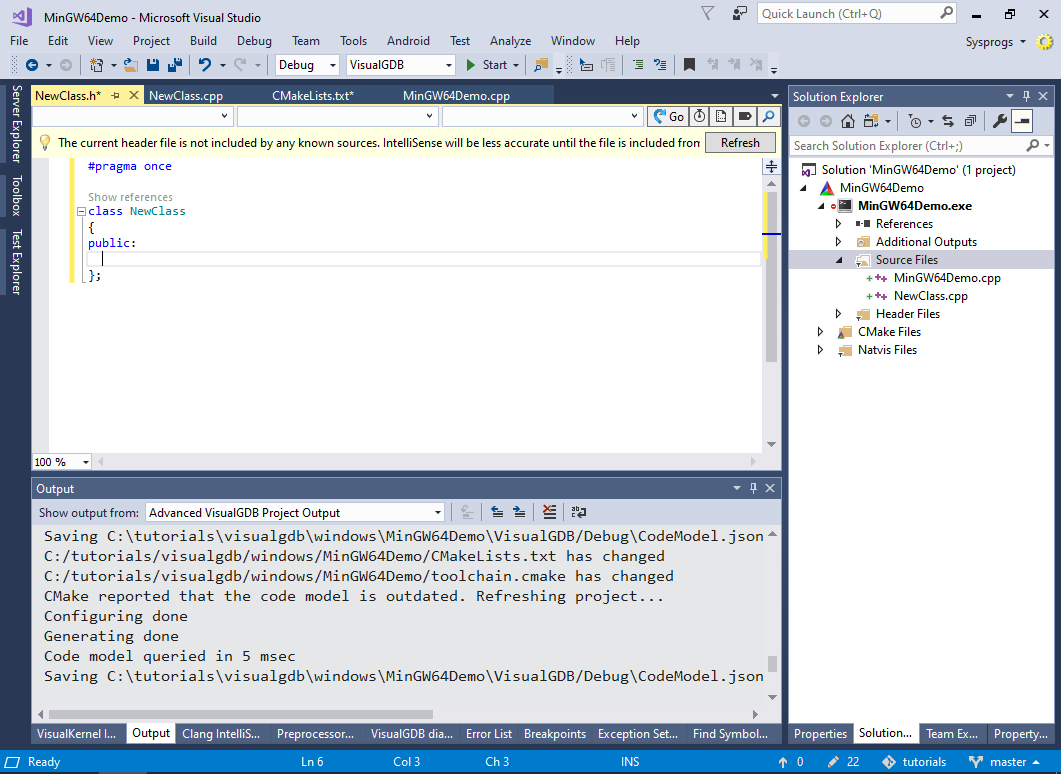
- Follow a similar procedure to create a header file and add an empty class in it. VisualGDB will warn that the header is not included from any source files yet and hence IntelliSense won’t be accurate:
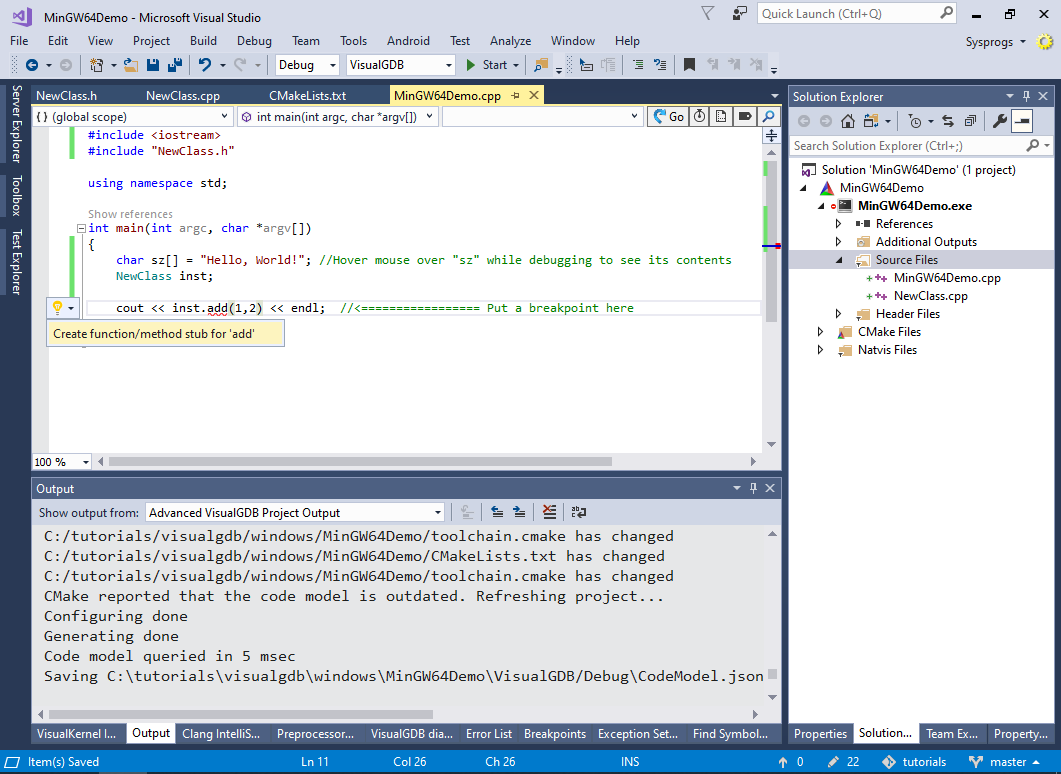
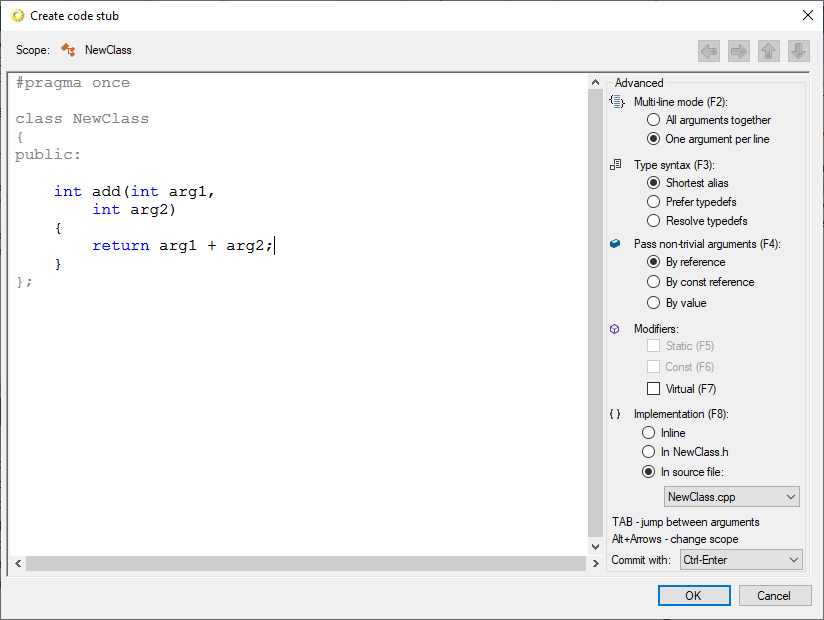
- Go to the main C++ source file, include the header file, create an instance of the new class and finally try calling a non-existing method from it. Press Ctrl+. to display VisualGDB’s suggestion to generate a new function/method:
- VisualGDB will try to guess the argument values and return value based on the context of the call. In this example, the return value is incorrectly guessed as std::ostream:
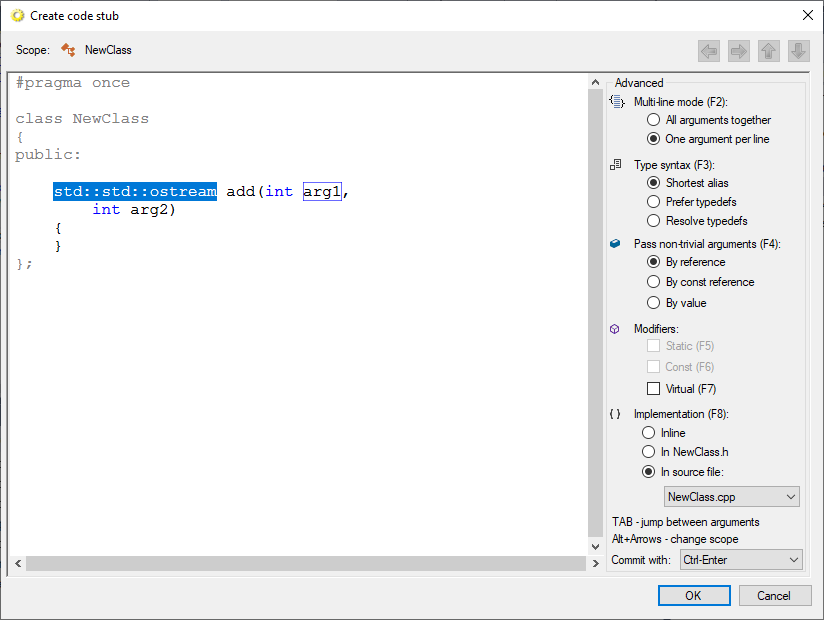
- Change the return value to int and add a basic implementation to the method. Then select “Implementation: in source file” and press Ctrl-Enter to complete the edit:
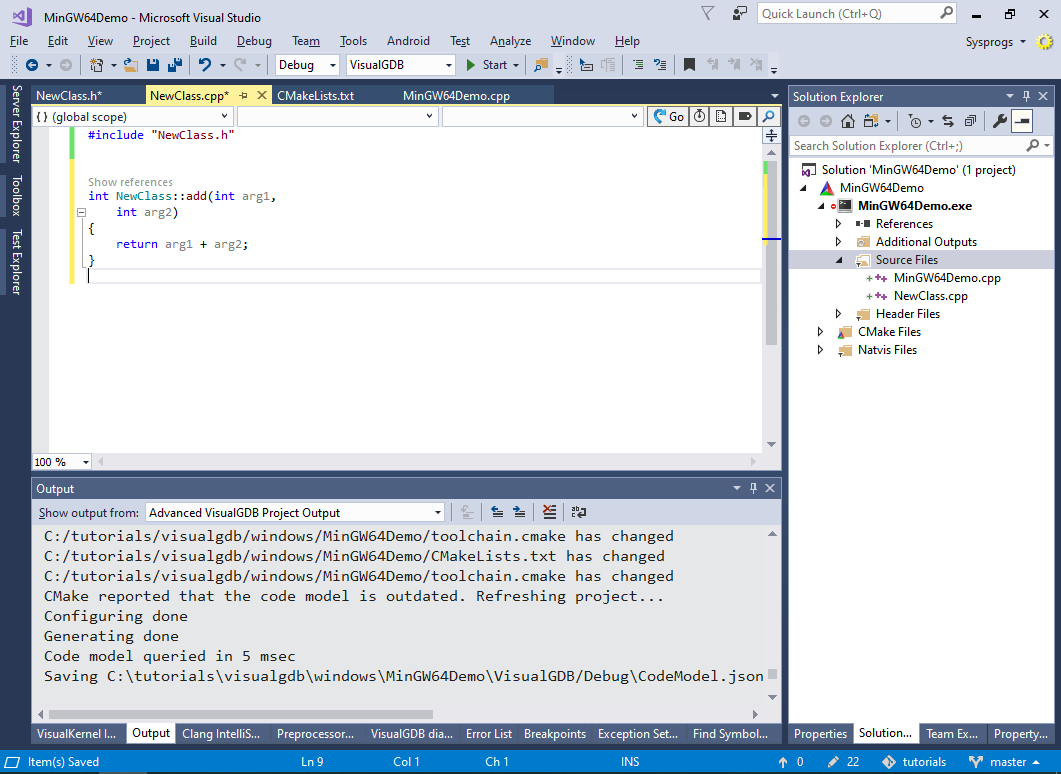
- VisualGDB will automatically create the new method:
- Set a breakpoint in the add() method and press F5 to start debugging. The breakpoint will now trigger:

- You can use the GDB Session window to see the commands sent by VisualGDB to the gdb debugger and run your own gdb commands:

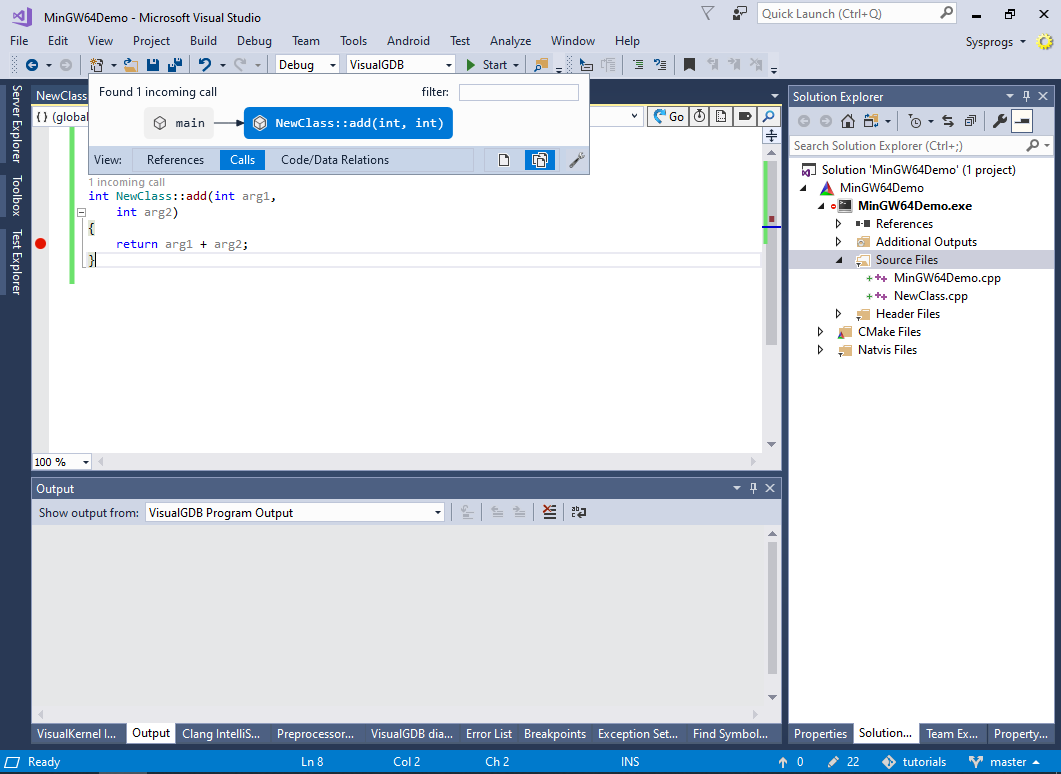
- You can also quickly explore the relations between different parts of your program using CodeJumps (clickable links above the function names). Use the tag icon in the top right corner of the source editor to quickly toggle the display of CodeJumps labels: