Troubleshooting Contact Bounce Timing with Software Tracing
This tutorial shows how to use Software Tracing to troubleshoot hardware glitches that happen sporadically and are too fast to analyze with conventional debugging techniques.
We will create a basic program that toggles the on-board LED each time a button is pressed, will show that it doesn’t work as expected due to contact bounce, and will use Software Tracing to find the root cause and test a mitigation.
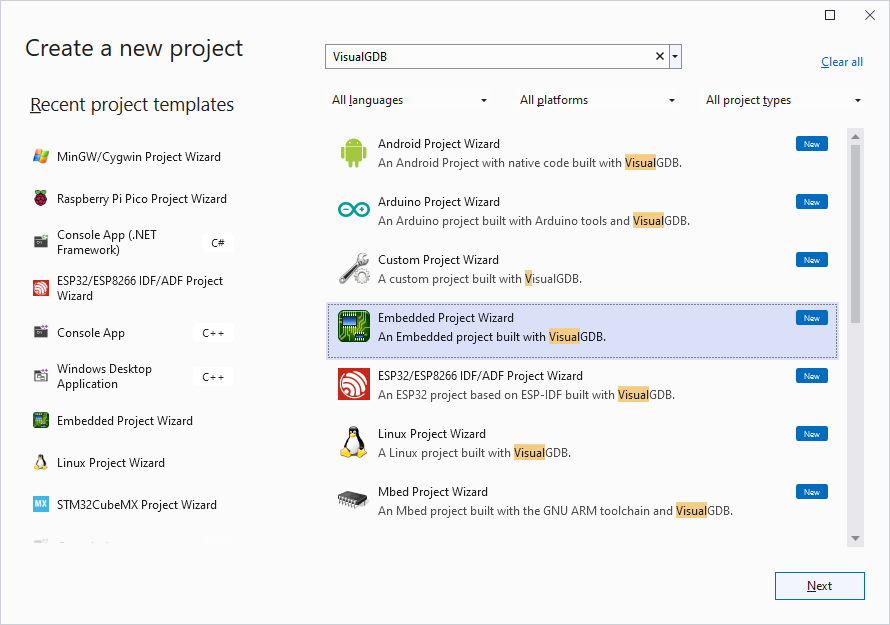
- Open Visual Studio and locate the VisualGDB Embedded Project Wizard:
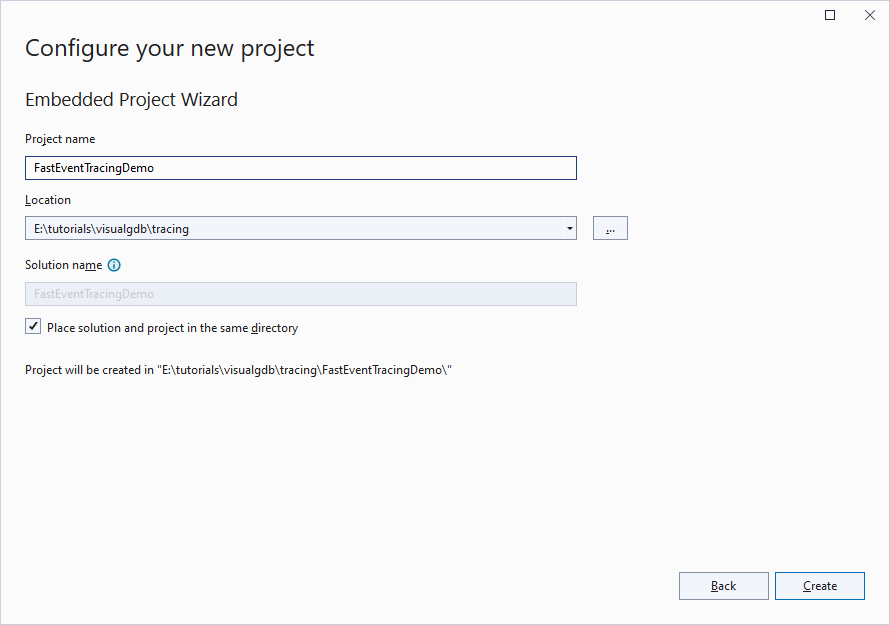
- Enter the name and location of your project:
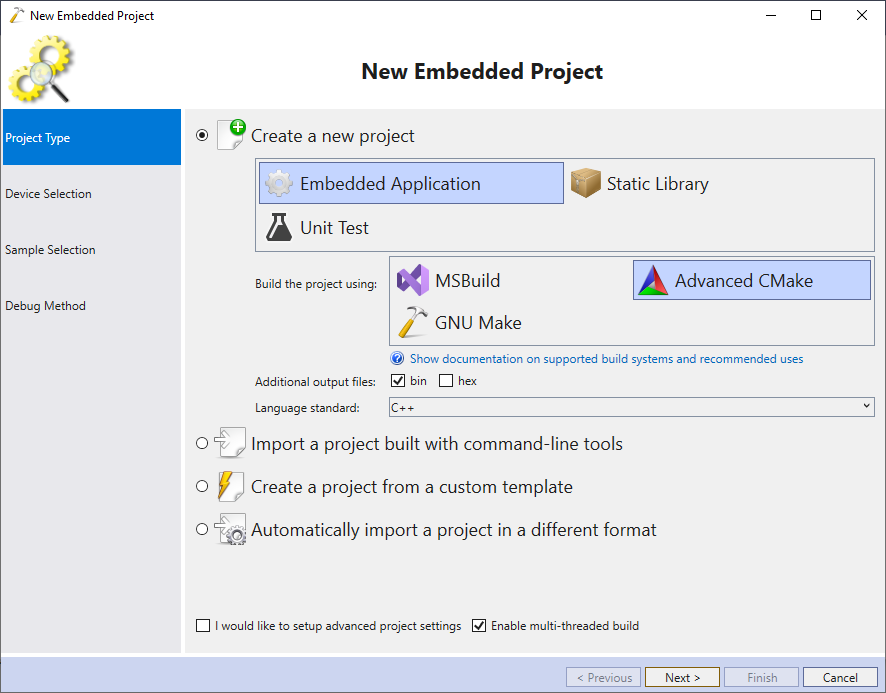
- Select Create a new project -> Embedded Application -> Advanced CMake:
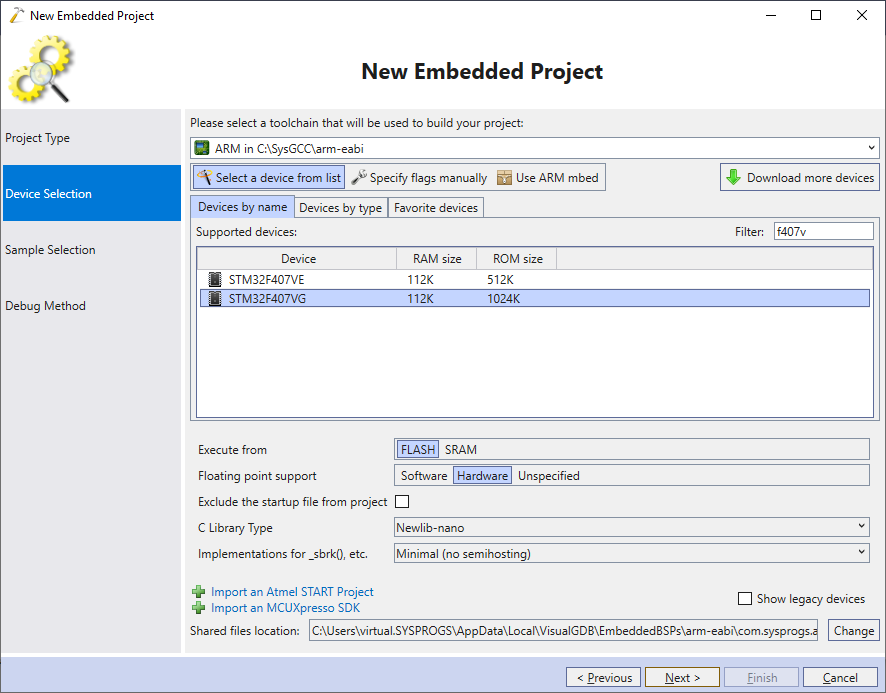
- Proceed with the ARM toolchain and pick the device you are trying to target:
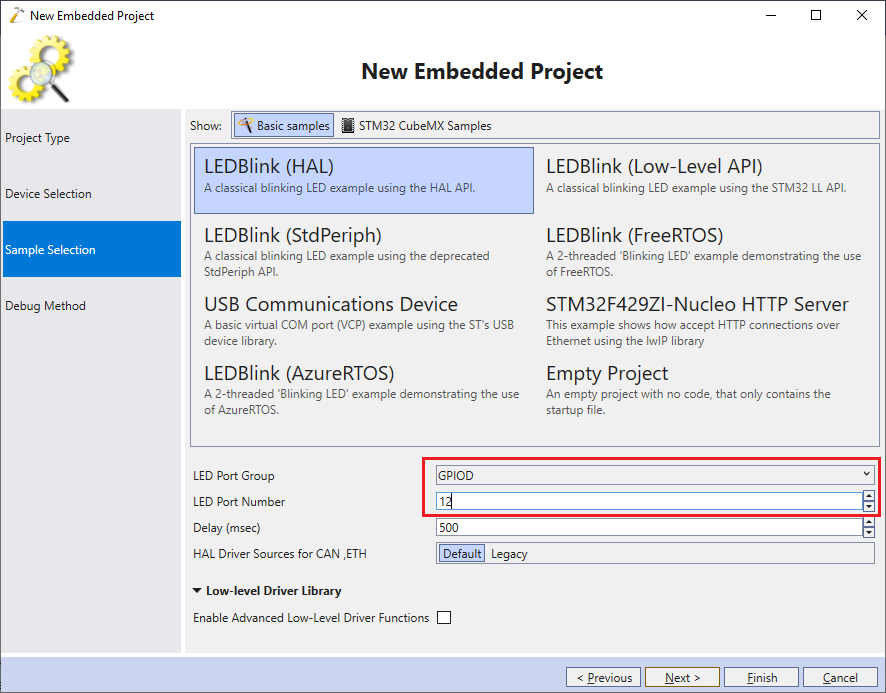
- Proceed with cloning the default “LEDBlink” example. As we will rely on the LEDs to demonstrate the contact bounce problem, make sure the LED port and pin match the actual LED location on your board:
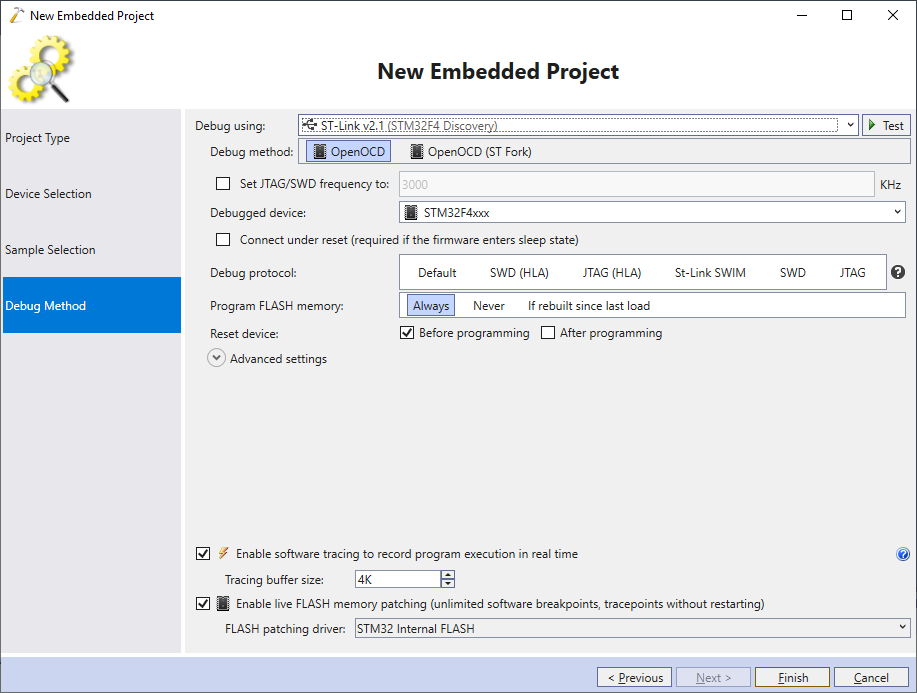
- Finally, choose the debugging settings that work with your board and click “Finish” to generate the project:
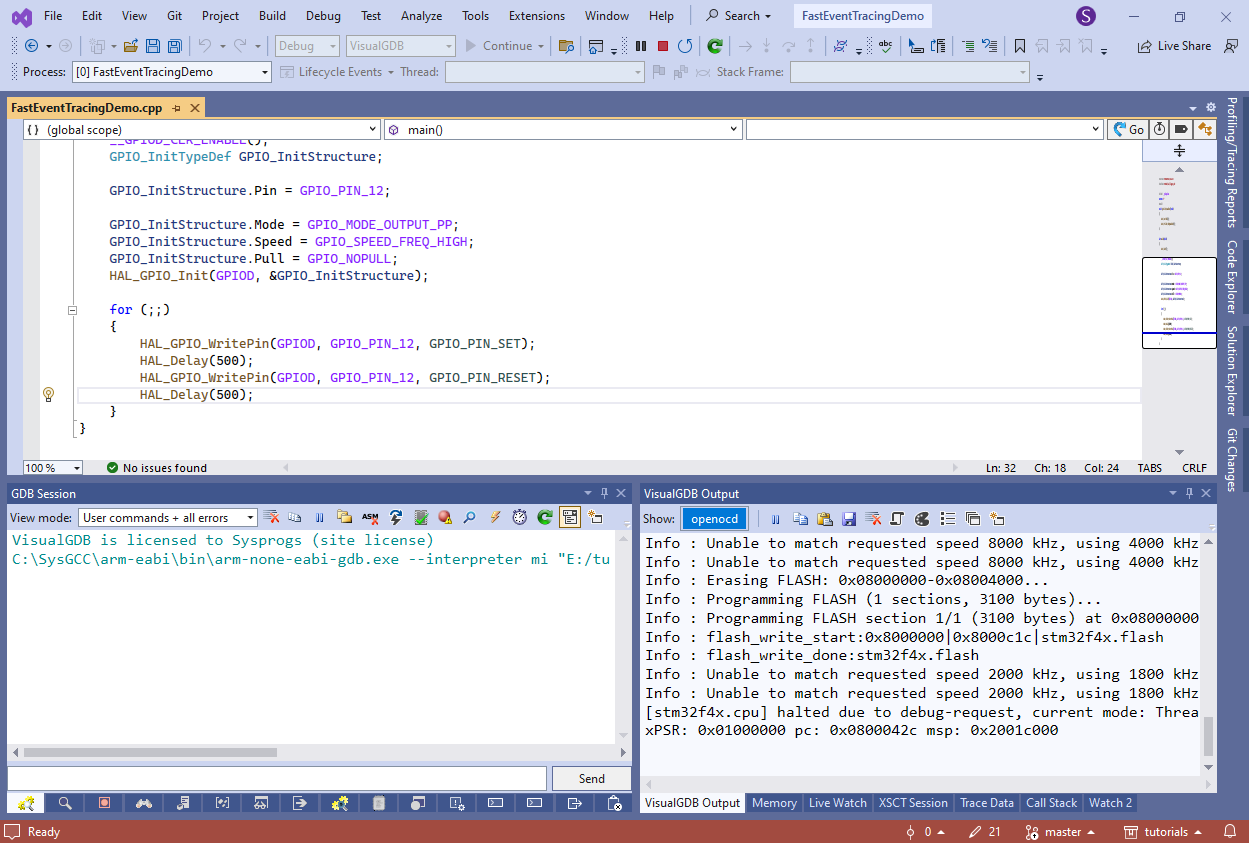
- Press F5 to build the project and begin debugging it. Make sure the on-board LED blinks every second as expected:
- Now we will change the code to toggle the LED state each time the on-board button is pressed using a GPIO interrupt.
First of all, initialize the GPIO pin connected to the button (PA0 for STM32F4Discovery) and configure it as an falling edge input:GPIO_InitStructure.Mode = GPIO_MODE_IT_FALLING; GPIO_InitStructure.Pull = GPIO_NOPULL; GPIO_InitStructure.Pin = GPIO_PIN_0; HAL_GPIO_Init(GPIOA, &GPIO_InitStructure);
Then, enable the external interrupt corresponding to the button pin number (e.g. EXTI0 for PA0, PB0, PC0, etc):
    HAL_NVIC_SetPriority(EXTI0_IRQn, 2, 0);
    HAL_NVIC_EnableIRQ(EXTI0_IRQn);
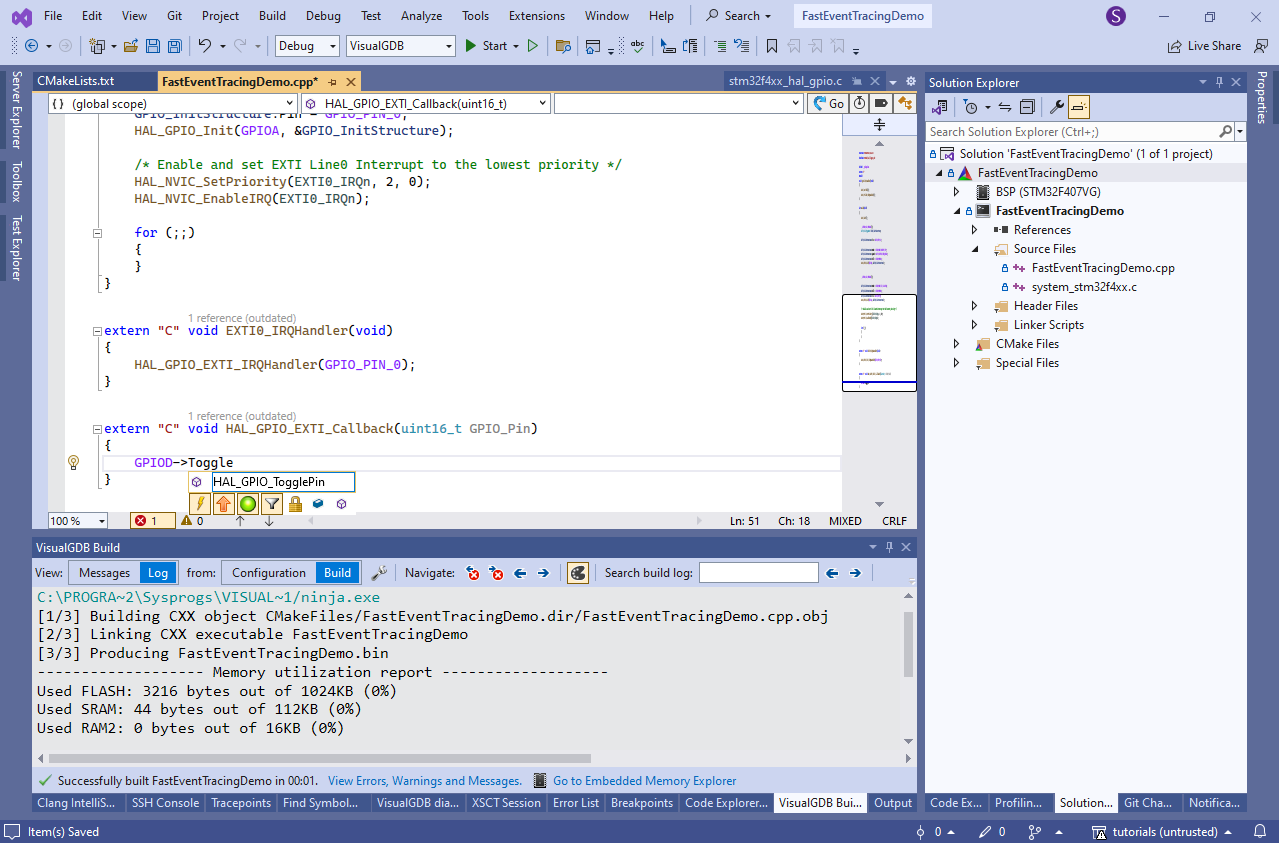
Each time there is a falling edge on the PA0 signal, it will raise the EXTI0 interrupt, invoking EXTI0_IRQHandler(), that will in turn call HAL_GPIO_EXTI_IRQHandler() to clear the relevant interrupt flag and will finally pass control to the HAL_GPIO_EXTI_Callback() callback, that will actually toggle the LED. Add the following functions to the main file:
extern "C" void EXTI0_IRQHandler(void)
{
    HAL_GPIO_EXTI_IRQHandler(GPIO_PIN_0);
}

extern "C" void HAL_GPIO_EXTI_Callback(uint16_t GPIO_Pin)
{
	HAL_GPIO_TogglePin(GPIOD, GPIO_PIN_12);
}
Note that VisualGDB can automatically lookup functions accepting GPIOx as the first argument as if it was a C++ class and the functions were methods. Try typing “GPIOD”, pressing “.” and selecting “HAL_GPIO_TogglePin” and VisualGDB will automatically generate a call to it:
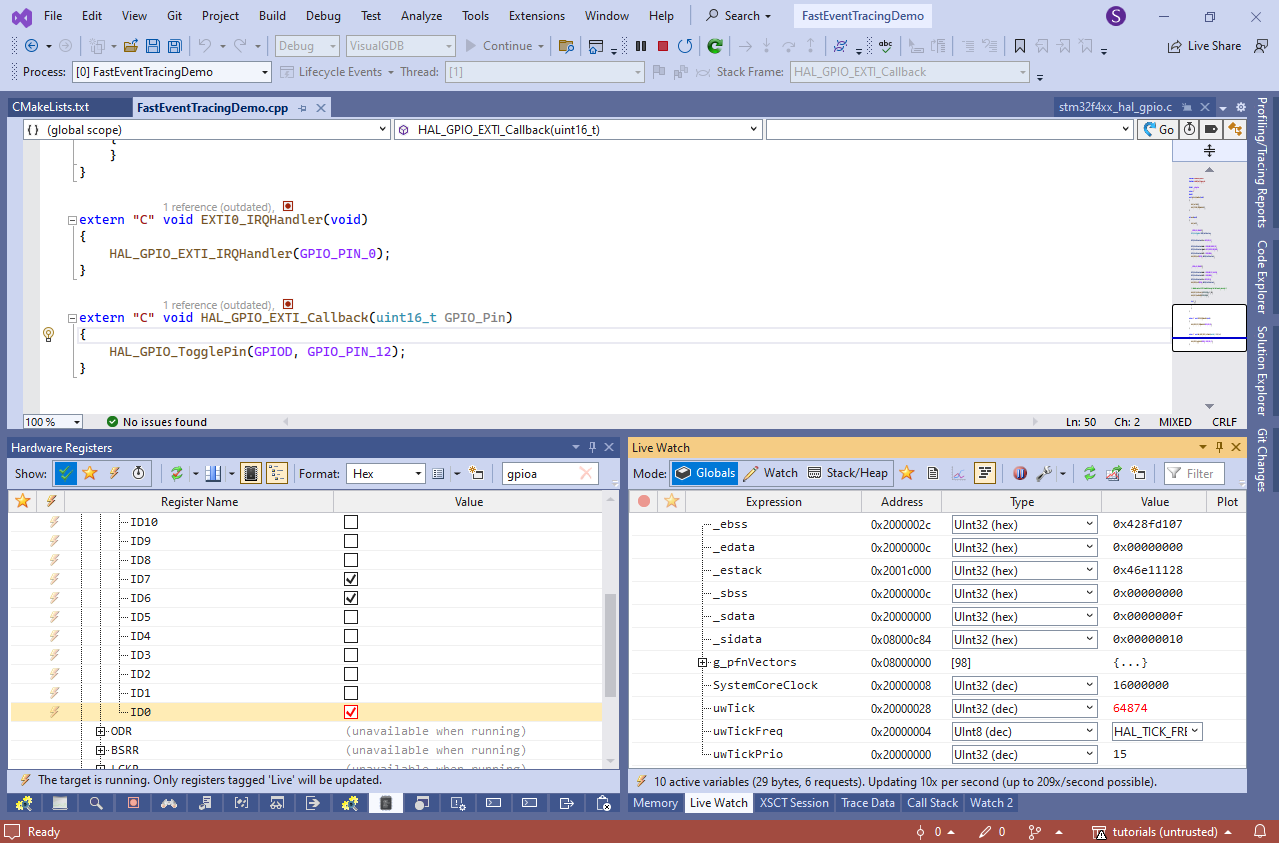
- Build the program and run it again. Try pressing the button a few times. Note that sometimes the LED is toggled as expected, and sometimes it doesn’t. You can double-check the state of the GPIOA->IDR[0] bit via the Hardware Registers window, or setting a breakpoint in HAL_GPIO_EXTI_Callback(), but it won’t show anything unexpected:
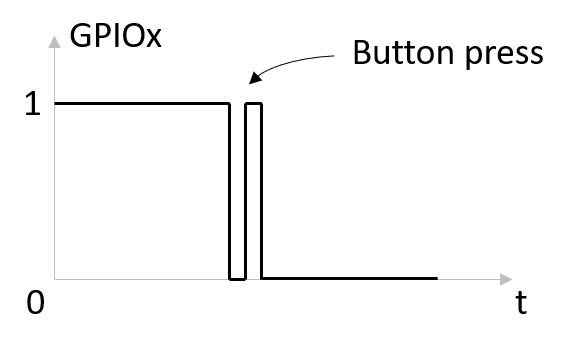
- The problem is caused by a phenomenon known as contact bounce – the physical contacts inside the button can bounce back and forth, causing several extra transitions between 1 and 0, each of them toggling the LED:
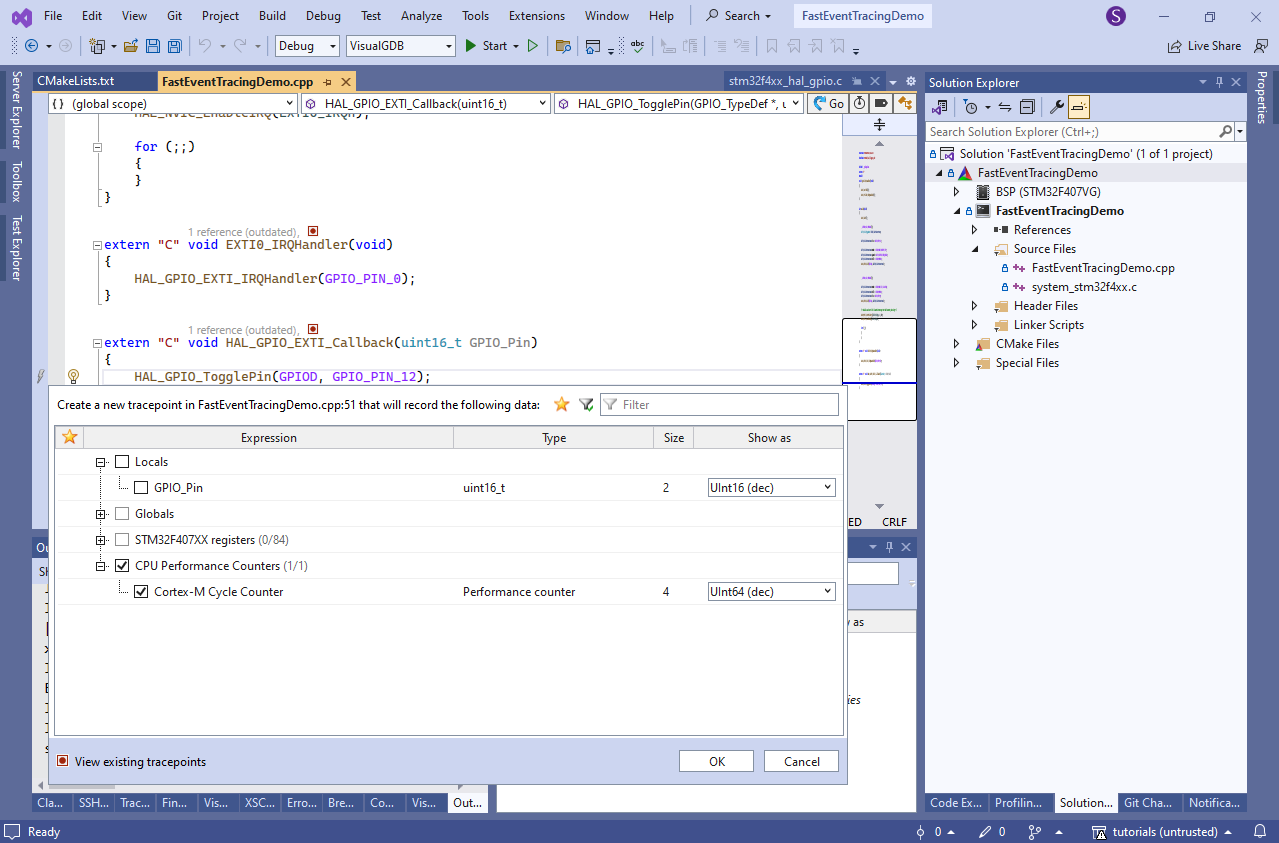
- Normal debugging techniques won’t reveal the problem because by the time a breakpoint event is processed, all bouncing inside the button will stop. Software tracing, on the other hand, works much faster, and cap easily capture such effects, and will give you a detailed timing as well. Click on the tracepoint bar (to the left of the breakpoint bar) and create a tracepoint on the LED toggling line, capturing the Cortex-M cycle counter:
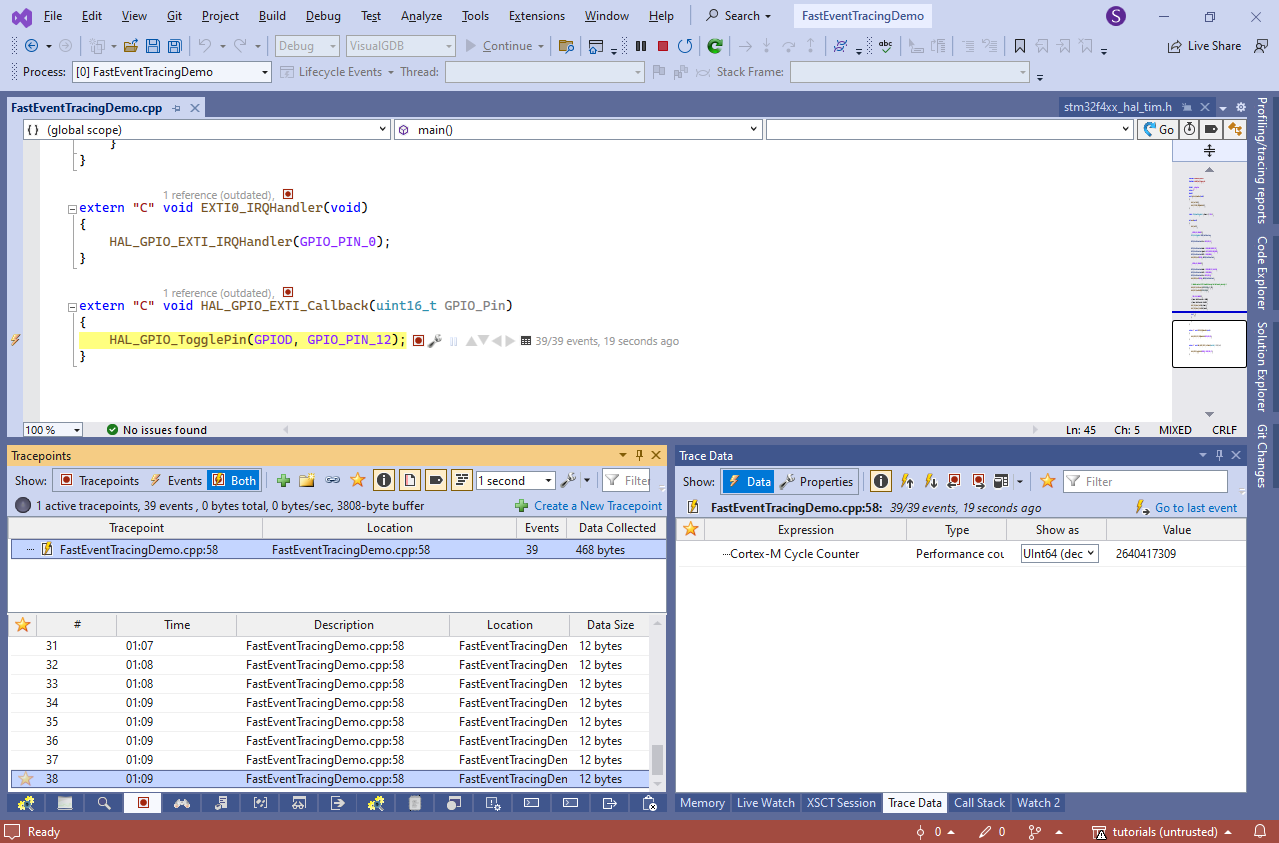
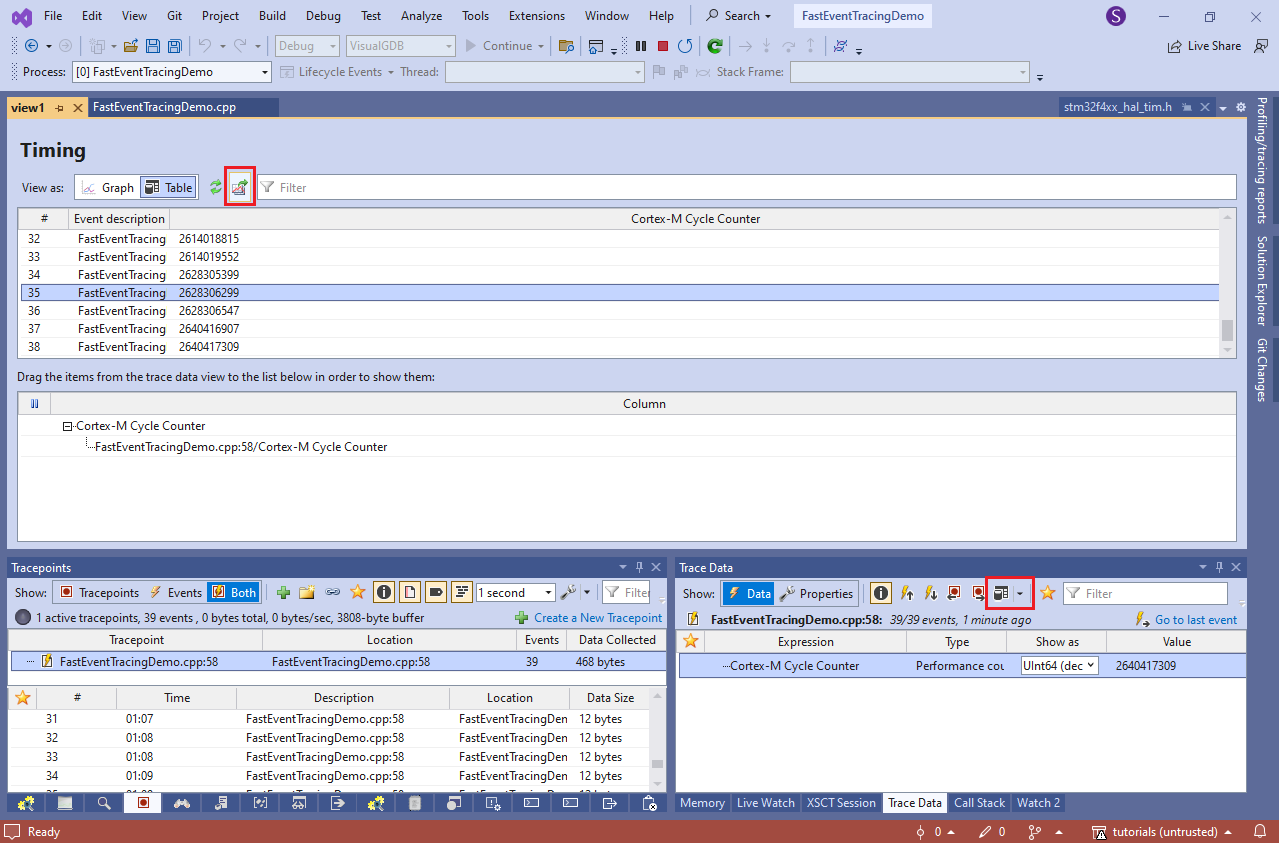
- Run the program and press the button several times until the problem is reproduced. Check the Tracepoints window for the list of trace events, each corresponding to a single invocation of the LED toggling line. Note that trace recording happens directly on the target, so it is fast enough to capture contact bounce and other fast hardware events:
- Create a new table view via the Trace Data window, drag the Cortex-M Cycle Counter to the column list, and export the table into a CSV file:
- Open the CSV file in Excel and create 2 additional columns: delta (difference between the previous line) and msec (delta divided by the clock frequency). It will very easily pinpoint the cases where the contact bounce happened, and will even show the exact timing:
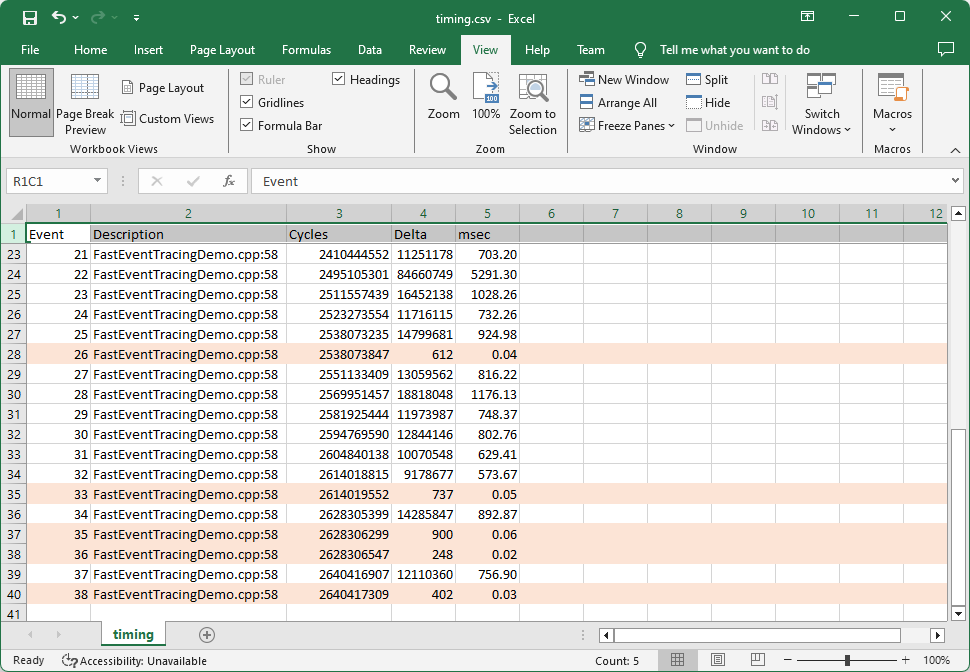
- In this example, all bouncing happened in less than 0.1ms timeframe, so we can safely filter it out by simply ignoring interrupts happening within 1 ms from the previous interrupt. This can be easily done by utilizing a hardware timer:
static TIM_HandleTypeDef s_Timer = { TIM1 };

//...

    __TIM1_CLK_ENABLE();
    s_Timer.Init.Period = 0xFFFF;
    HAL_TIM_Base_Init(&s_Timer);
    HAL_TIM_Base_Start(&s_Timer);

//...

extern "C" void HAL_GPIO_EXTI_Callback(uint16_t GPIO_Pin)
{
    if (__HAL_TIM_GET_FLAG(&s_Timer, TIM_FLAG_UPDATE) != RESET || TIM1->CNT >= 10000)
    {
        HAL_GPIO_TogglePin(GPIOD, GPIO_PIN_12);
    }
    else
    {
        asm("nop");
    }

    TIM1->CNT = 0;
    __HAL_TIM_CLEAR_FLAG(&s_Timer, TIM_FLAG_UPDATE);
}
Now we will only toggle the LED if the timer has counted more than 10K cycles since the last event, or had overflown at least once (i.e. raised the TIM_FLAG_UPDATE flag).
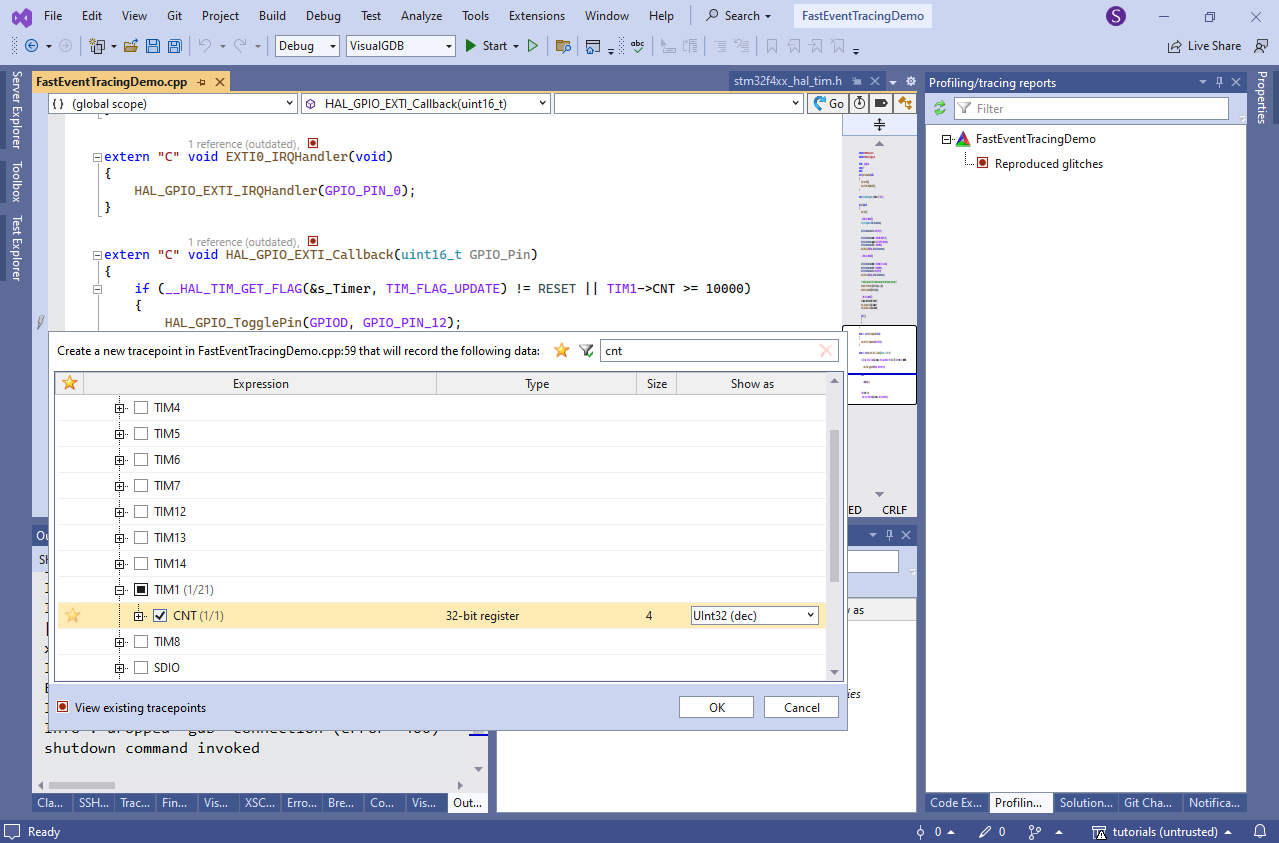
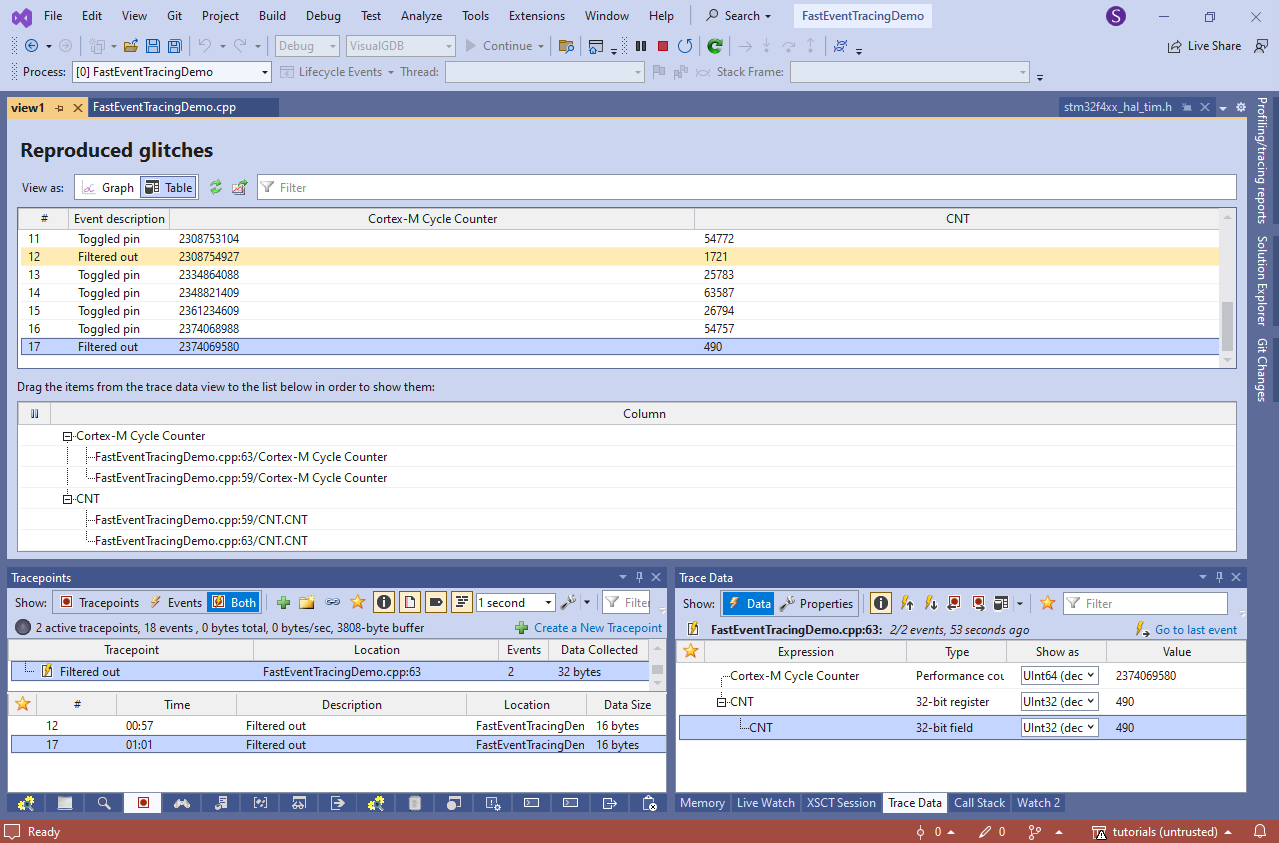
- You can verify the filter by setting tracepoints and both HAL_GPIO_TogglePin() and asm(“nop”) lines, and recording TIM1->CNT together with the cycle counter:
- For convenience, you can give the created tracepoints more meaningful names via the Tracepoints window:
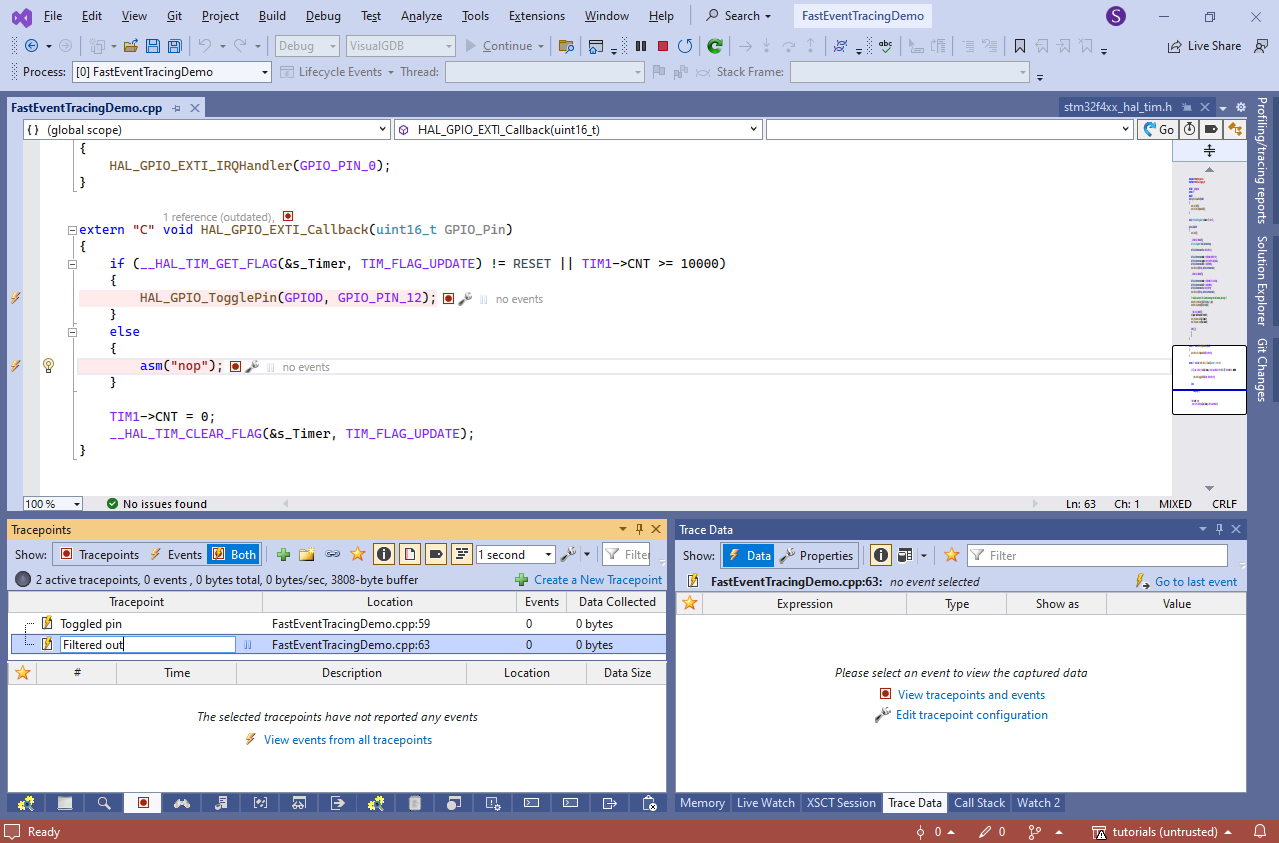
- Press the button several times again until both valid and filtered out events are traced. You can double-check that the timer counter value roughly matches the difference in clock cycles since the last event:
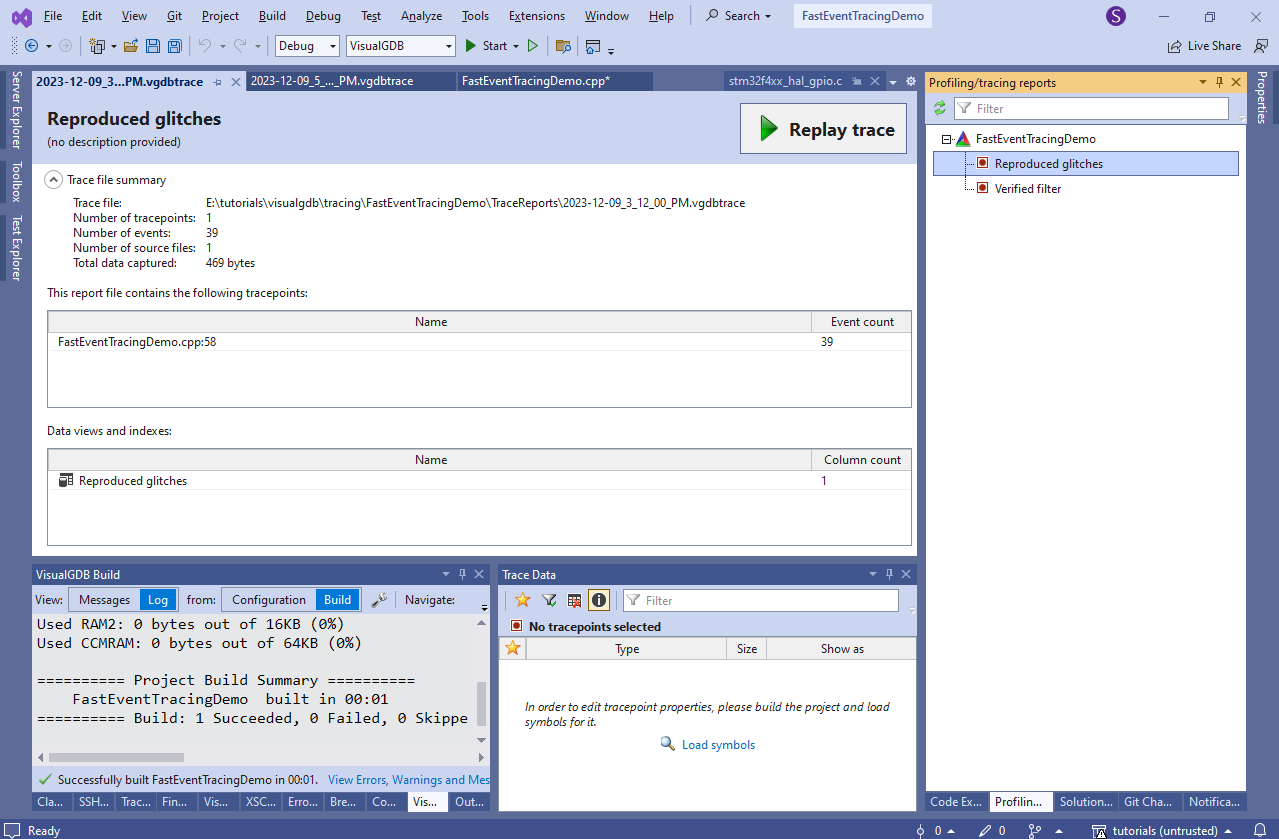
- All tracing data collected during debugging is saved into the .vgdbtrace files. You can review them via the Profiling/Tracing Reports window, replay them, stepping through the events in the debugger, or create more tables or graphs, and export more data:
 You can also collect tracing data in the field by running VisualGDB.exe /trace, and then analyze it on your development machine, or compare multiple recordings side-by-side.