Using Backtrack Tracing to Debug Intermittent Problems
This tutorial shows how to use Live Tracing in the the circular buffer (backtrack) mode to record what happened just before a rarely occurring problem without having to slow down the target and capture its entire program flow.
We will create a basic application using 2 FreeRTOS threads to trigger a race condition, will create tracepoints in the relevant parts of the code, and then once the problem triggers, will use the recorded data to step back in time and see what happened just before the crash.
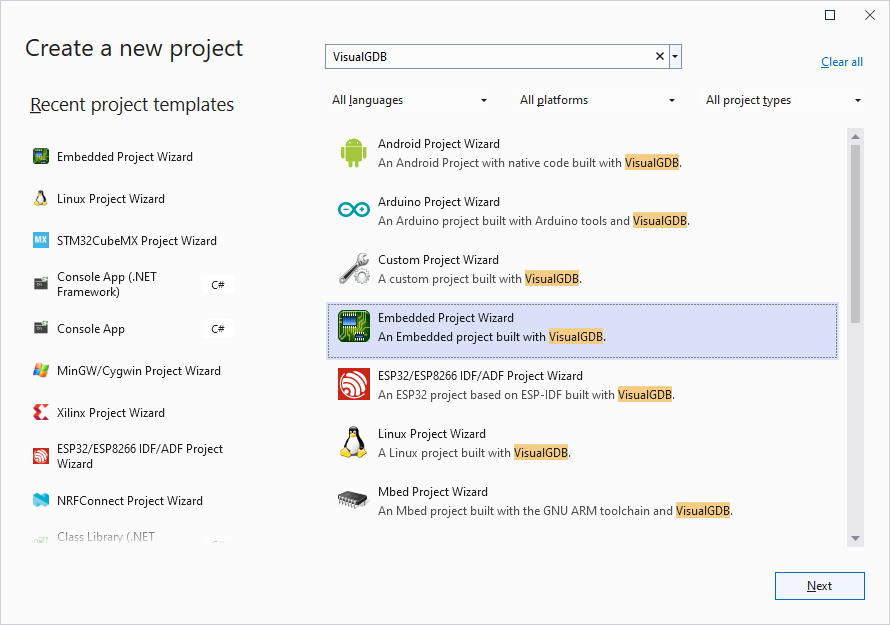
- Start Visual Studio and open the VisualGDB Embedded Project Wizard:
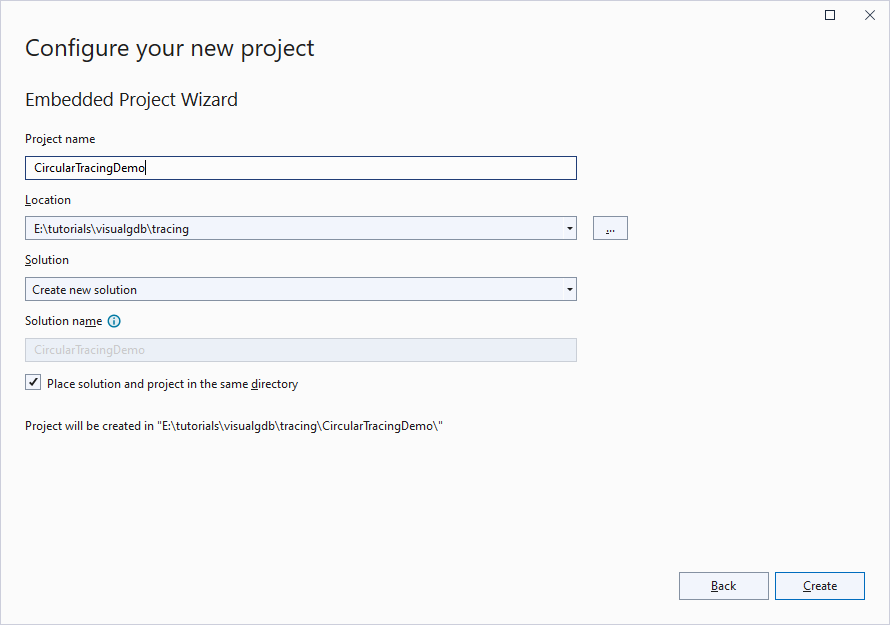
- Enter the name for the new project and the directory where you would like to create it:
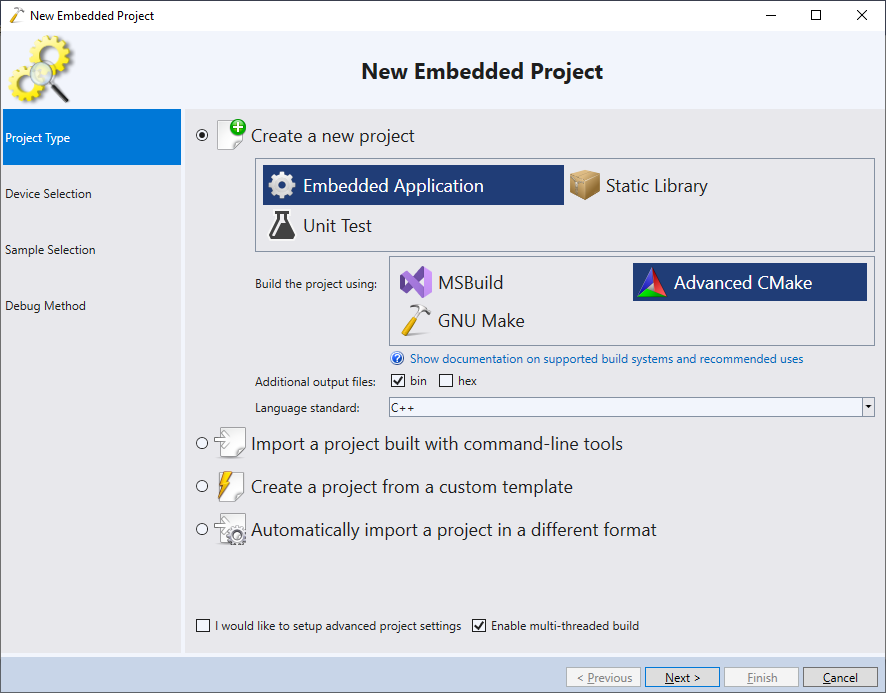
- Proceed with the default project type (Embedded Application -> Advanced CMake):
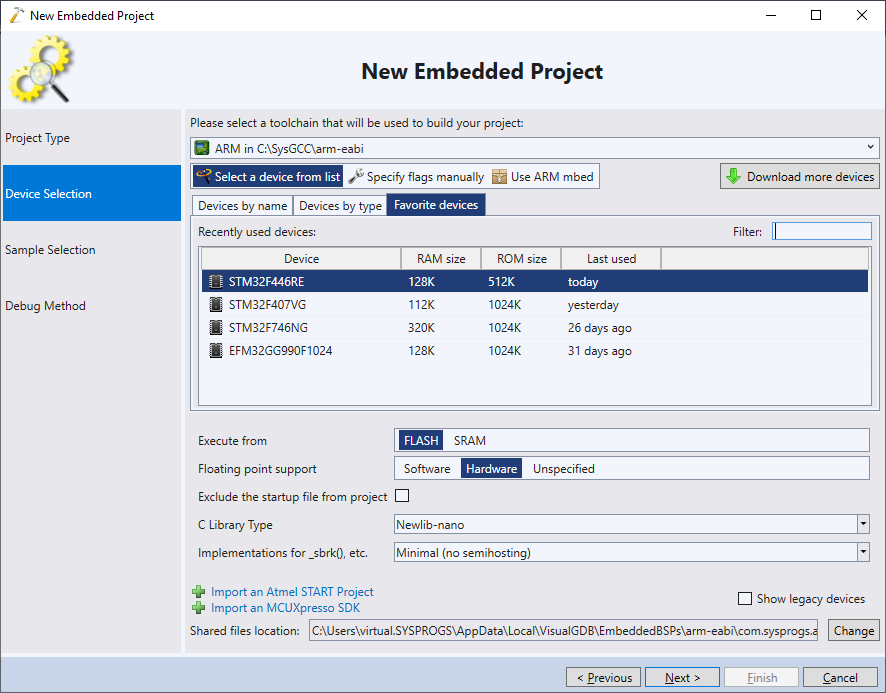
- Select the device you would like to target:
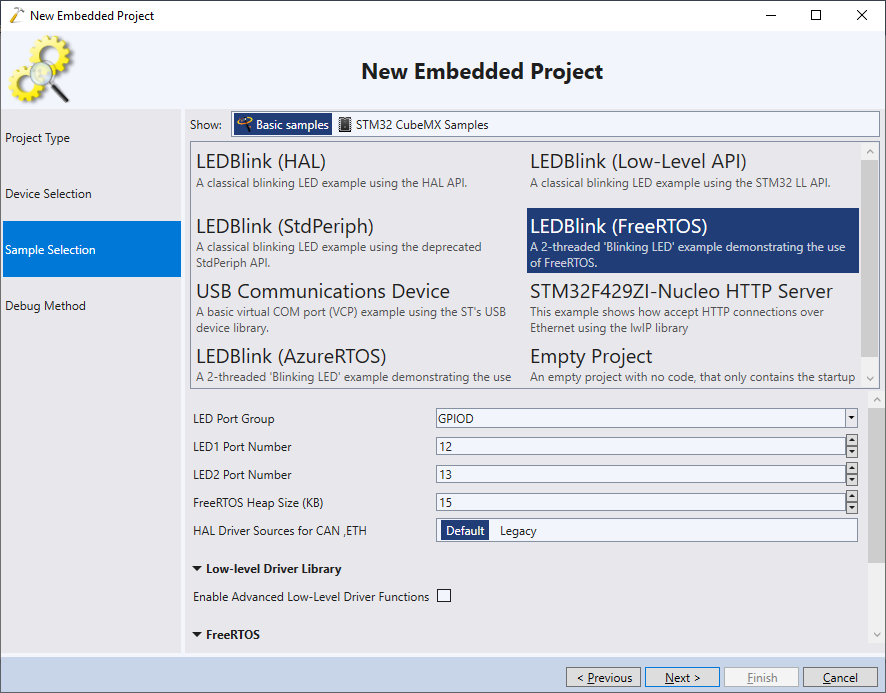
- Pick the “LEDBlink (FreeRTOS)” template and click “Next” to go to the debug settings page:
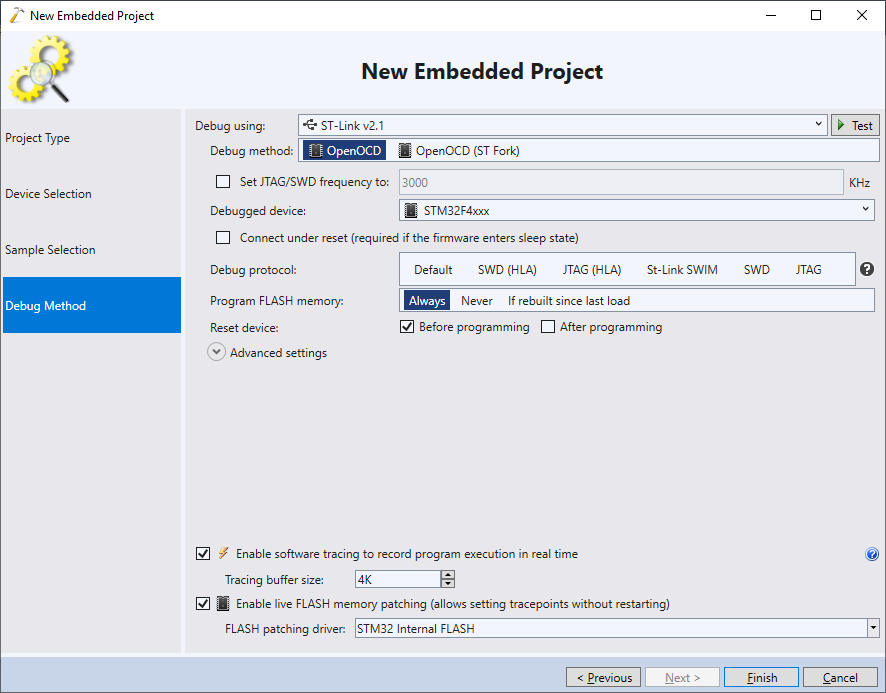
- Select the debug settings matching your setup, make sure the software tracing is enabled and click “Finish” to generate the project:
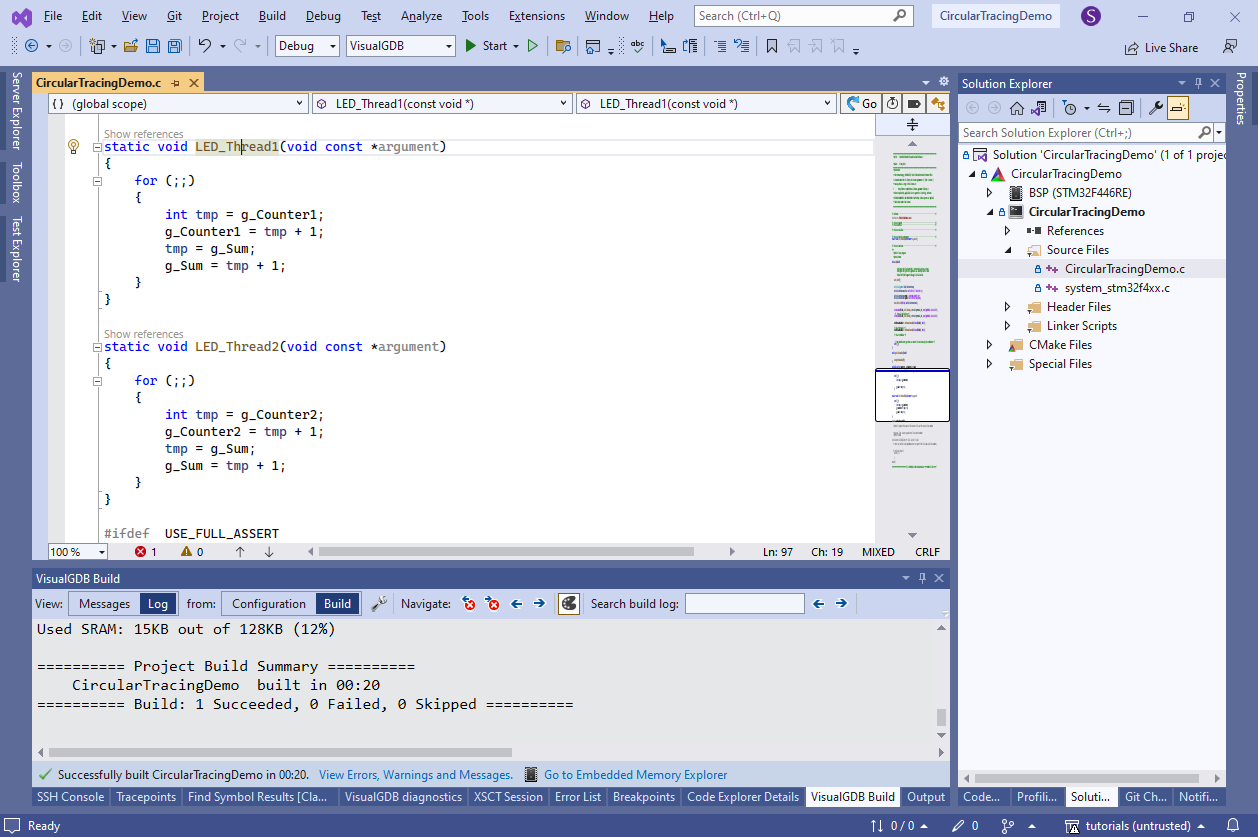
- Once the project is created, replace the contents of LED_Thread1() and LED_Thread2() functions with the following code:
volatile int g_Counter1, g_Counter2, g_Sum;

static void LED_Thread1(void const *argument)
{
    for (;;)
    {
    	int tmp = g_Counter1;
    	g_Counter1 = tmp + 1;
    	tmp = g_Sum;
    	g_Sum = tmp + 1;
    }
}

static void LED_Thread2(void const *argument)
{
    for (;;)
    {
        int tmp = g_Counter2;
    	g_Counter2 = tmp + 1;
    	tmp = g_Sum;
    	g_Sum = tmp + 1;
    }
}
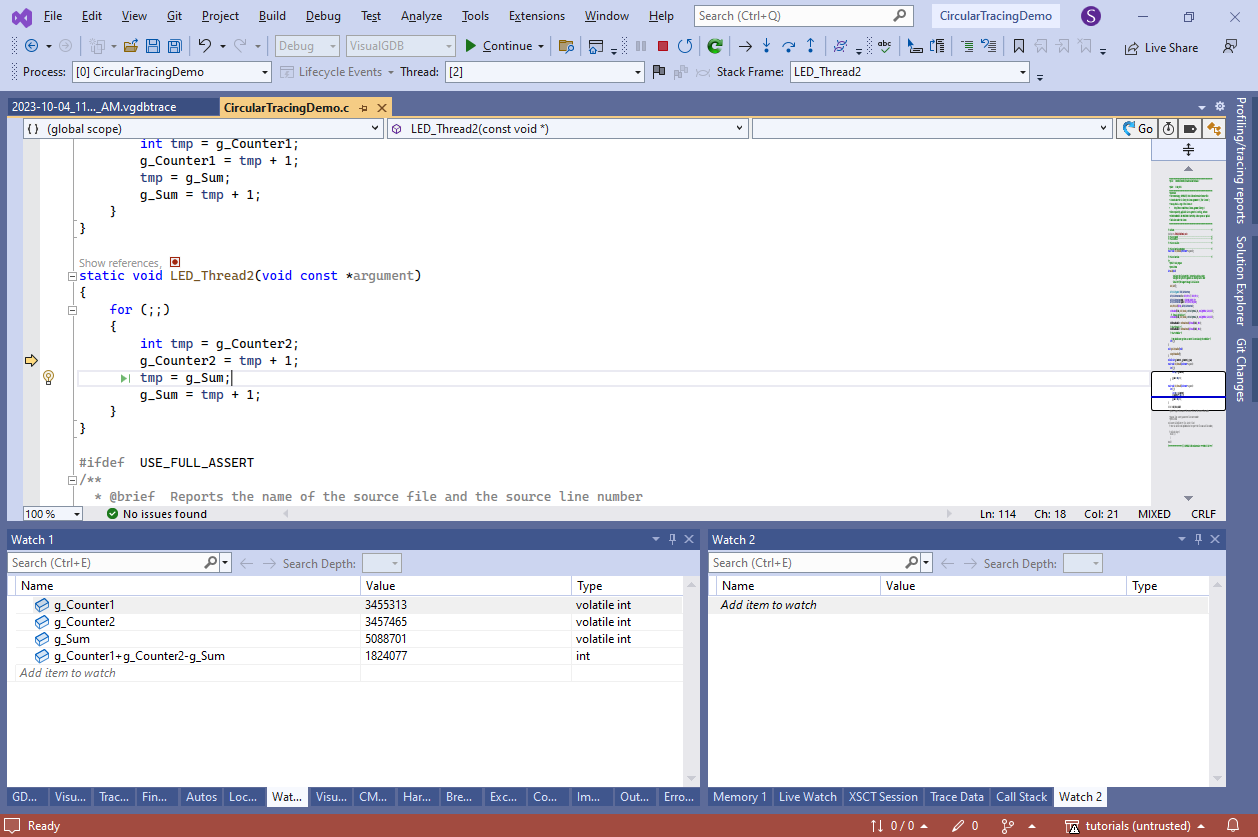
- Each thread increments its own counter (g_Counter1/g_Counter2) and a shared counter called g_Sum. Because of the race condition, the value of g_Sum will be drifting below the sum of g_Counter1 + g_Counter2. Try running the program for some time and checking the difference expression: g_Counter 1 + g_Counter2 – g_Sum:
 Note that it would happen even when using the “g_CounterX++” syntax, but we used explicit reading and writing for clarity.
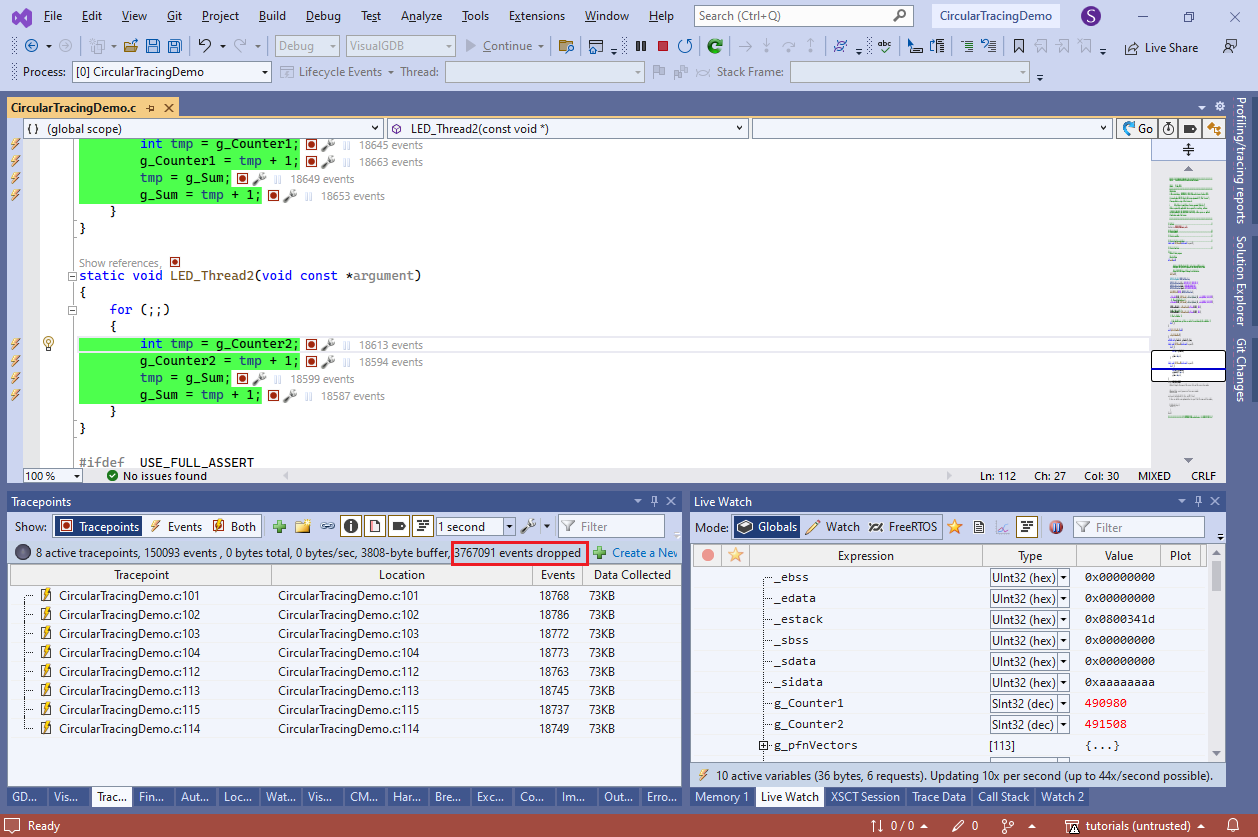
 - Set tracepoints on each of the 4 lines in each thread and configure them to capture the values read in each line. VisualGDB will manage to capture them, however most of the events will be dropped to avoid slowing down the target:
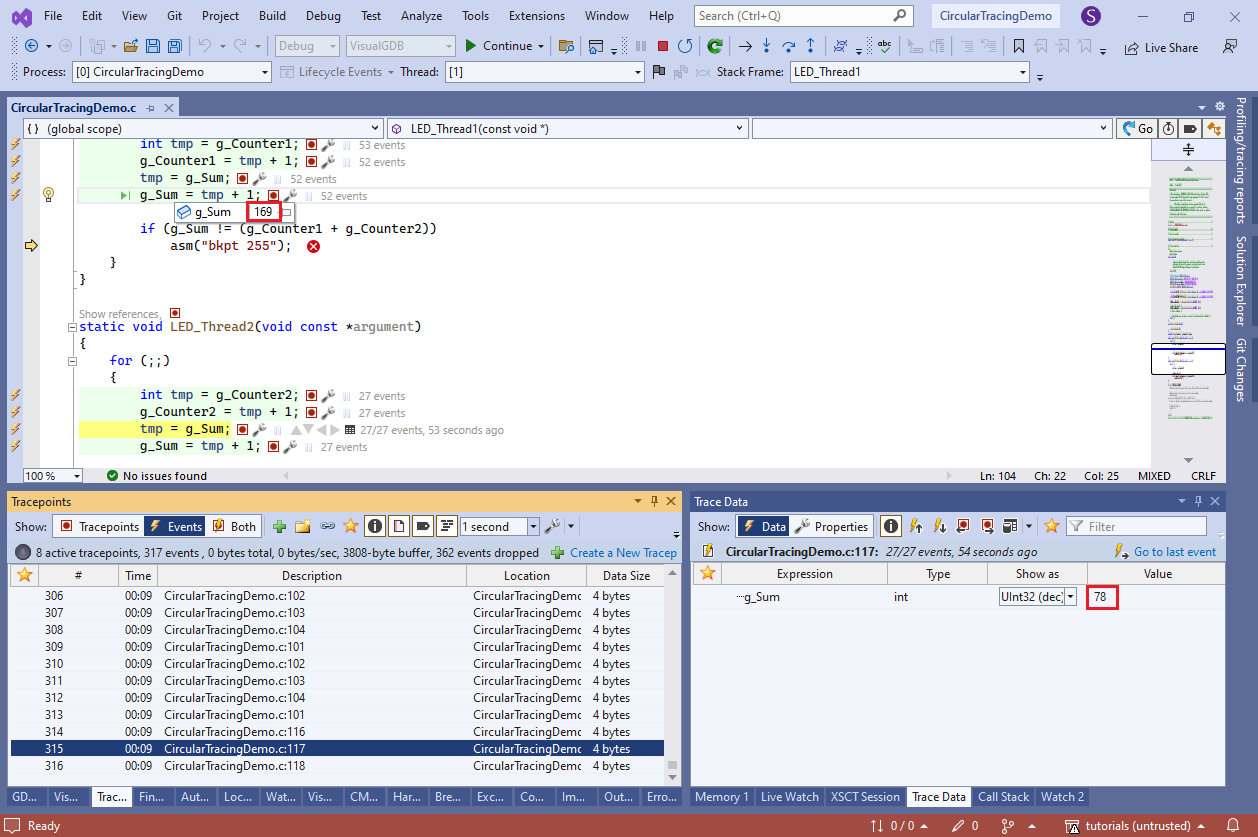
- Add a check to both threads that will trigger a breakpoint if the values of g_Sum and the counters drift away too far:
    	if (((g_Counter1 + g_Counter2) - g_Sum) > 1)
        	asm("bkpt 255");
Note how the last event recorded via regular tracing will contain an outdated value of g_Sum. This happens because tracing every line of a tight loop creates a lot of tracing data (megabytes per second) and the SWD debugger would not keep up with reading it:
- Go to the VisualGDB project Properties and switch the software tracing mode to “Overwrite oldest events”:
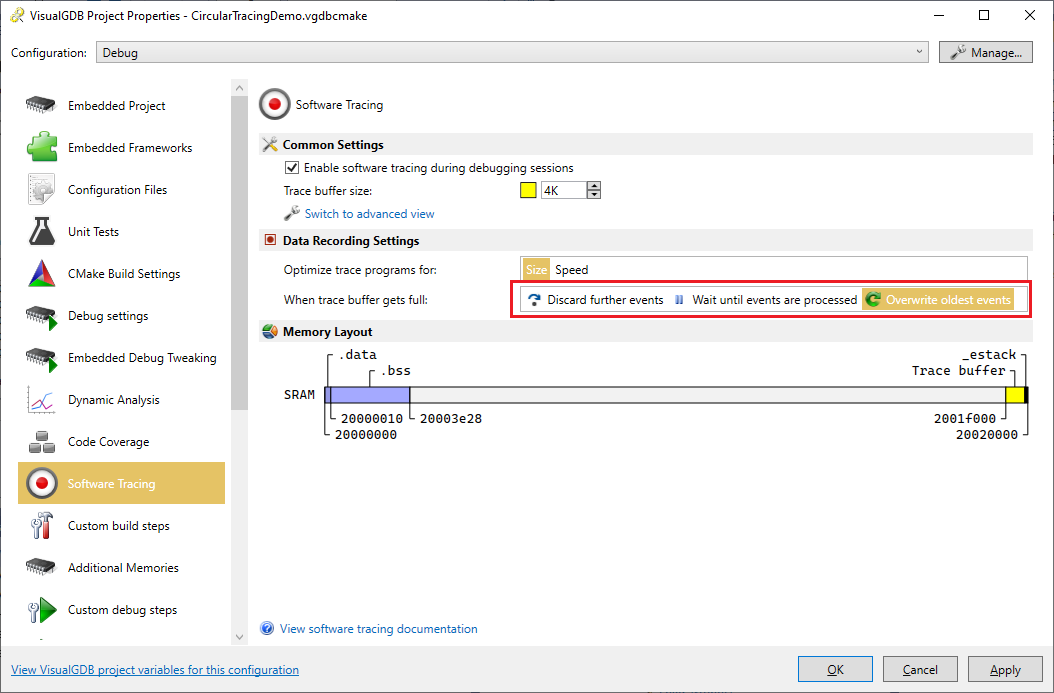 This way, VisualGDB will keep writing the trace into a circular buffer inside the target and will never wait for the debugger to read it.
 - Once a breakpoint triggers, VisualGDB will read the data backwards and recover the last events recorded in it. The data in the last recorded event will match the variable values observed via Watch:
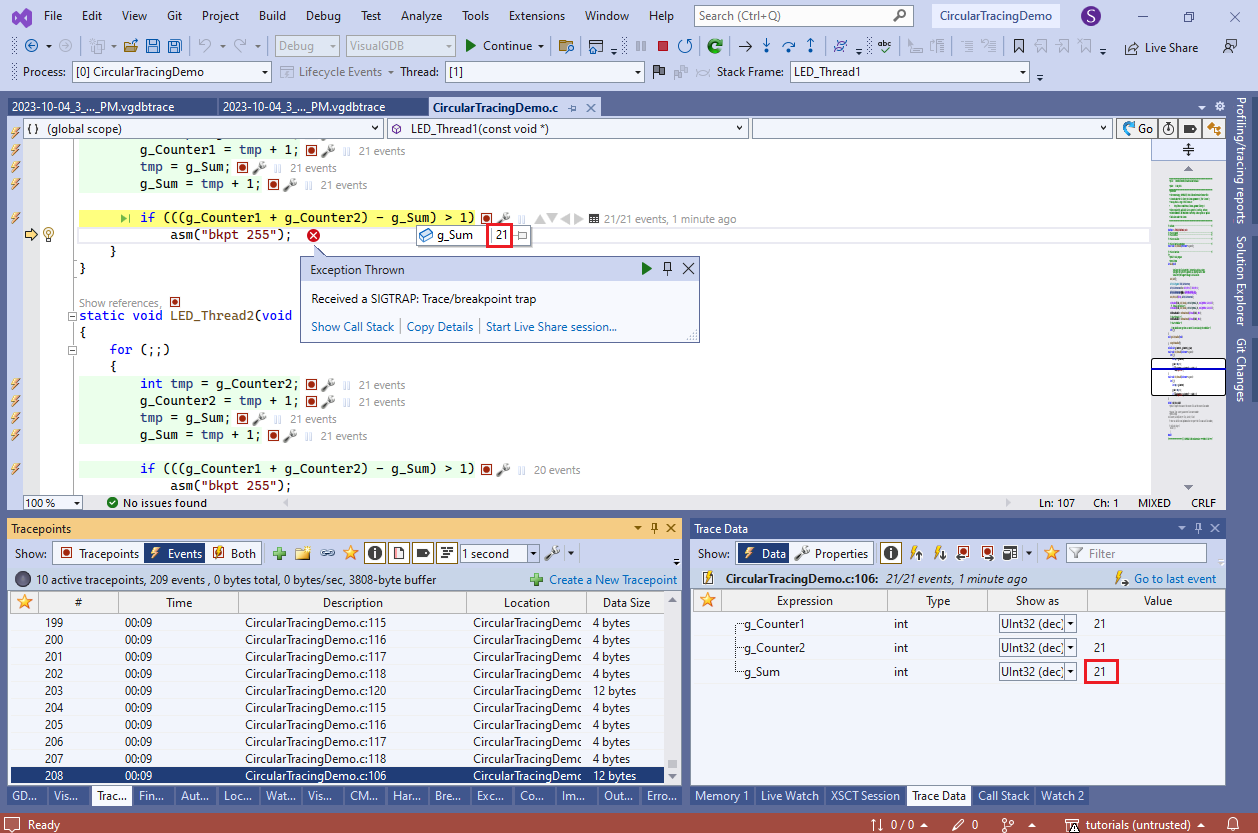
- Use the navigation buttons to walk back to the previous events and see what happened before the breakpoint got triggered:
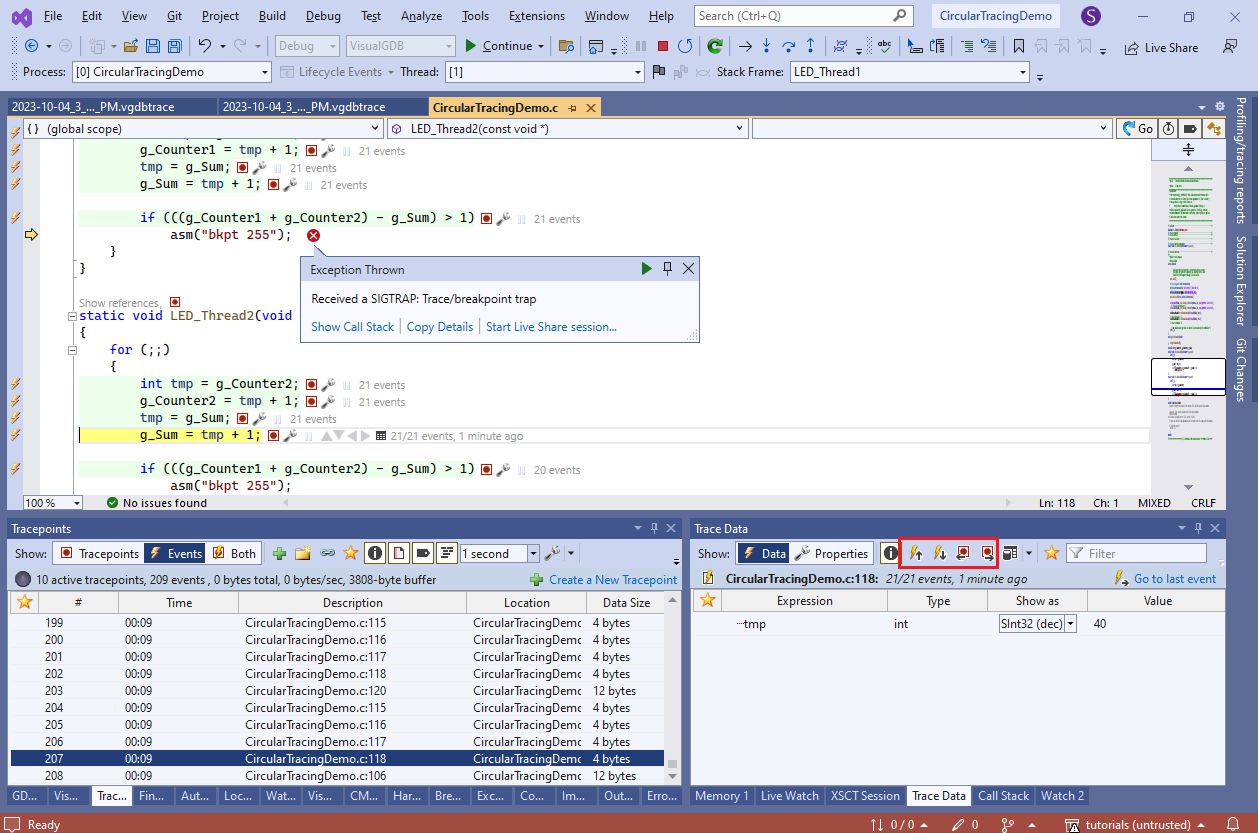 You will see that just before the failing check (when g_Sum was 21), Thread2 set it to 40 + 1.
 - Click on the “21 events” label near the g_Sum assignment in Thread1. VisualGDB will load the last event recorded there (#103), showing that tmp had a value of 20 back then:
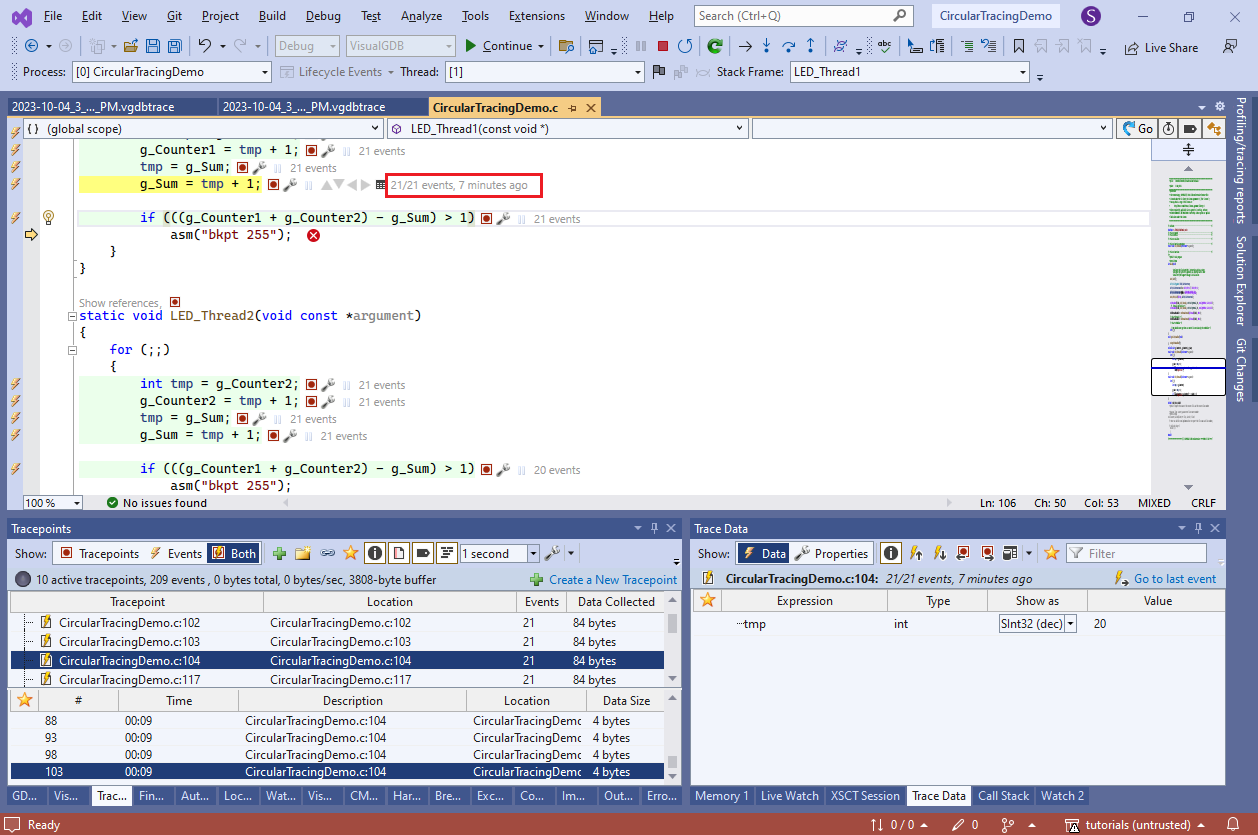 This explains what exactly happened before the crash:
- LED_Thread1 started setting g_Sum to 21 [event #103].
- FreeRTOS switched to LED_Thread2.
- LED_Thread2 ran a few iterations, advancing sum all the way to 41 [event #207].
- FreeRTOS switched back to LED_Thread1.
- LED_Thread1 finished writing 21 to g_Sum, effectively rolling it back by 20.
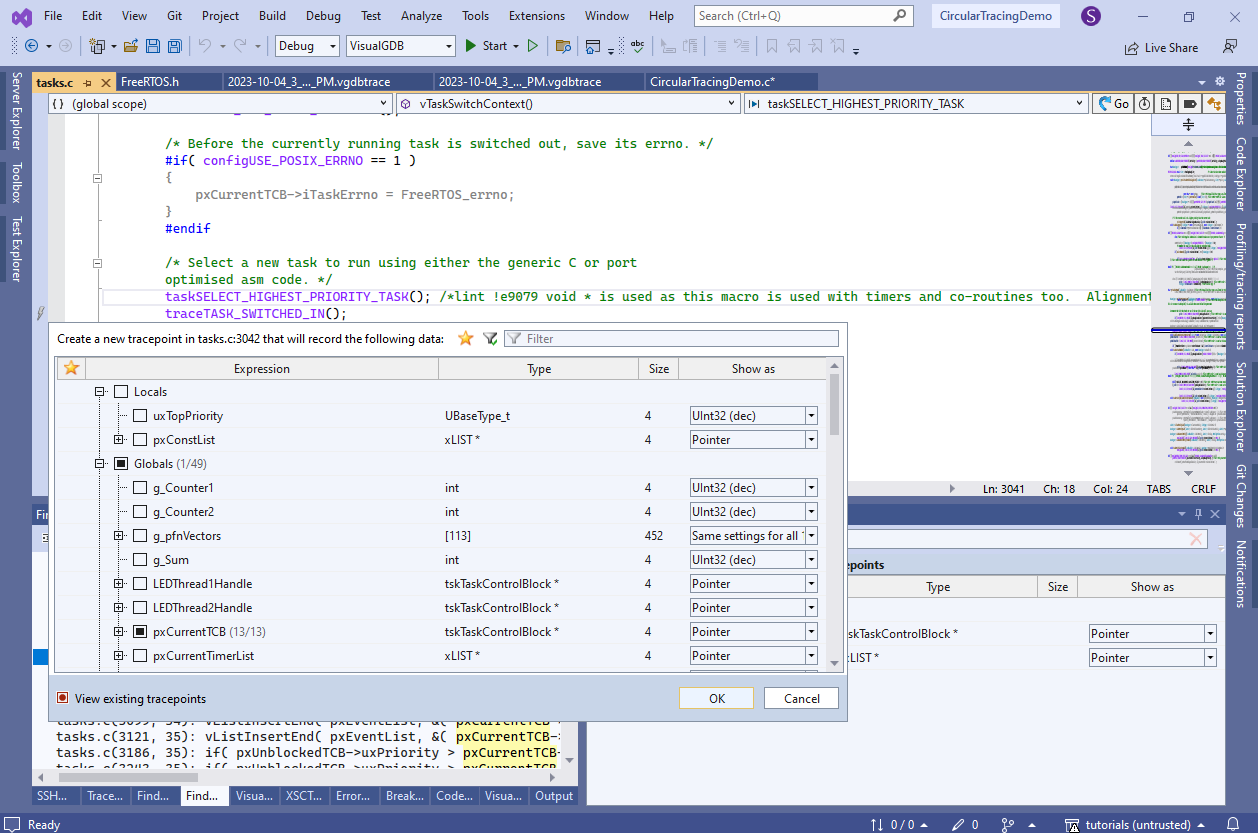
- You can easily collect the current thread value and thread switches via Live Tracing. Select all tracepoints in the Tracepoints window and check pxCurrentTCB inside the view to begin tracing it:

- Add another tracepoint in tasks.c on the traceTASK_SWITCHED_IN() line inside vTaskSwitchContext():
- VisualGDB will now show how pxCurrentTCB got changed between the events, and will even capture the exact moment of the switch:
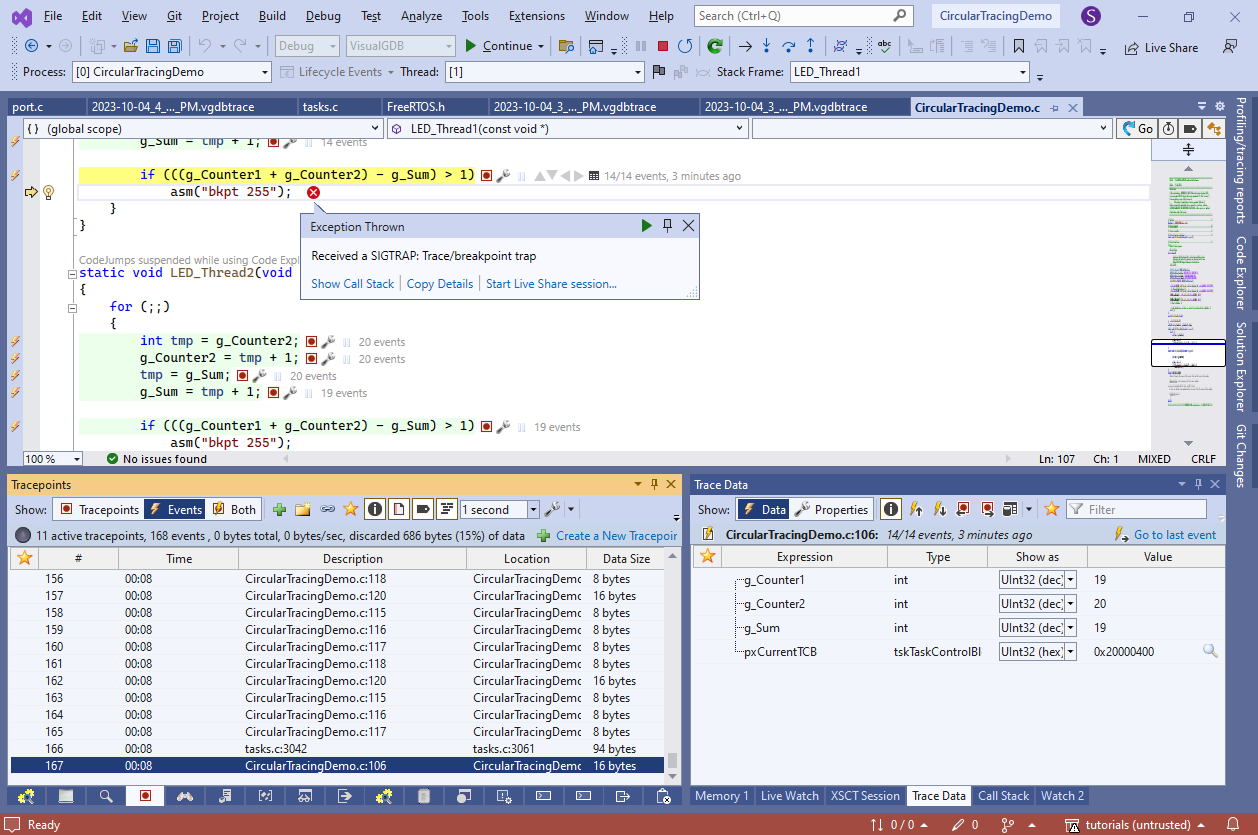
- If you selected to trace additional fields of pxCurrentTCB in the task switch tracepoint, you can see the state of the thread that was just switching in (e.g. its stack pointer, number of held mutexes, etc):
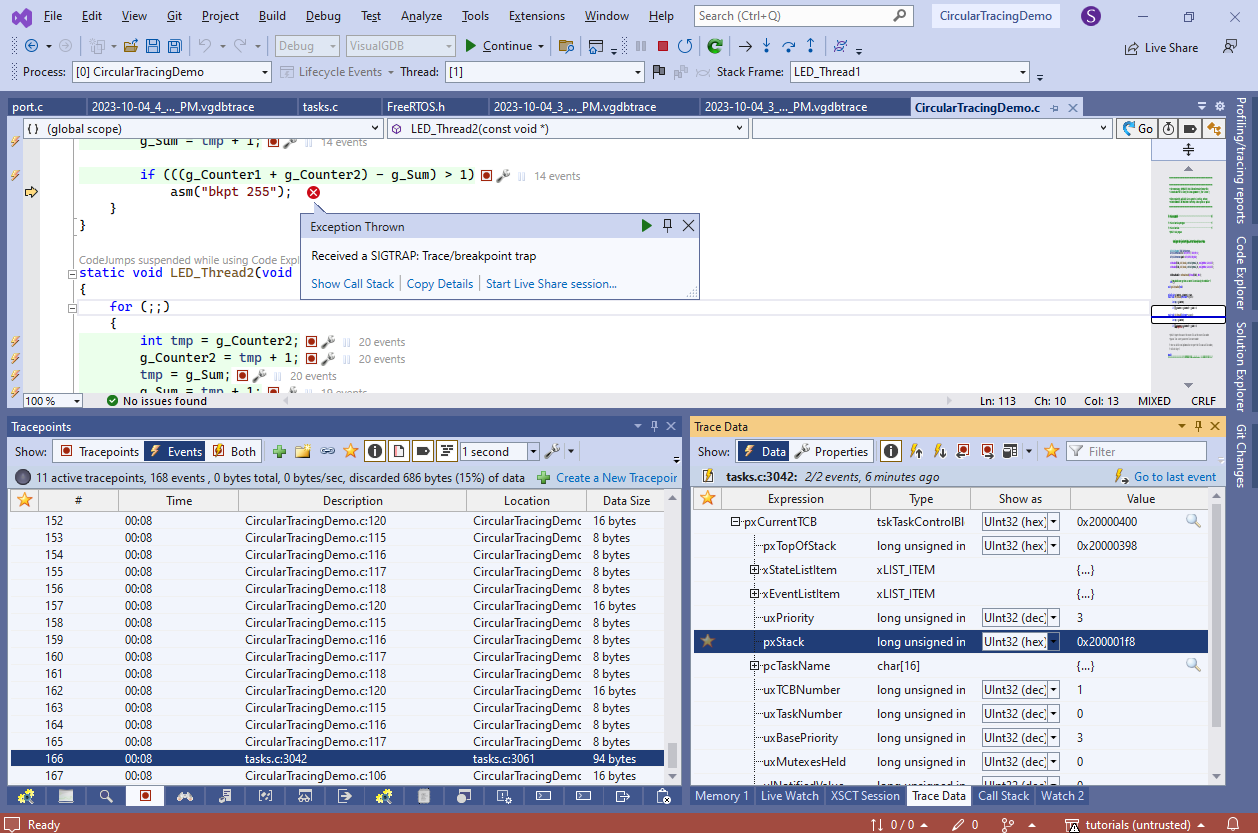 Live Tracing is very flexible – you can record the state of any object (e.g. custom mutex or some variables in your code) at any point in time (thread switches, interrupts, any other function calls or source lines being executed) and analyze it when you need it.