Using the CppUTest framework with STM32 devices
This tutorial shows how to use the CppUTest framework with the STM32 devices. We will create a basic test project, show how it runs on the target device, and will use the Software Tracing functionality to record the function calls inside the test program.
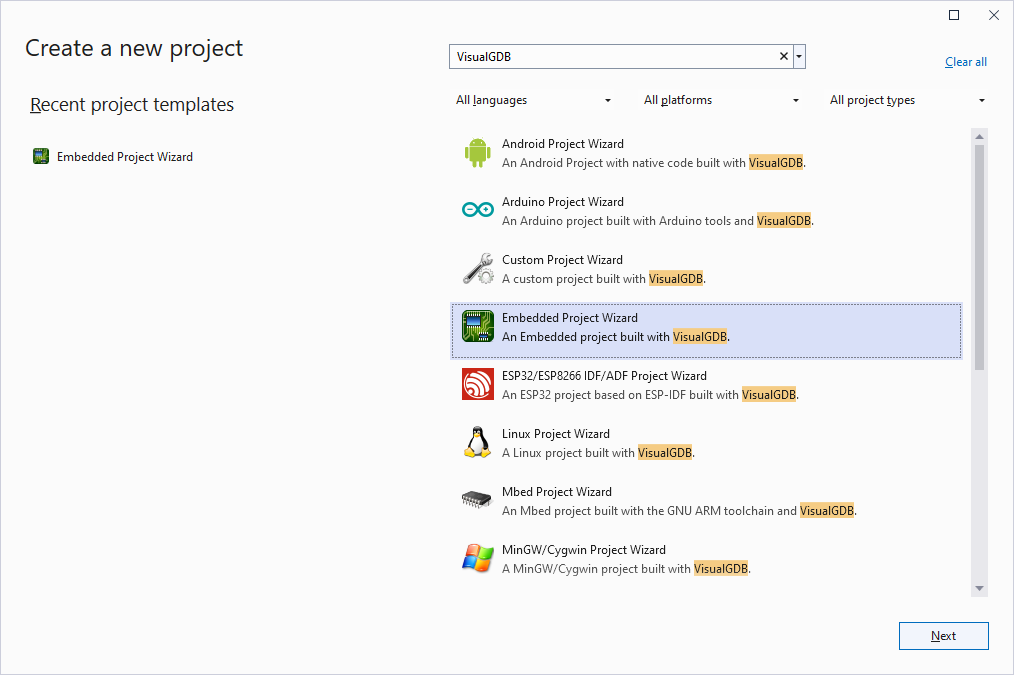
- Start Visual Studio and launch the VisualGDB Embedded Project Wizard:
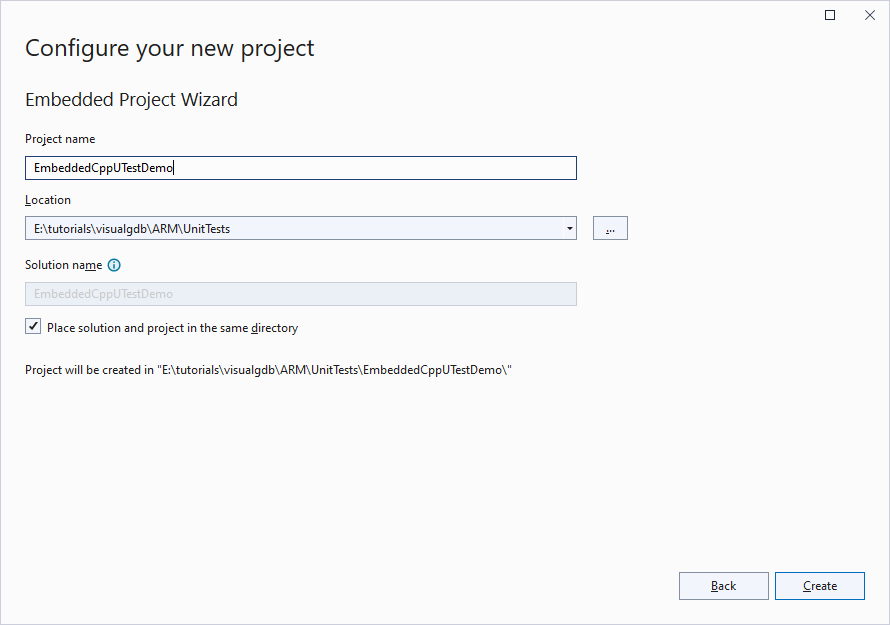
- Enter the name and location for the project:
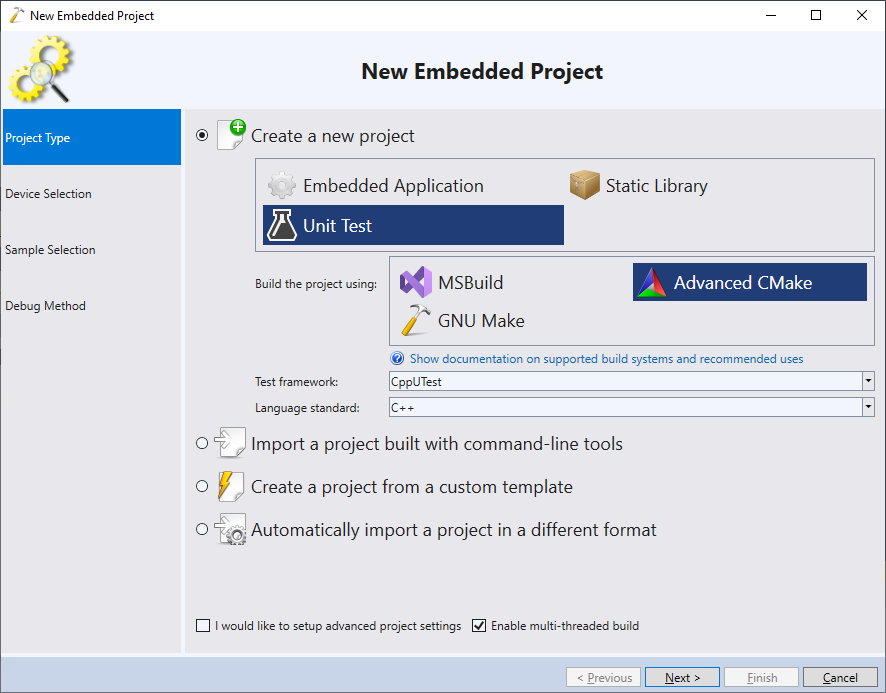
- Select “Create a New Project -> Unit Test -> Advanced CMake -> CppUTest“:
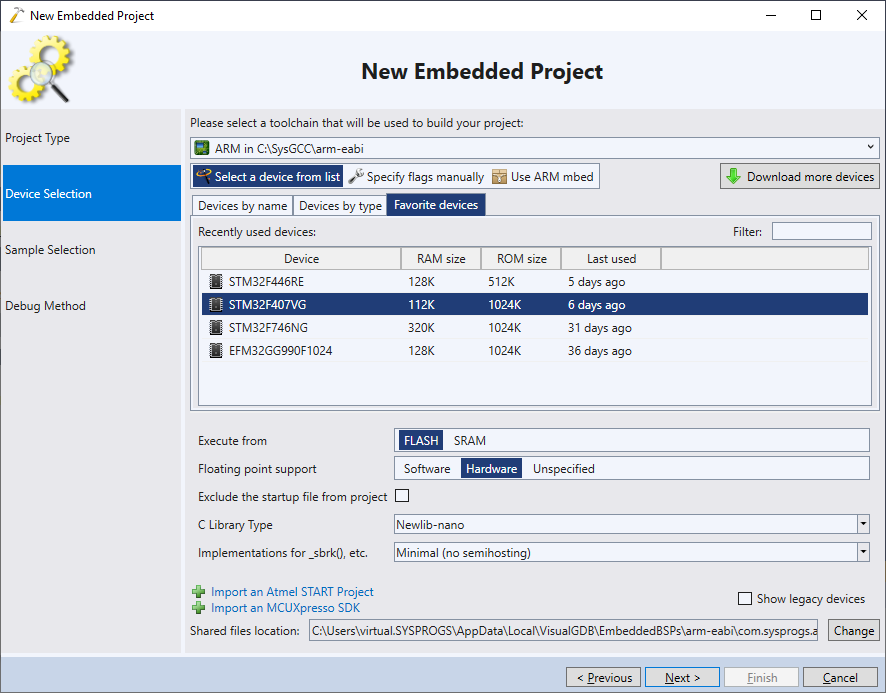
- Select the ARM toolchain and choose the device you would like to target:
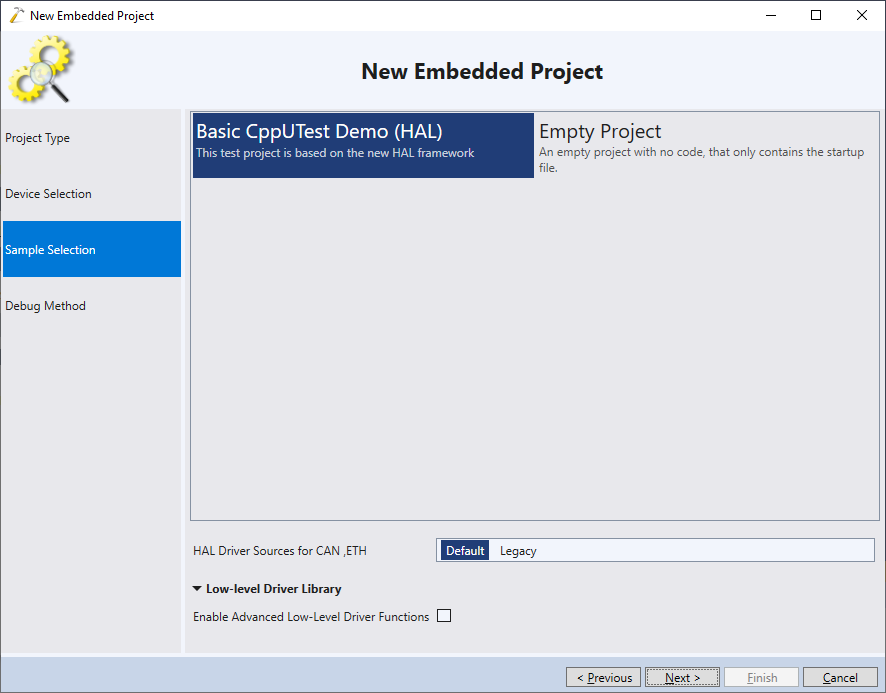
- Proceed with the default project sample:
- Finally, choose the debugging settings that work with your setup and click “Finish”:
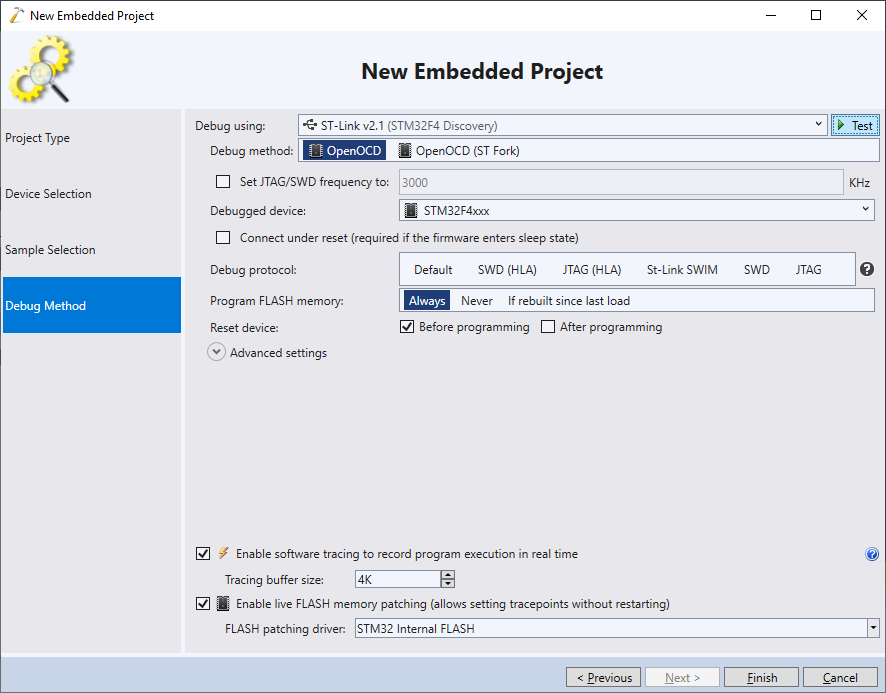 You can keep the FLASH patching and tracing enabled even if you are not planning to use them. Unless you actually create tracepoints, these settings will not add any extra overhead.
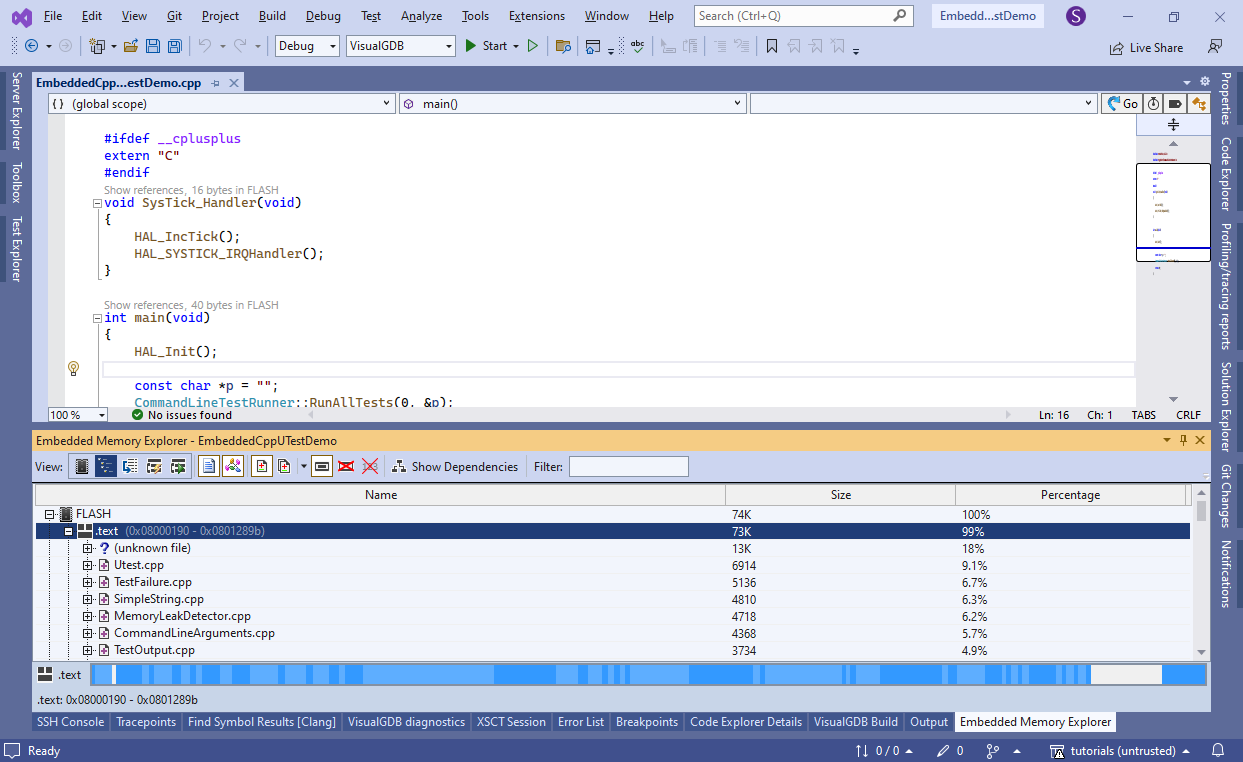
 - Build the project. Note that the CppUTest framework has a non-trivial memory footprint (almost 75KB in this example). If this is too much for your device, consider using our TinyEmbeddedTest framework instead.
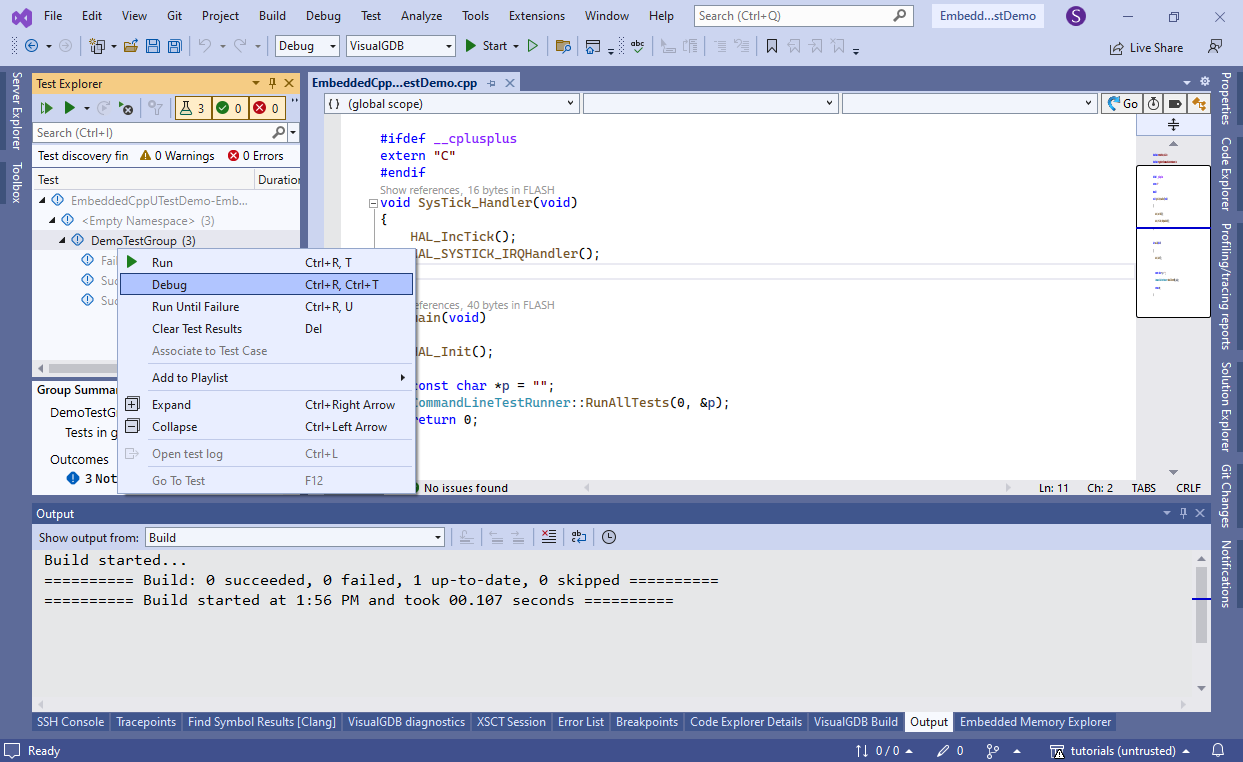
- Open Test Explorer, right-click on the test group and select “Debug”:
- VisualGDB will automatically launch the tests and will stop on the first failure:
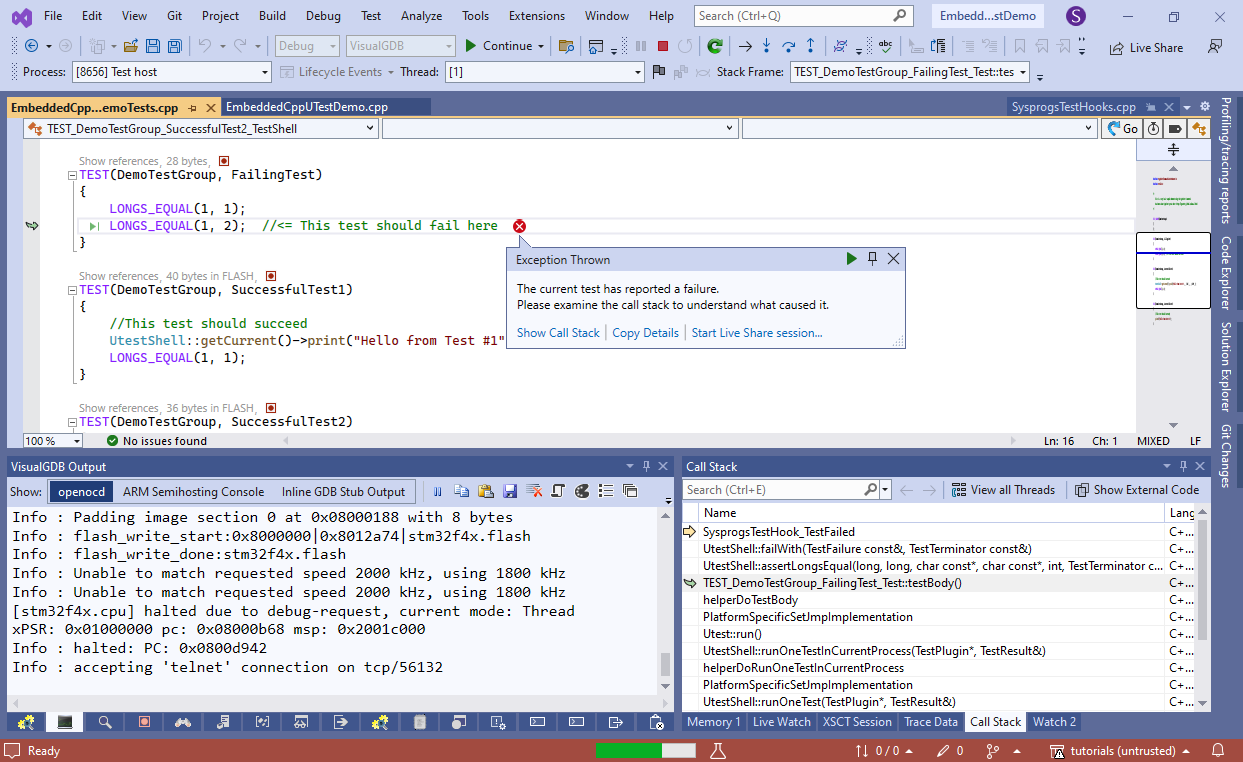 You can also use “Run” instead of “Debug” if you do not want to stop at test failures.
 - Use the Call Stack window to see how the unit test function got reached. The main() function called CommandLineTestRunner::RunAllTests(), that in turn launched the tests your selected via Test Explorer. If you only selected a specific test or a test group, VisualGDB would automatically patch the test list, preventing other tests from running:
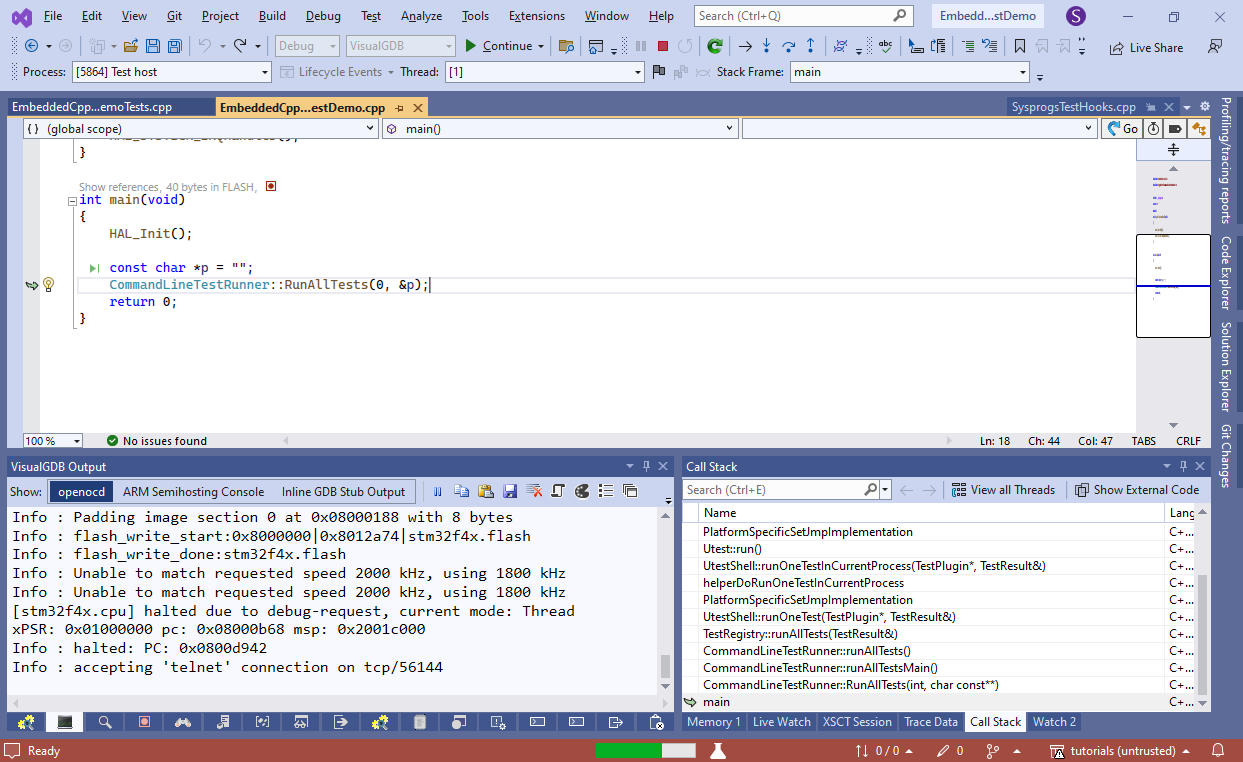 If you are planning to add tests to an existing embedded project by referencing the test framework, ensure your implementation of main() also calls CommandLineTestRunner::RunAllTests().
 - Open a command prompt window in the project directory and run the following command line:
"%VISUALGDB_DIR%\VisualGDB.exe" /runtests EmbeddedCppUTestDemo.vgdbcmake /TargetPath:build\VisualGDB\Debug\EmbeddedCppUTestDemo /output:TestResults.xml
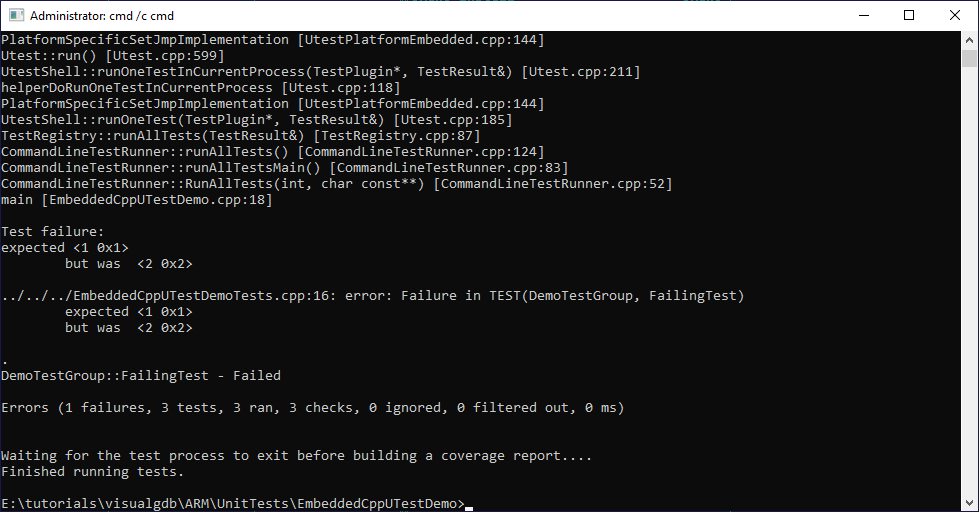 It will automatically upload the test application into the device, run the tests there and save the report in the TestResults.xml file. See this page for more information about running tests via command line.
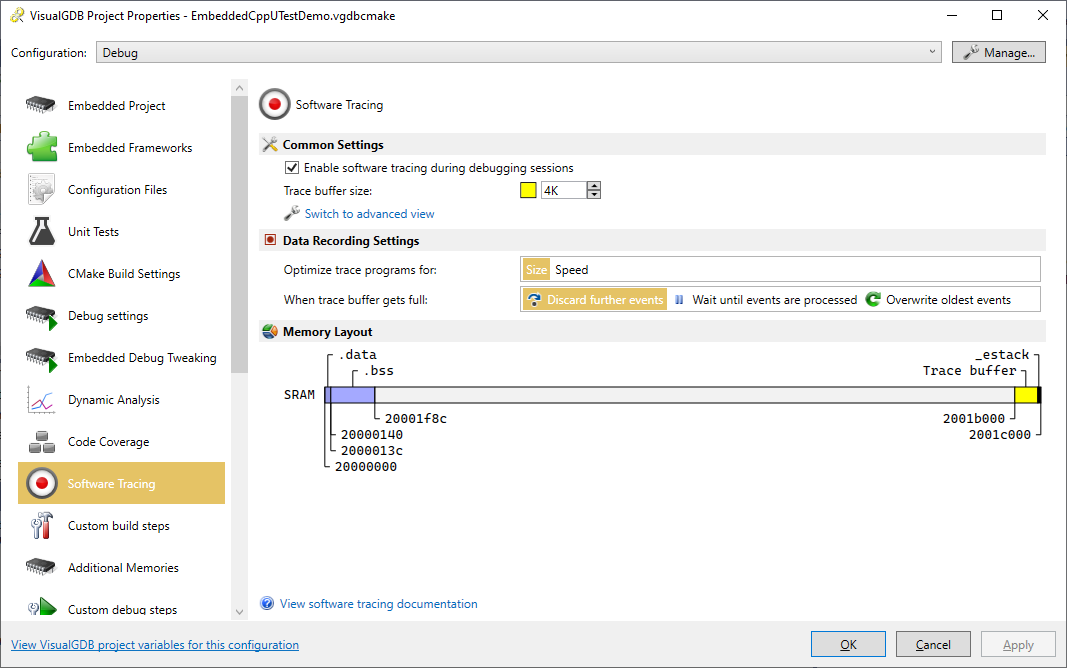
 - Now we will show how to use Software Tracing to record all function calls in the test project. Ensure the Software Tracing is enabled via VisualGDB Project Properties:
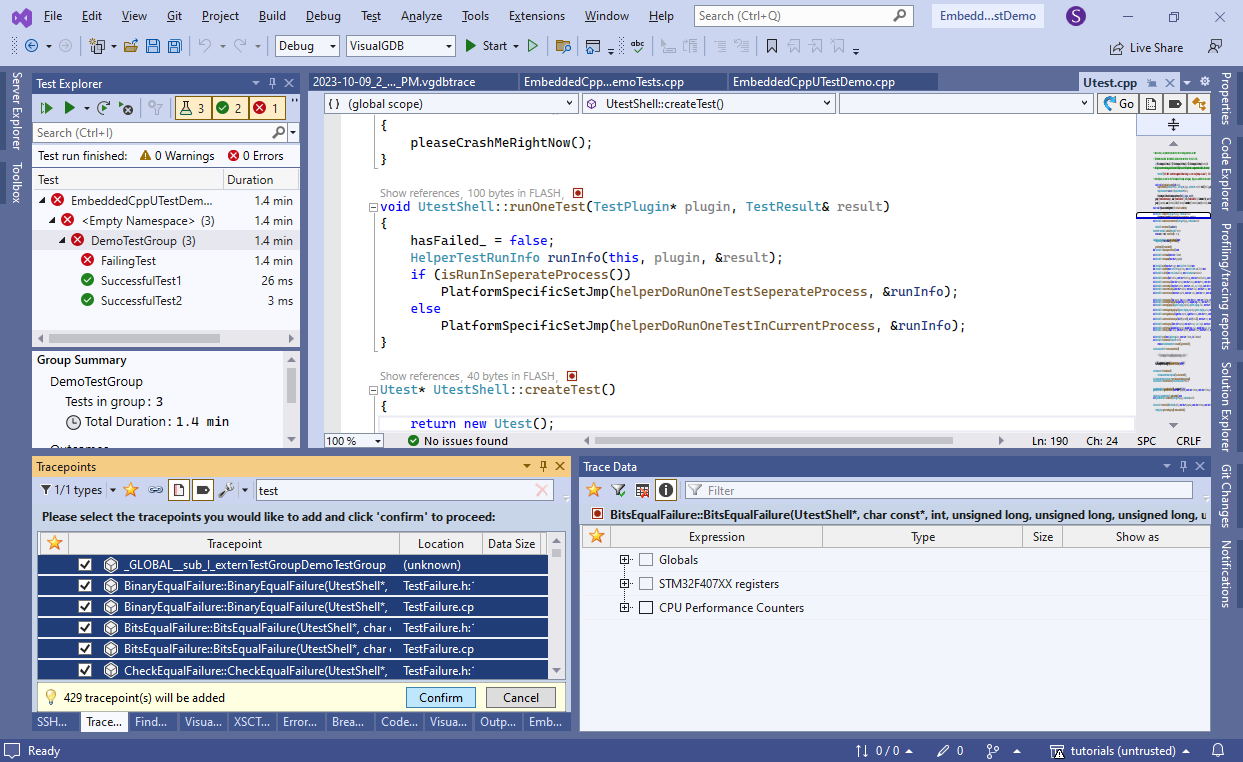
- Use the Debug->Windows->Live Tracing window to add tracepoints in every function that has “test” in the name:
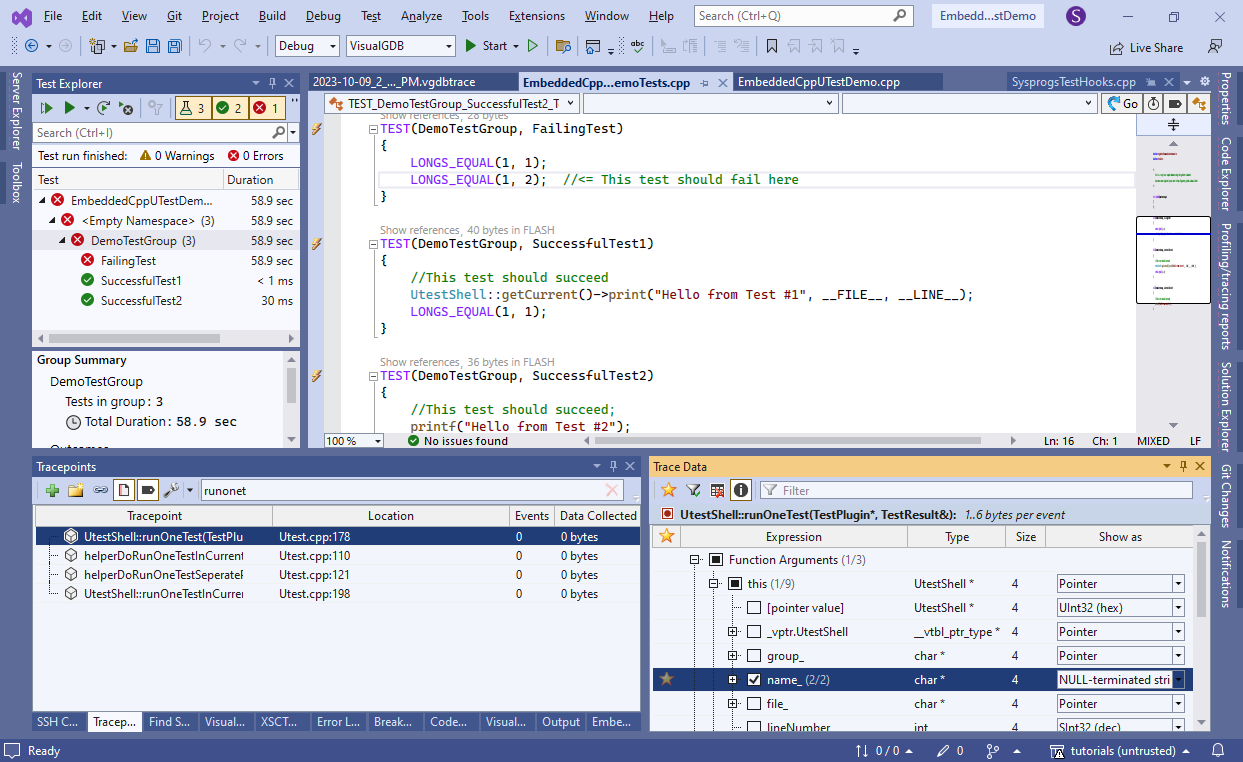
- Explicitly configure the runOneTest() tracepoint to trace this->name_ as a NULL-terminated string:
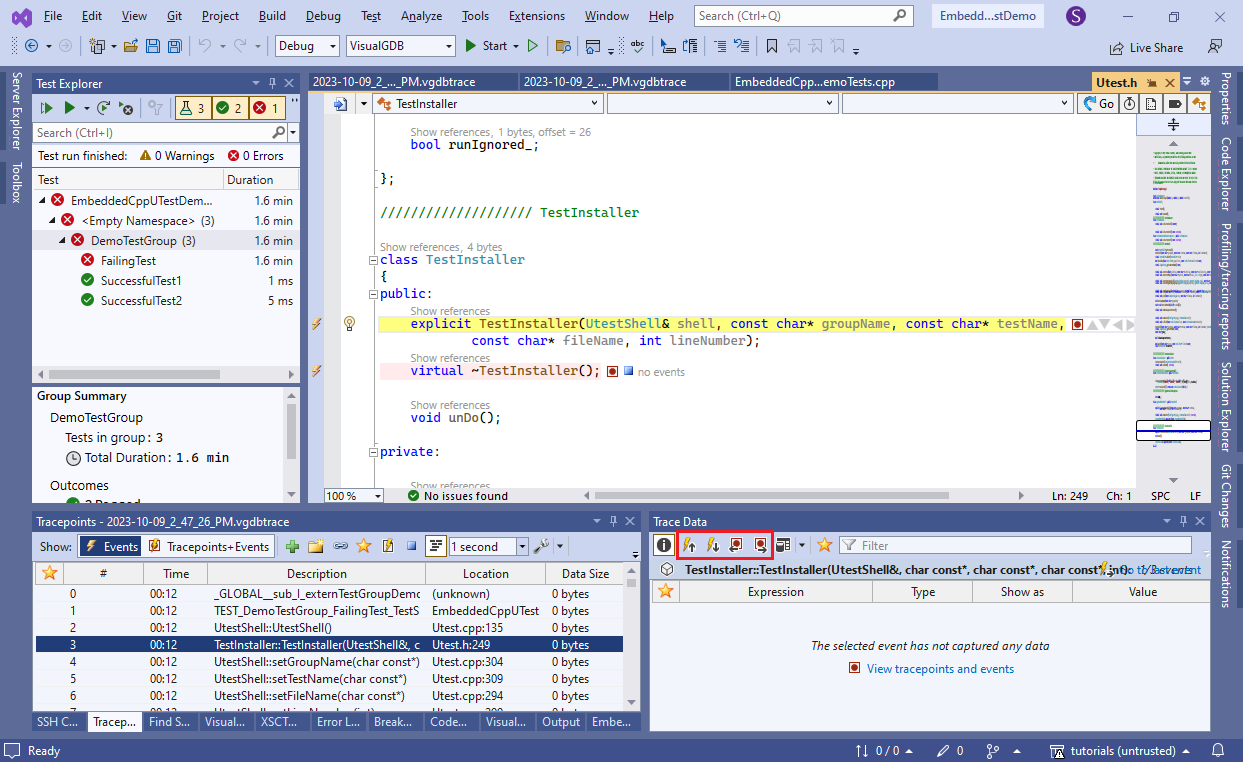
- If you debug your tests now, VisualGDB will record all selected function calls and show them in Debug->Windows->Live Tracing->Events, so you can see what exactly happened before the test failure:
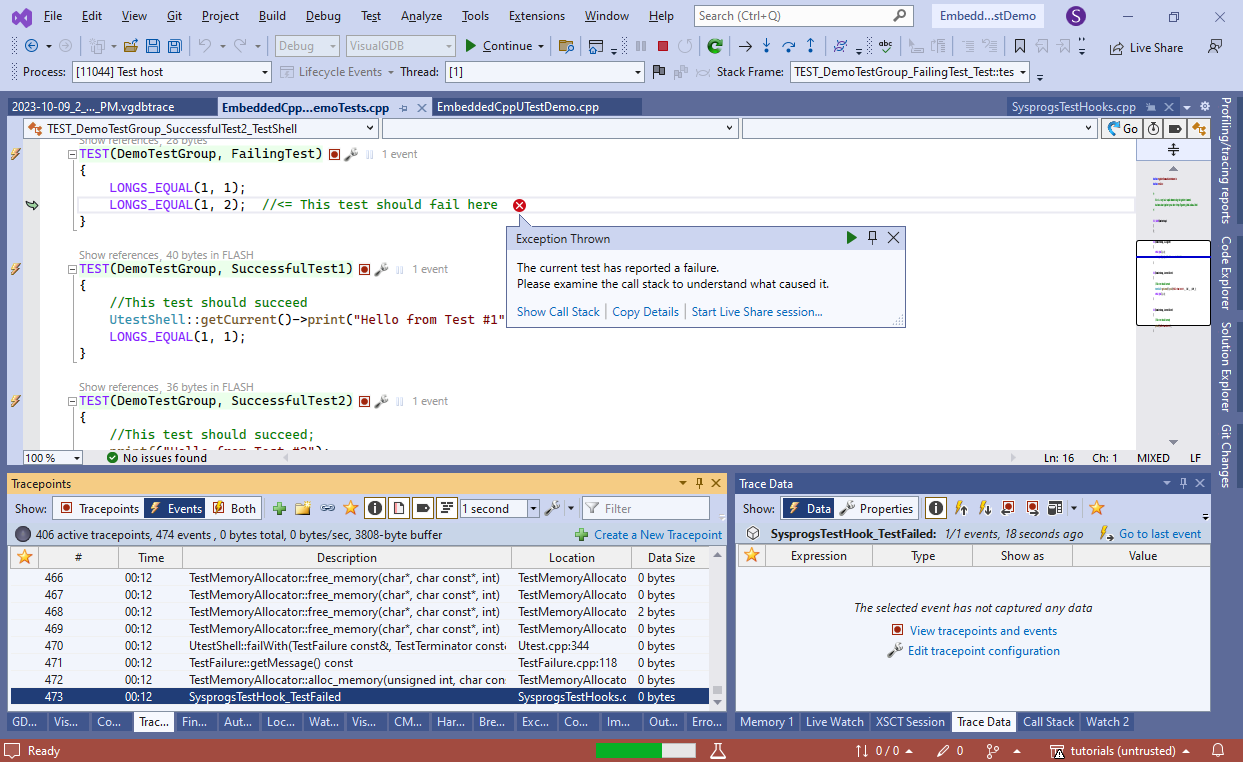
- As we only configured the runOneTest() tracepoint to capture data (test name), other events will contain no data. Select an event from the runOneTest() tracepoint to see the actual test name recorded by it. If there are too many events to view each one separately, you can use the data views in the Trace Data window to create a table where each event will represent a row, and each column will show a particular data item:

- Once you end the debug session, VisualGDB will create a tracing report containing all the recorded data:
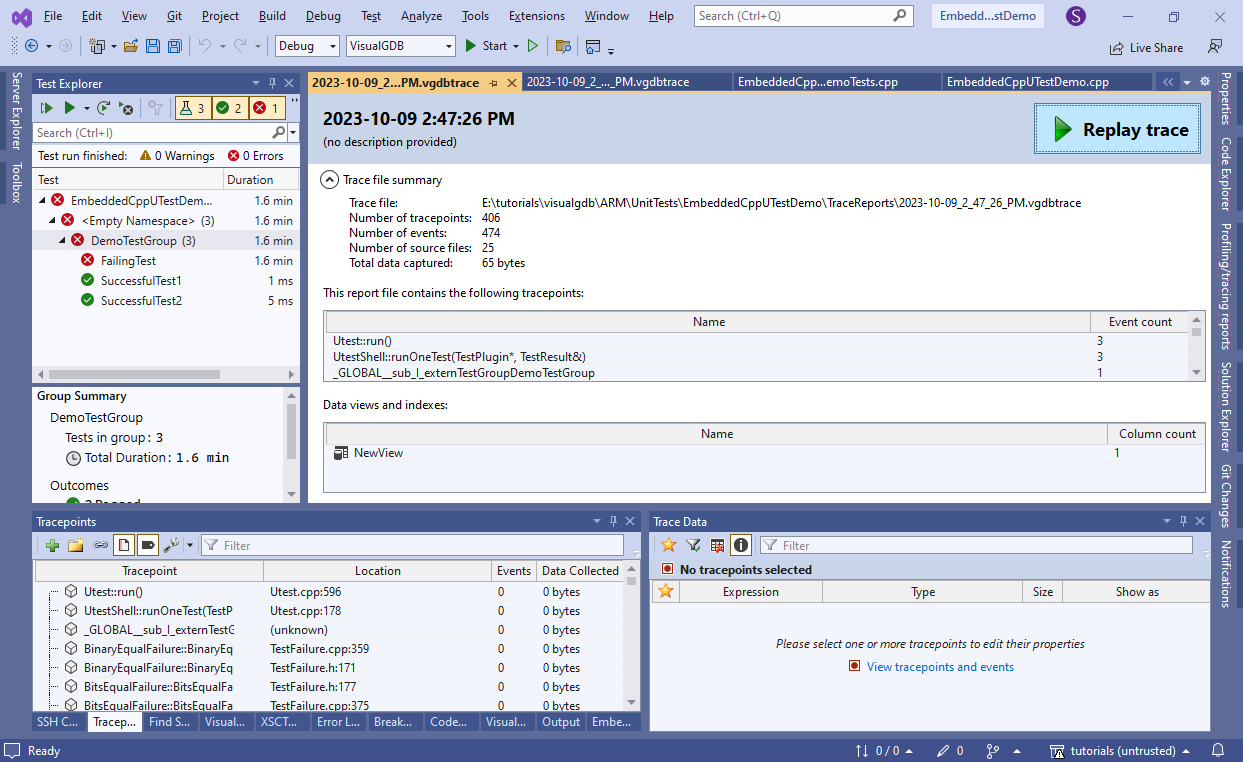
- You can replay the trace reports at any time and use the navigation buttons to step between events and review the recorded data: