Developing Xilinx Vitis Projects with VisualGDB
This tutorial shows how to use VisualGDB to build, edit and debug projects based on the Xilinx Vitis platform. We will demonstrate how to import a basic Vitis workspace into VisualGDB, use the VisualGDB functionality to build and analyze the code, and also how to debug the project from Visual Studio.
Before you begin, install VisualGDB 5.6 or later.
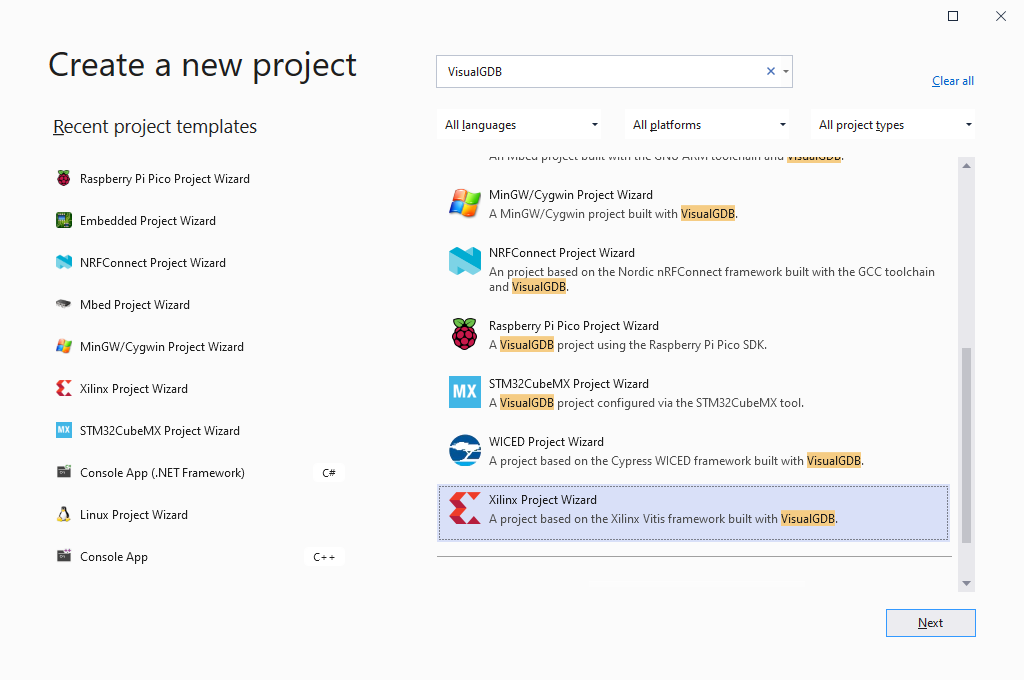
- Start Visual Studio and open the VisualGDB Xilinx Project Wizard:
- Enter your project name and location, then click “Create” to launch the VisualGDB-specific part of the wizard:

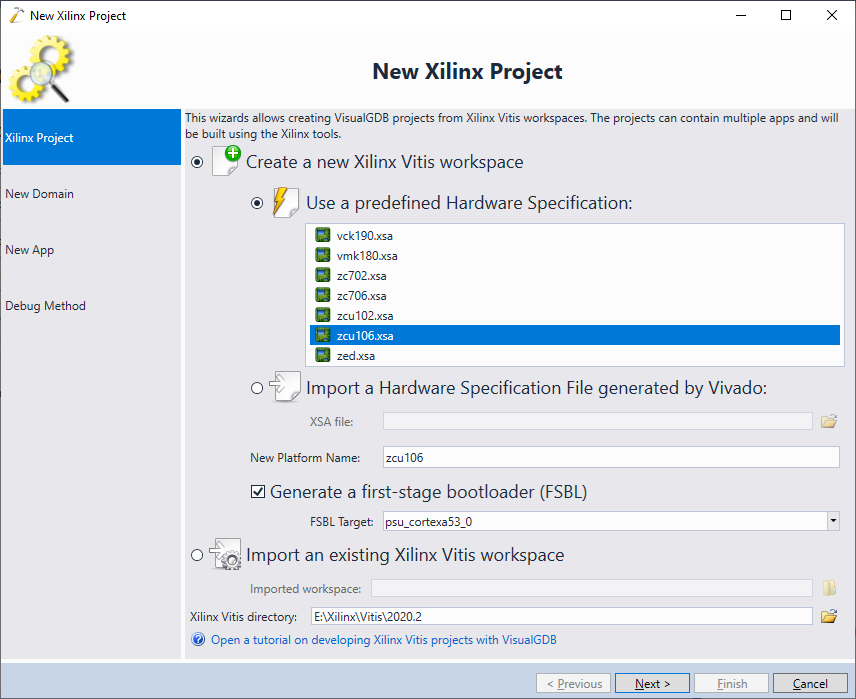
- The first page of the New Xilinx Project Wizard allows choosing between creating a new project and opening an existing Xilinx Vitis workspace. In this tutorial we will create a new project from scratch, so make sure the Xilinx Vitis directory is set correctly at the bottom of the page, and then select “Create a new Xilinx Vitis workspace”. If you are targeting one of the Xilinx evaluation boards, simply choose the corresponding hardware specification file from the list. Otherwise, point VisualGDB to the XSA file for your board exported from Vivado:
- The next page of the wizard allow customizing the initial domain that will be created for your application. A domain is a combination of an operating systems and drivers, that run on a specific CPU inside the Xilinx FPGA. In this tutorial, we proceed with the FreeRTOS OS running on the default processor:

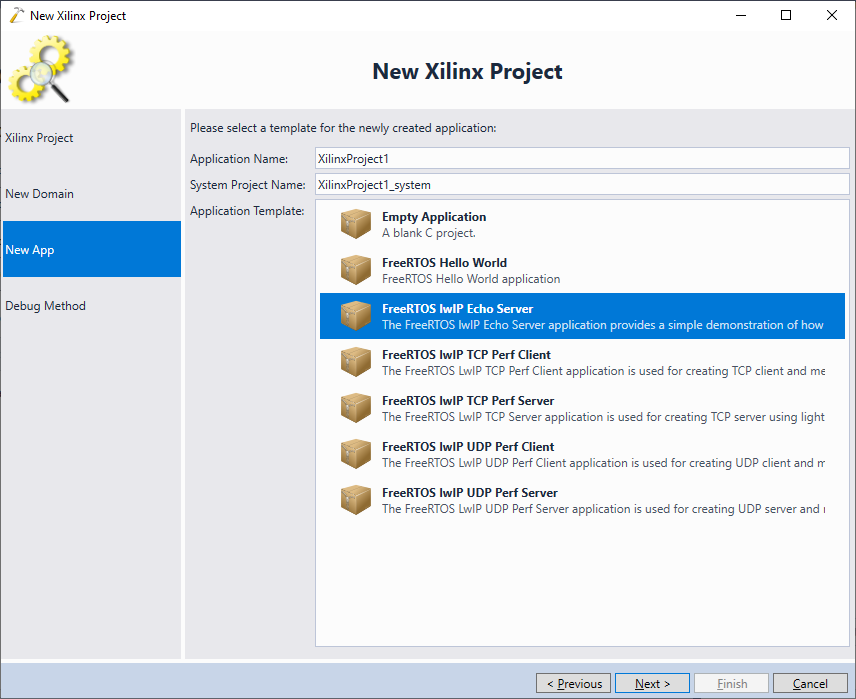
- The “New App” page allows selecting a specific application template that will be used to create the first application. VisualGDB will automatically query the Xilinx Vitis tools for a list of applications compatible with the current hardware specification and OS. Choose “FreeRTOS lwIP Echo Server” and press “Next” to continue:
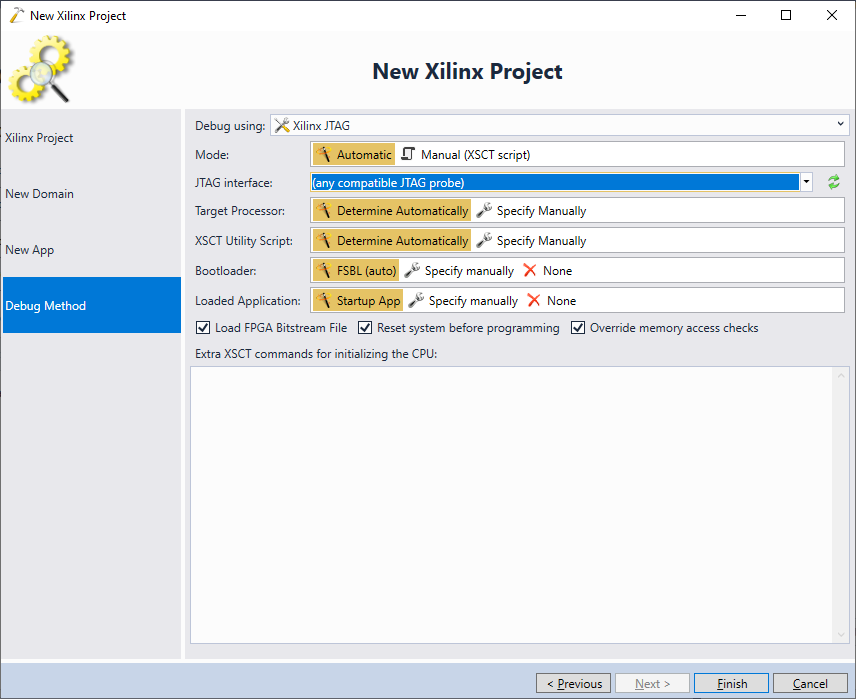
- The last page of the wizard allows configuring the debug settings. VisualGDB uses the same low-level debug tools that the Xilinx Vitis IDE does, so all debug probes compatible with the original Vitis IDE will also work with VisualGDB, as long as you select the “Xilinx JTAG” debug method in the “Debug Methods” view. Plug in your debug probe and select the JTAG interface from the list (or proceed with the “any compatible JTAG probe”) setting:
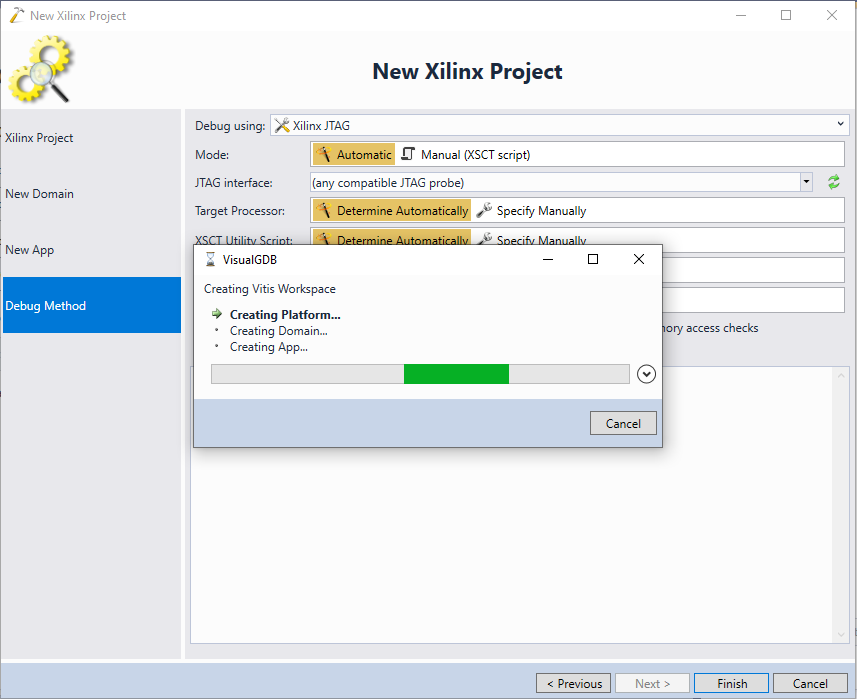
- Press “Finish” to generate your project. VisualGDB will use the XSCT tool (the back-end used by the Vitis IDE) to create the platform, domain and application based on the selected settings:
- Once the project is created, the platforms, systems, domains and BSPs will appear in Solution Explorer. The IntelliSense will be automatically configured based on the settings extracted from these components:
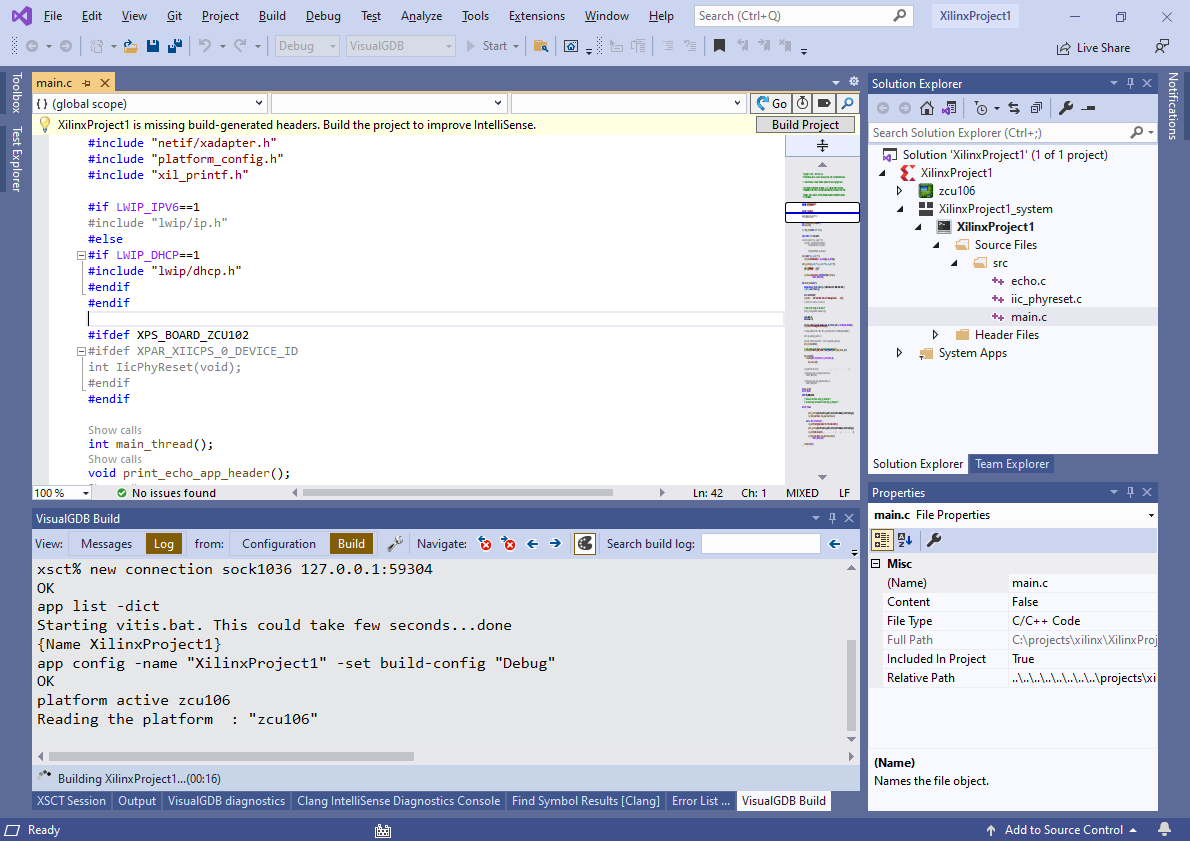
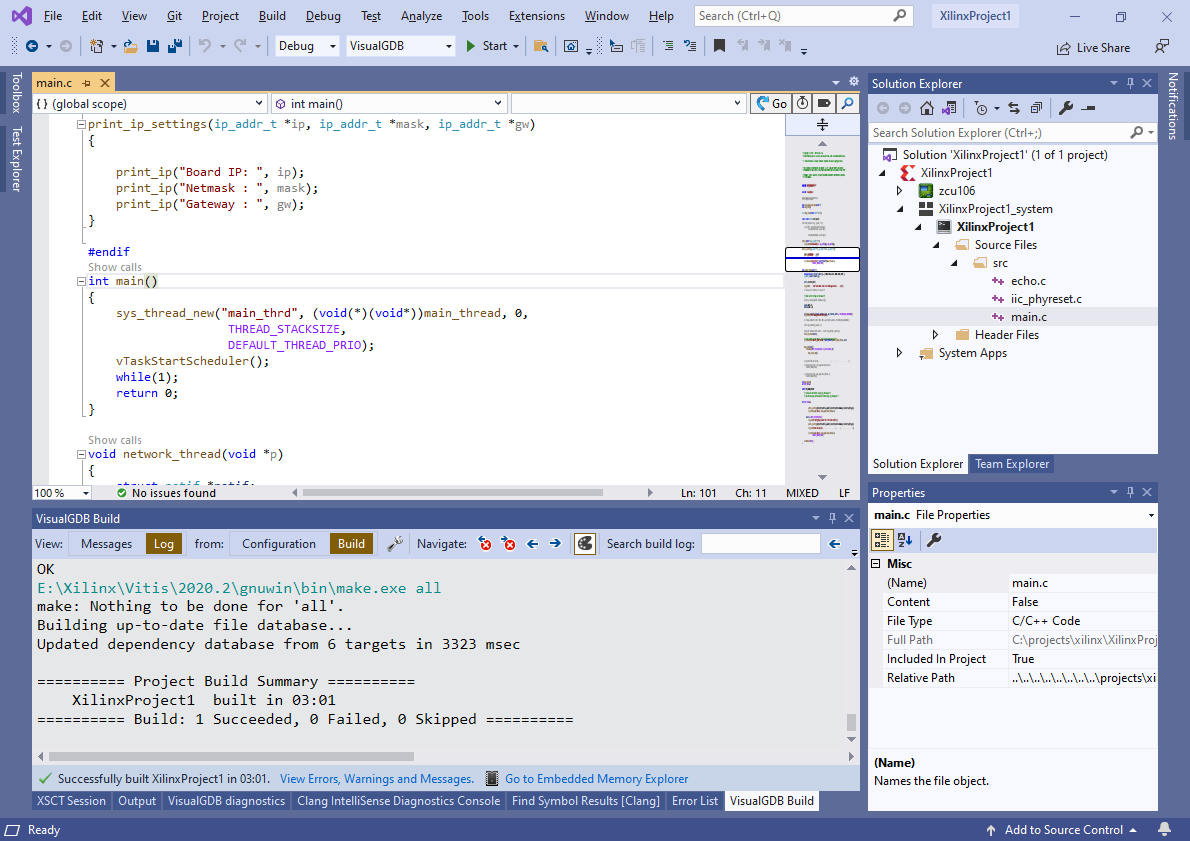
- Build the project by pressing Ctrl-Shift-B. VisualGDB will automatically invoke the Xilinx build process via the XSCT interface, so the build result will 100% match the output of the Vitis IDE:
 If the build fails, make sure the same project is not open in Eclipse or another instance of Visual Studio.
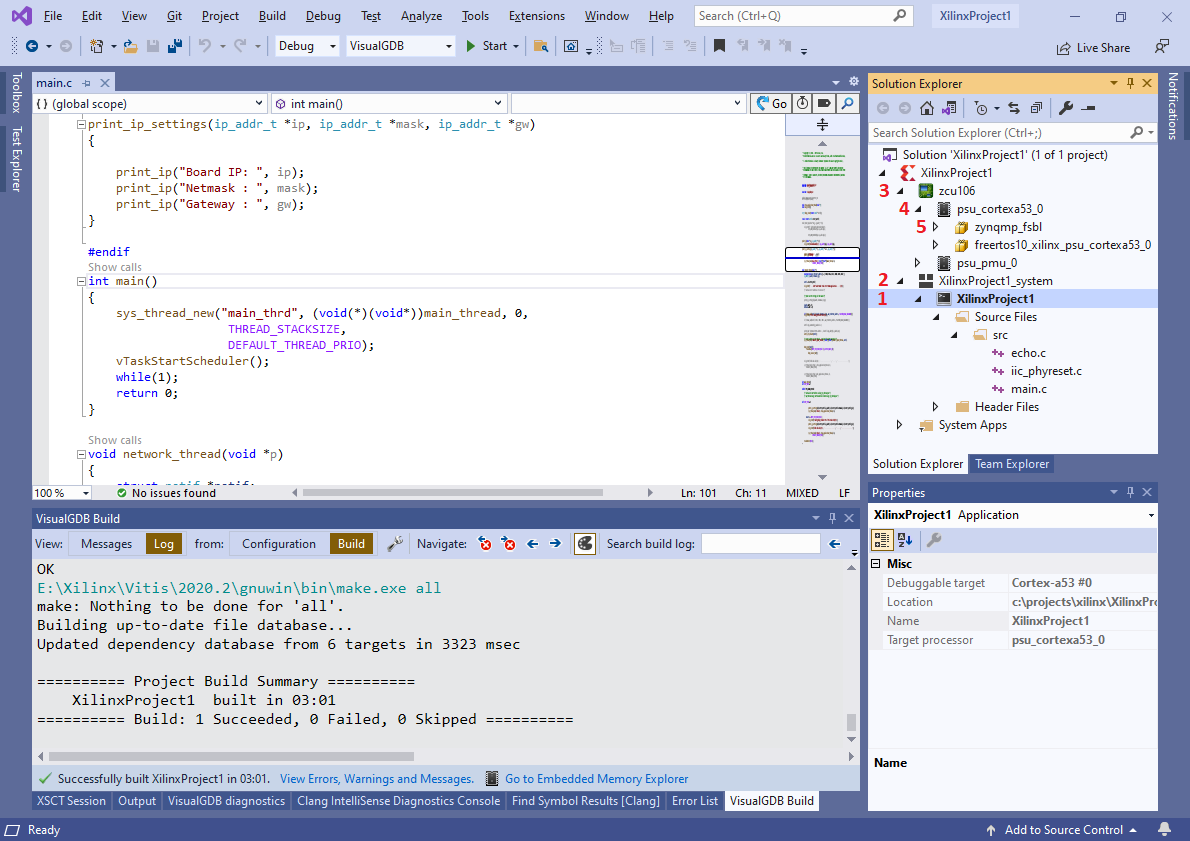
 - Note how Solution Explorer shows Applications (1), Systems (2), Platforms (3), CPUs (4) and BSPs (5):
- Locate the node for the main application, right-click on it and select “Properties”. VisualGDB will open a Properties window showing the common properties of the application:
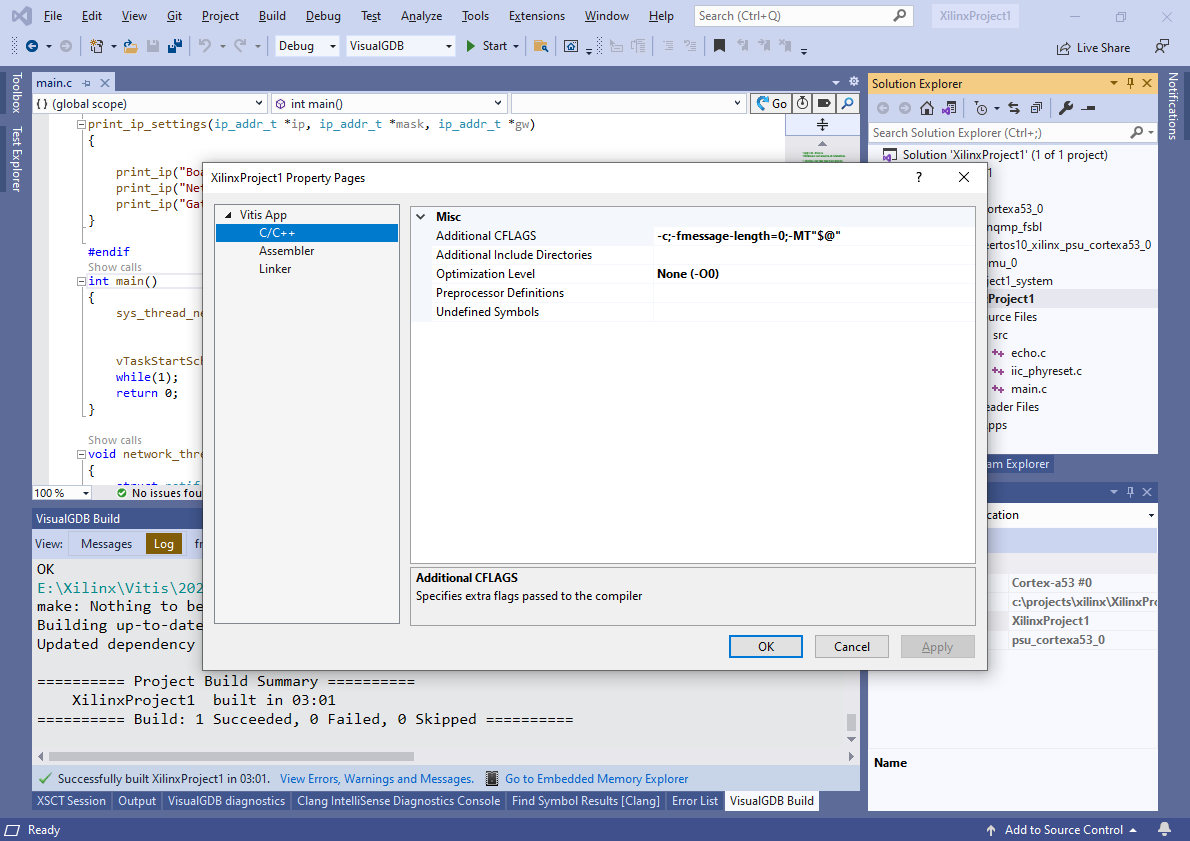 Note that these properties are automatically synchronized with the Eclipse project via the XSCT interfaces. I.e. changing them in Visual Studio will affect Eclipse and vice versa.
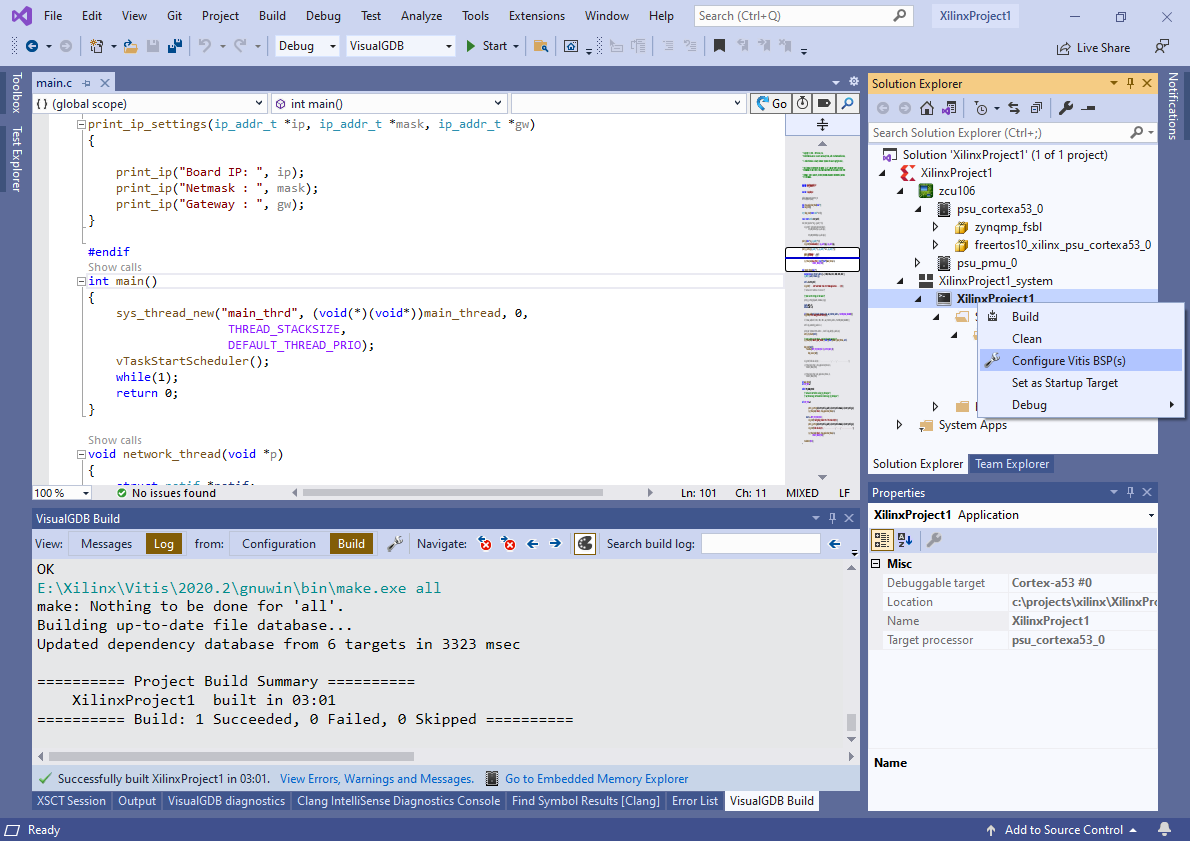
 - VisualGDB provides a graphical interface for editing various settings of the Vitis BSPs. Right-click on the app in Solution Explorer and select “Configure Vitis BSP(s)”:
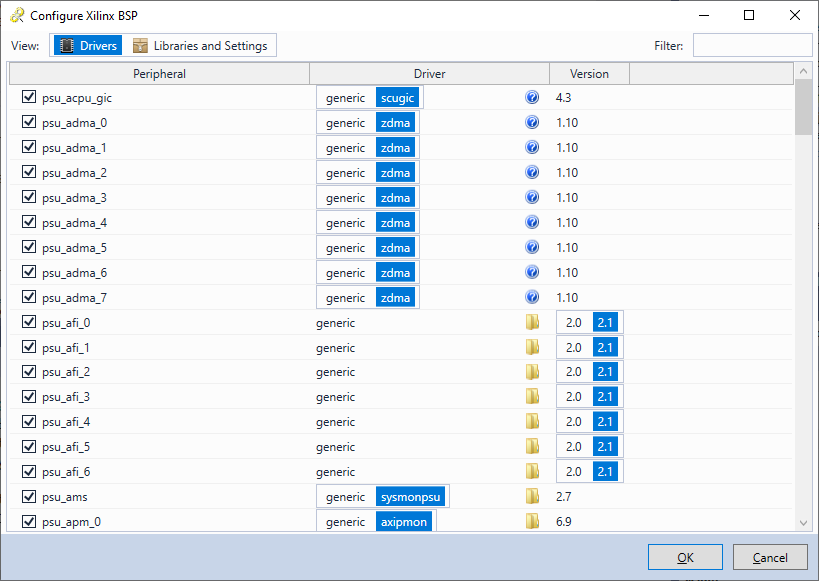
- The BSP configuration window allows enabling/disabling drivers for various peripherals, as well as selecting a specific driver type or version:
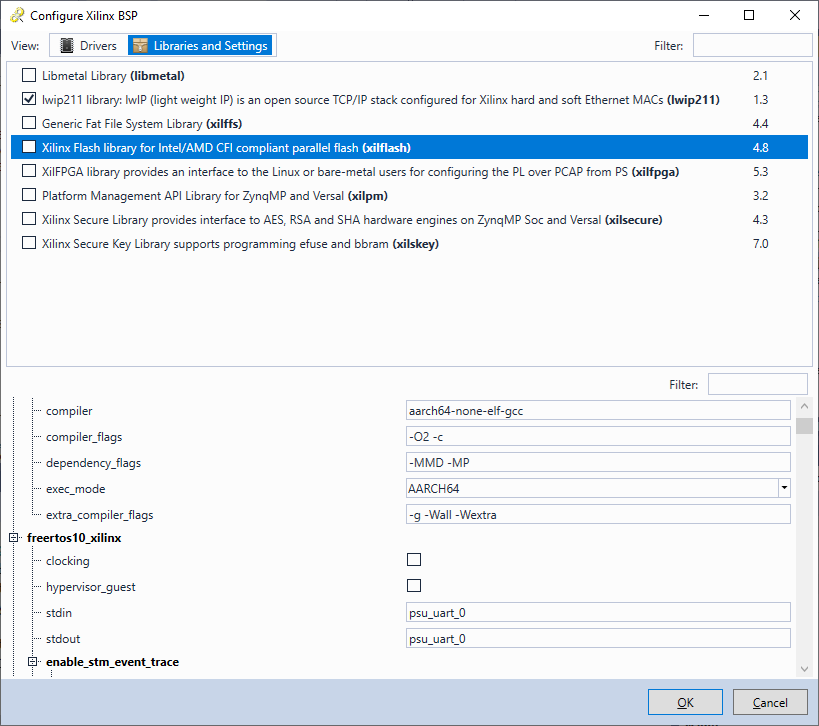
- The “Libraries and Settings” view allows referencing and configuring various reusable libraries. The list of libraries and configuration parameters is automatically managed by the Vitis back-end:
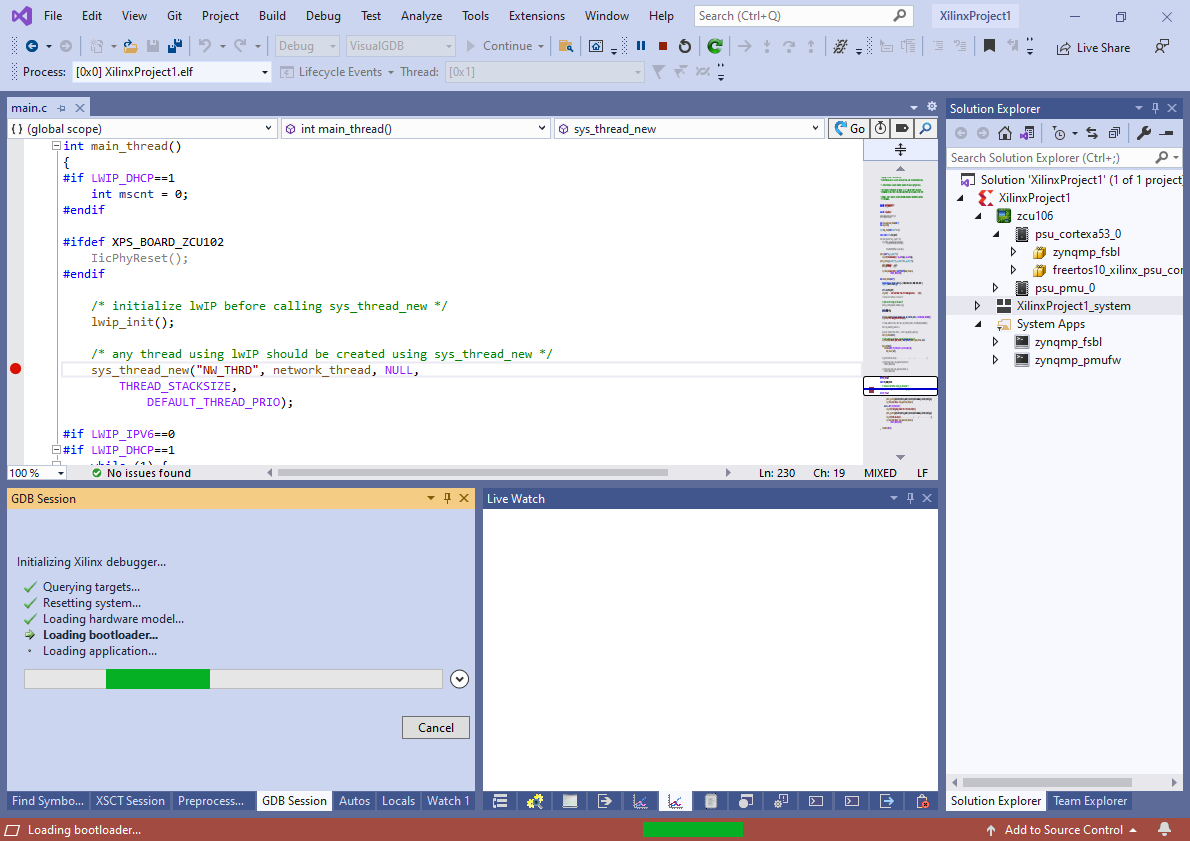
- Now we will show how to debug the projects. Press F5 to begin debugging. VisualGDB will automatically load the first-stage bootloader, let it initialize the hardware, and will then launch the main application:
- Once the main application is launched, your breakpoint will trigger:
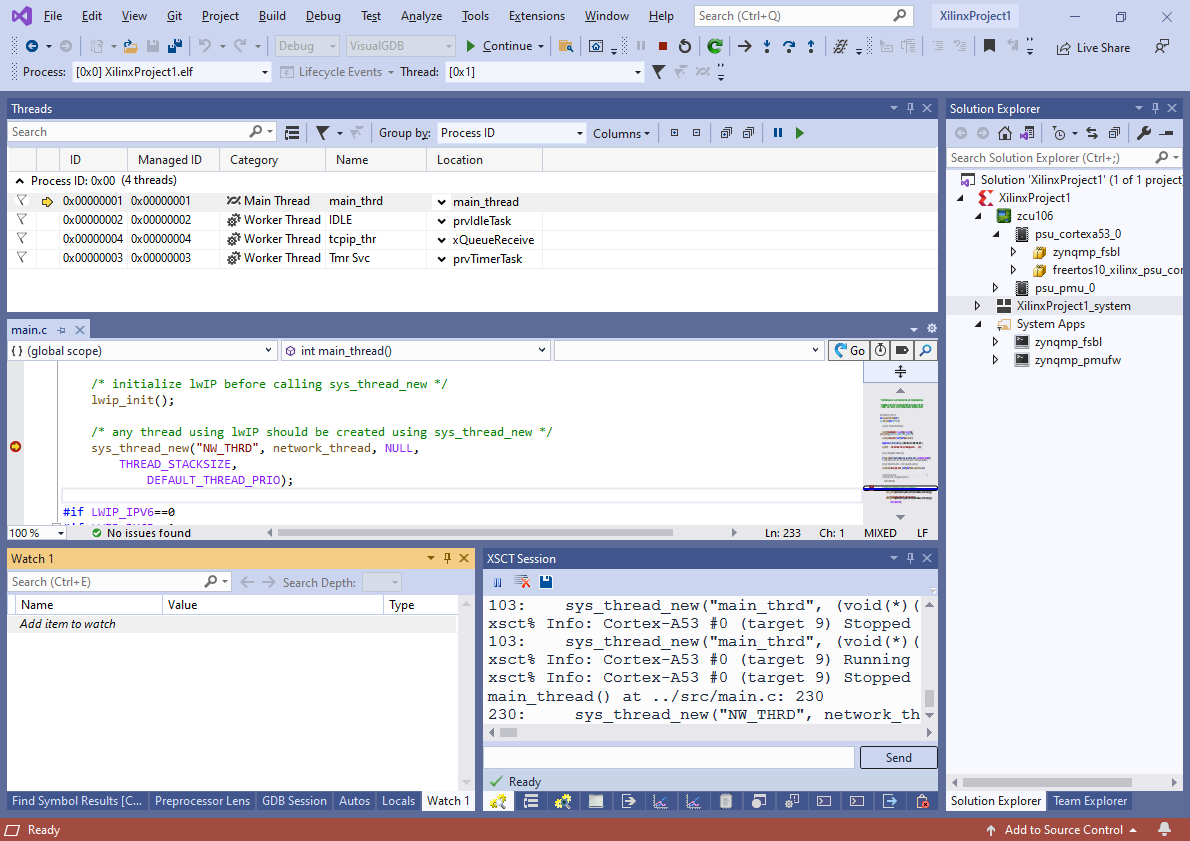 Note that if you are using FreeRTOS, VisualGDB will automatically parse and display the list of FreeRTOS threads.
 - The Xilinx debugger interface supports reading the target memory in the background. Hence you can use the Debug->Windows->Live Watch window to examine the values of various variables while the program is running. If you are using VisualGDB Custom or higher, you can use the FreeRTOS view in Live Watch to view FreeRTOS threads, heap and synchronization primitives:

- VisualGDB provides context menu commands for common Vitis tasks. E.g. you can regenerate a Vitis platform by right-clicking on it in Solution Explorer and selecting “Regenerate Platform with XSCT” or load the FPGA bitstream file by selecting “Load Bitstream into FPGA”:

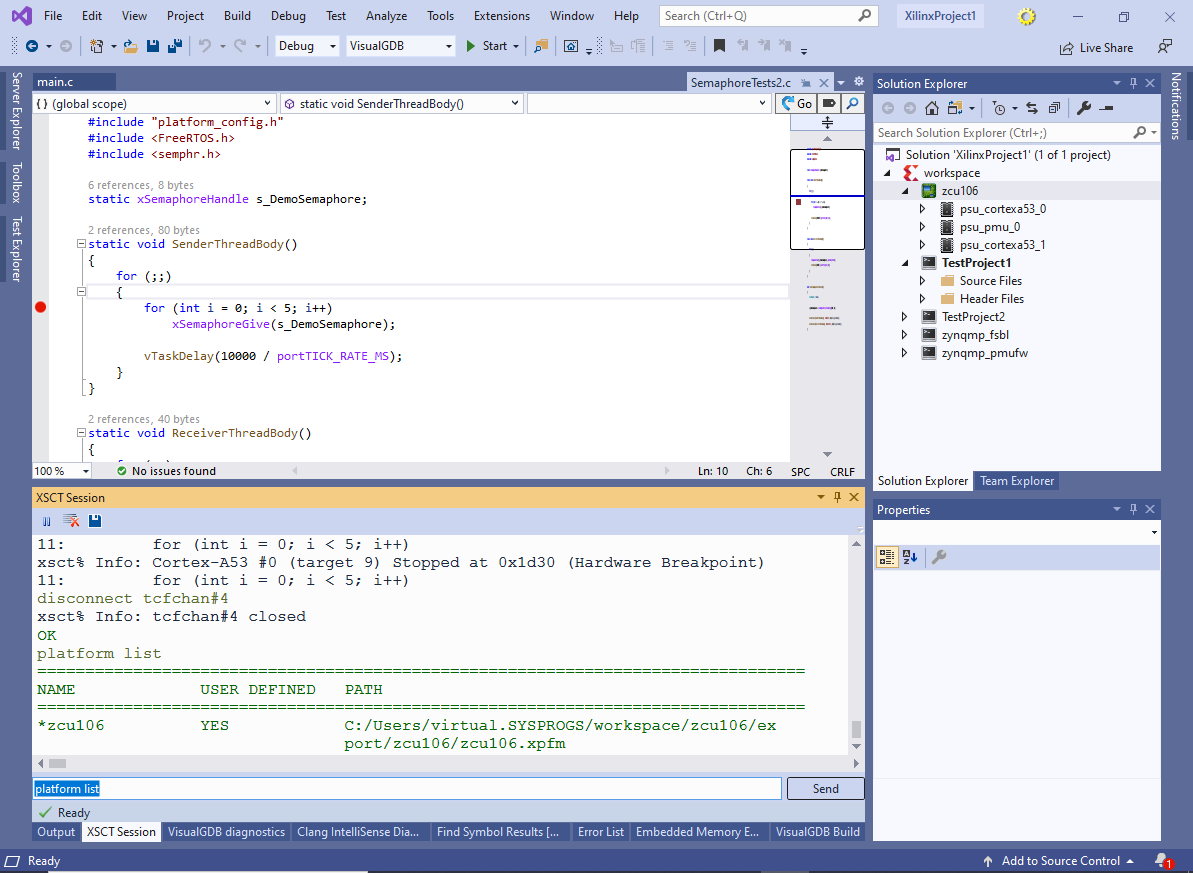
- You can also use the Debug->Windows->XSCT Session window to run XSCT commands directly:
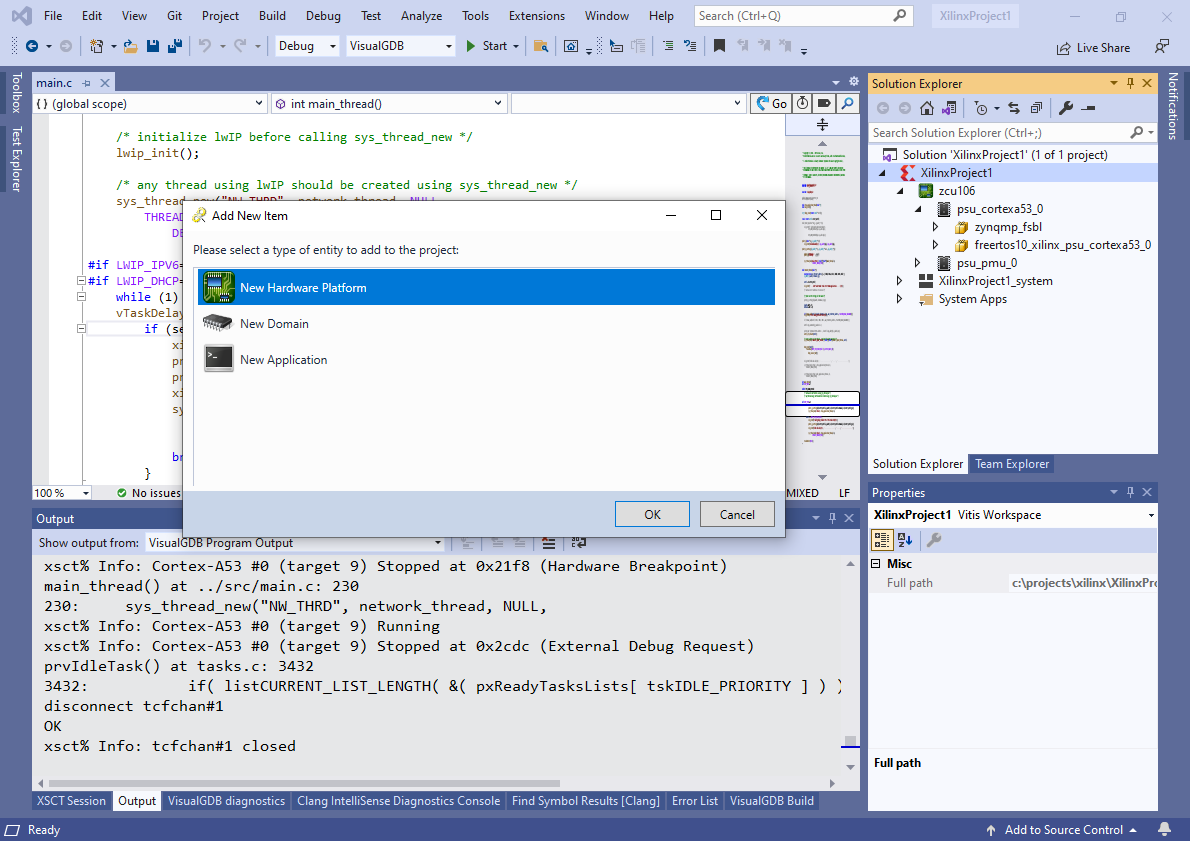
- Use the Add->New Item command in Solution Explorer to add new platforms, domains or applications to the existing project:
- In order to change VisualGDB-level settings of the project, right-click on the project node in Solution Explorer and select “VisualGDB Project Properties”. Then you can use the Project Settings and Build Settings pages to fine-tune various aspects of project loading and building. E.g. VisualGDB can automatically patch the BSP Makefiles generated by the Vitis back-end to avoid unnecessary rebuilds:
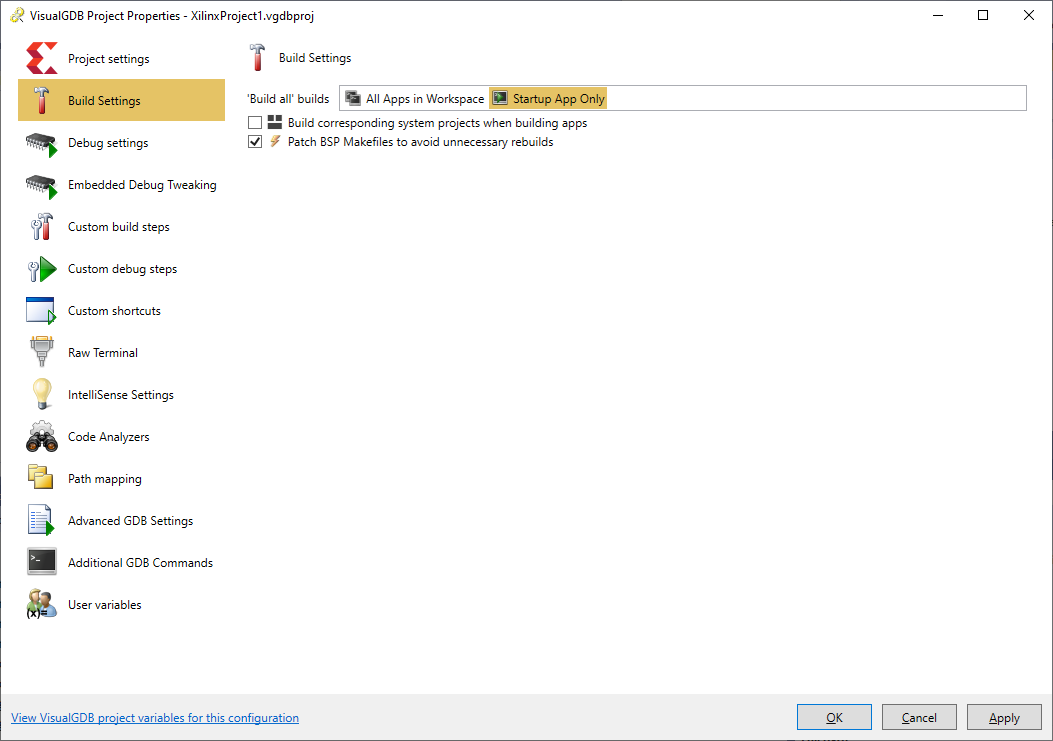 If this option is enabled, VisualGDB will make a snapshot of all source and header files inside the BSP, and will automatically skip the rebuild if none of these files have changed.