Analyzing Code Coverage for Embedded Projects
This tutorial shows how to use VisualGDB to analyze the code coverage of embedded projects. We will create a basic test project based on the TinyEmbeddedTest framework, will instrument it to produce code coverage reports at the end of the debug sessions and will show how to view the reports and reduce the memory overhead by controlling which files get instrumented.
Before you begin, install VisualGDB 5.5 or later.
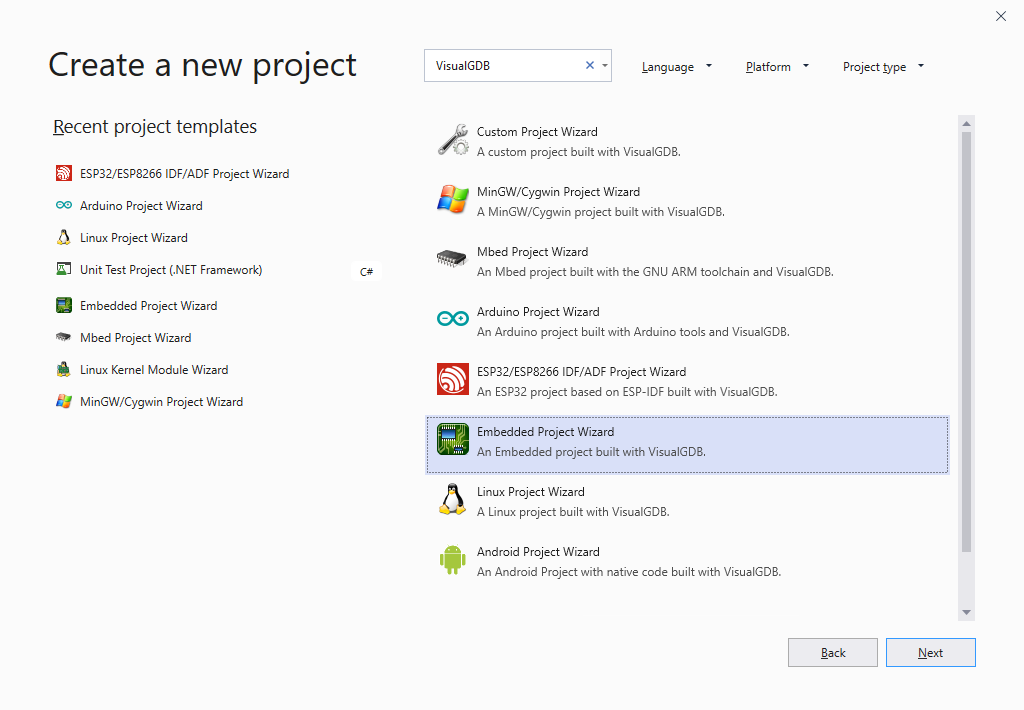
- Start Visual Studio and open the VisualGDB Embedded Project Wizard:
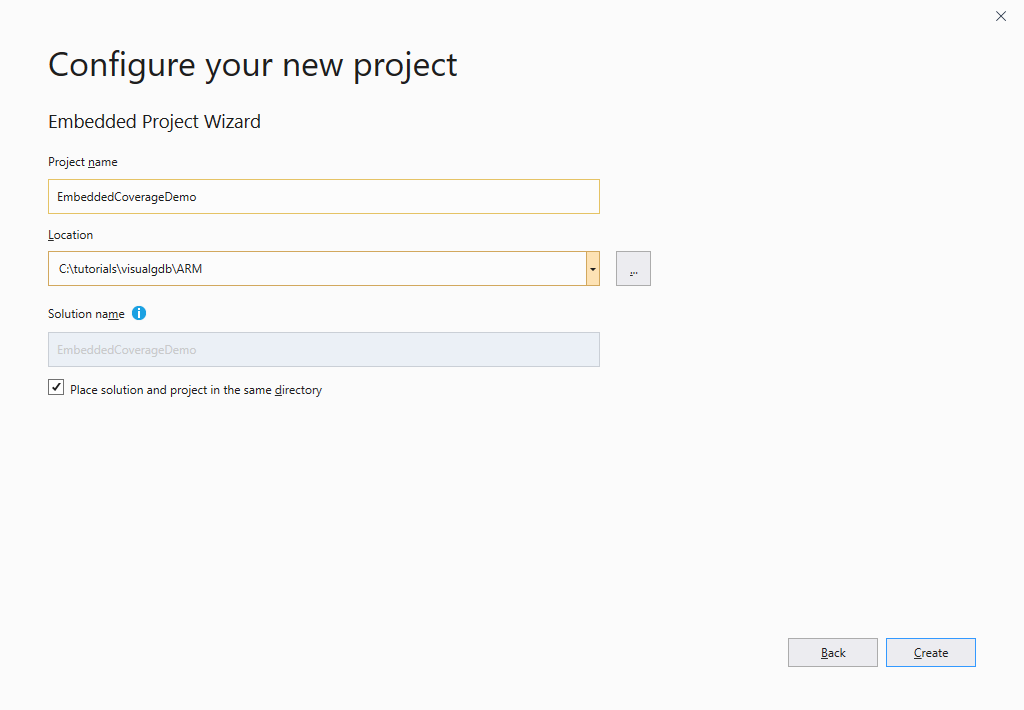
- Specify the name and location for the project you are creating:
- On the first page of the VisualGDB’s part of the wizard, select “Create a new project -> Unit test -> MSBuild -> TinyEmbeddedTest”:

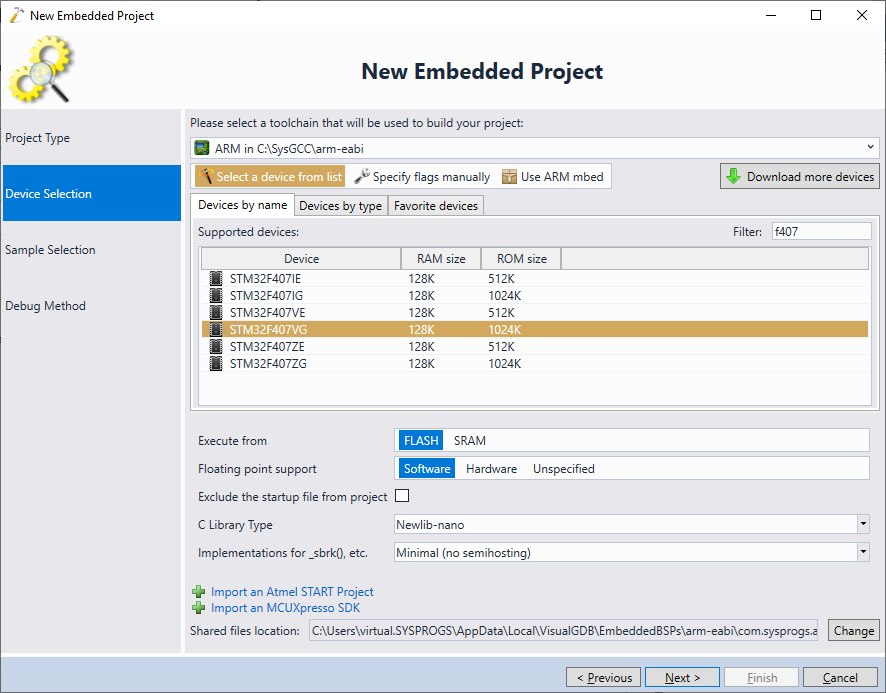
- On the next page select the toolchain and your device. For most accurate code coverage results we advise using GCC 9.x or later:
- Proceed with the default test project sample and click “Next” to continue to the next page:

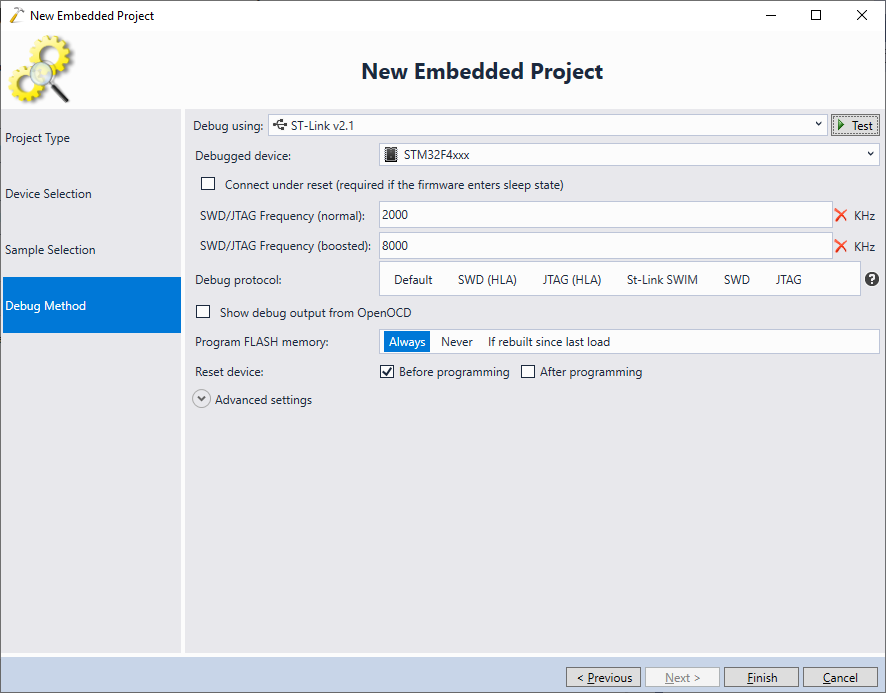
- Connect your JTAG debugger to the USB and make sure VisualGDB detects it. If not, you can pick a debug method manually on the Debug Method page of the wizard:
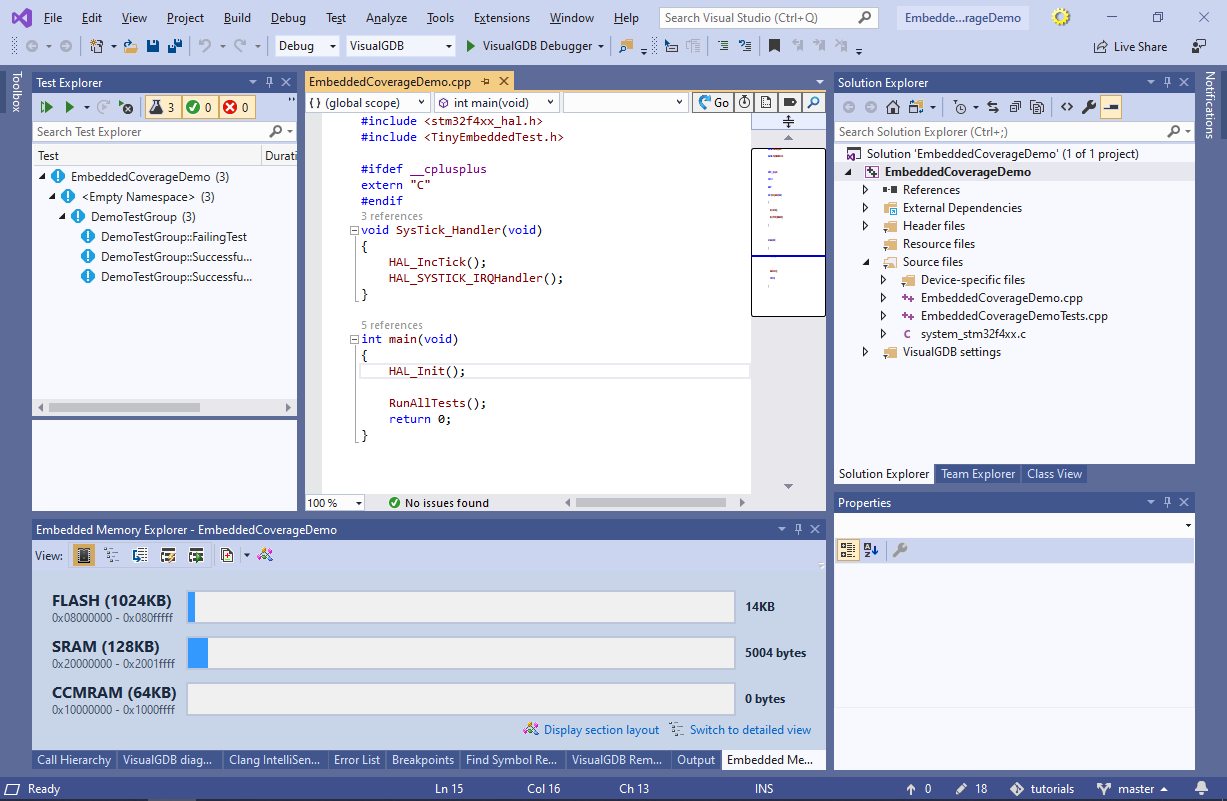
- Press “OK” to generate a basic project. Build it by pressing Ctrl-Shift-B and take a note of the FLASH/RAM use via the Embedded Memory Explorer window:
- Open VisualGDB Project Properties and go to the Code Coverage page. Enable the “build code coverage reports” checkbox and click “OK”. Click “Yes” when VisualGDB asks whether you want to enable code instrumentation in the build settings:
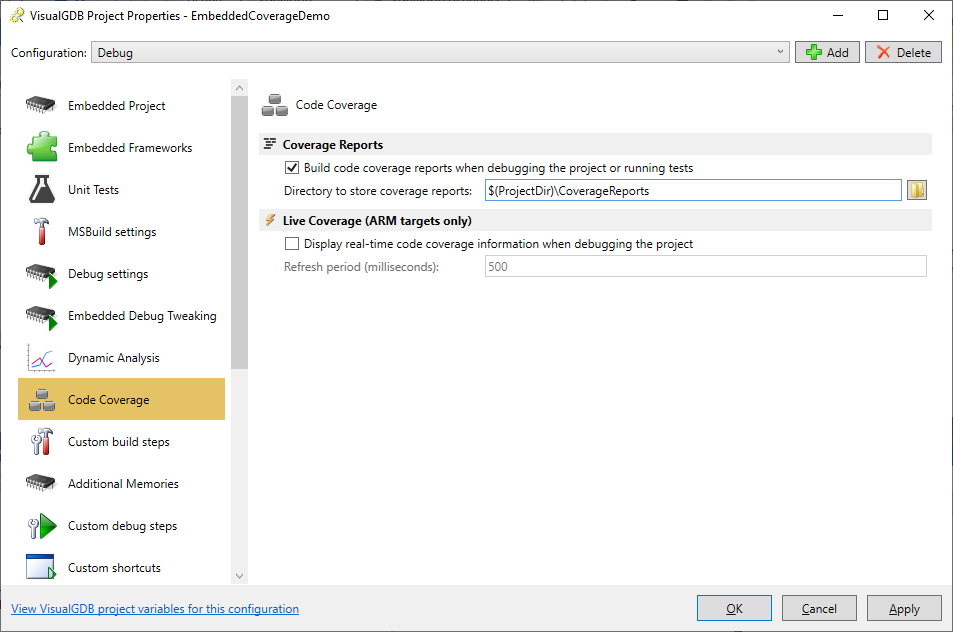
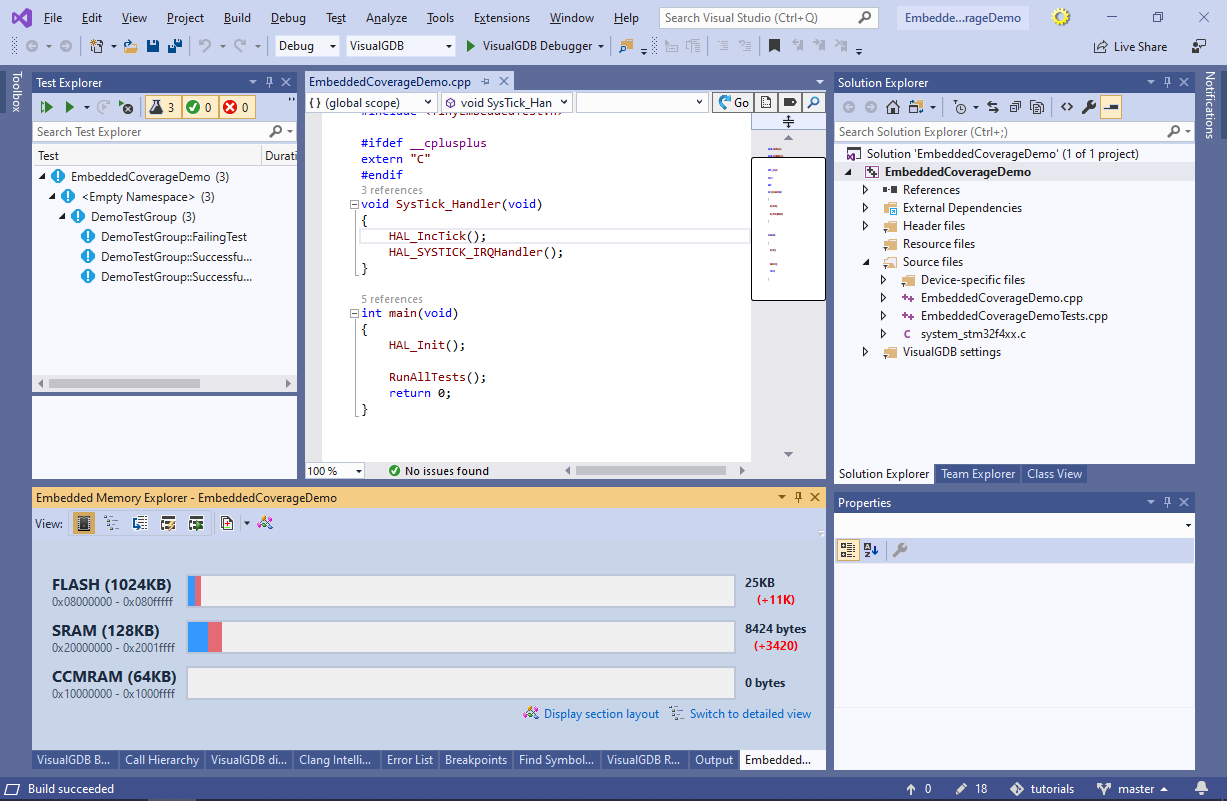
- Build the project again. Note that the instrumented code will use more FLASH (due to extra instructions needed to track the executed functions and branches) and more RAM (due to the variables storing the function/branch counts):
 We will show how to reduce the overhead caused by the code coverage instrumentation later in this tutorial. Note that if instrumenting all code results in more than 100% overhead, the VisualGDB’s logic for trimming unnecessary coverage-related structures from the object files is likely not running. Double-check that the build output contains the following line:
Detached X coverage information blocks from Y object files
If not. make sure you have enabled code coverage on the project level, not just in the C/C++->Instrumentation. We will show the exact setting responsible for this later in the tutorial.
- Open the Test Explorer window, right-click on the test project and select “Run Selected Tests”:

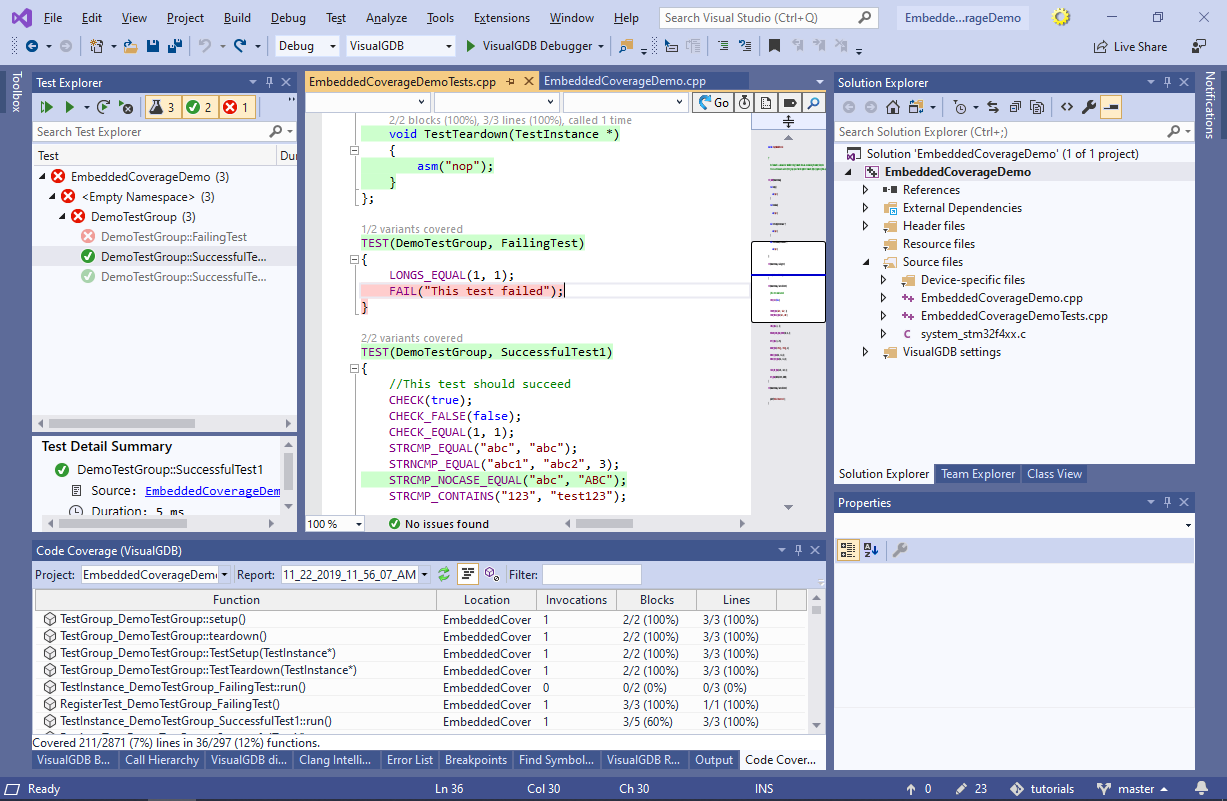
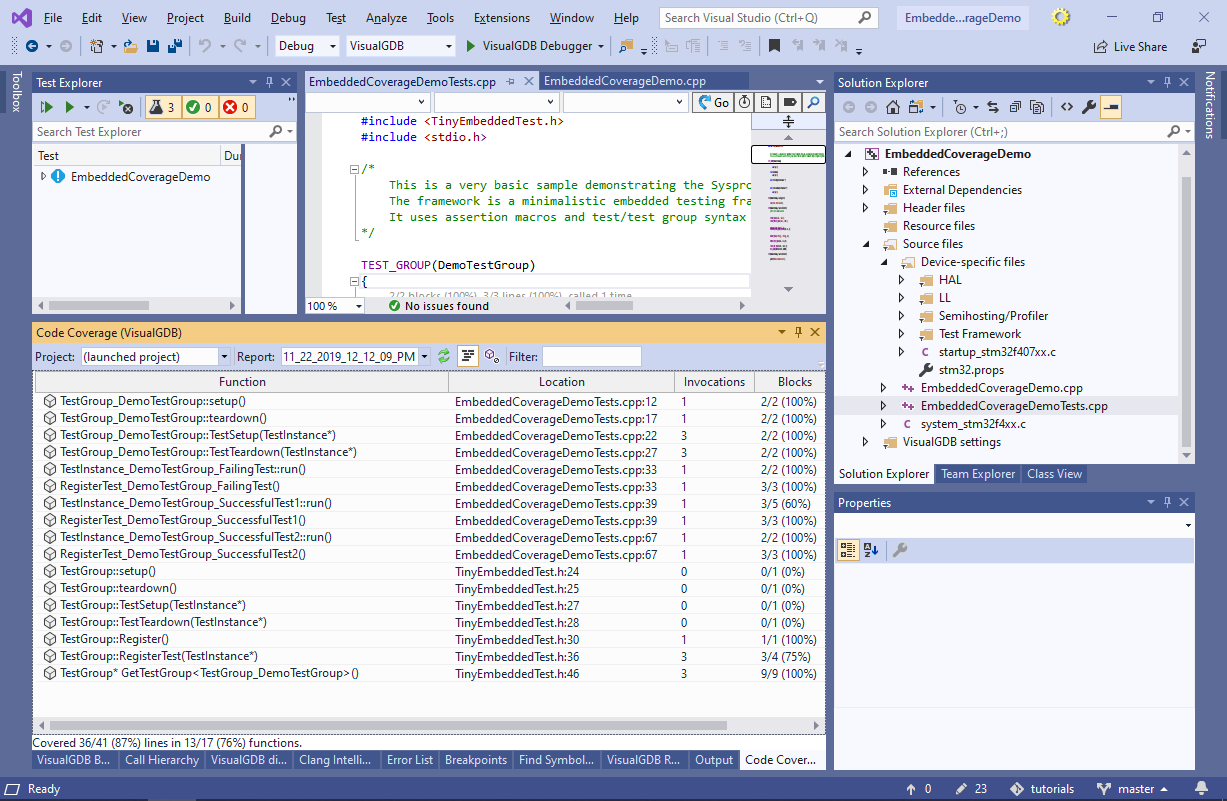
- When the tests finish running, open the Test->VisualGDB Code Coverage Reports window to display the code coverage from the latest run:
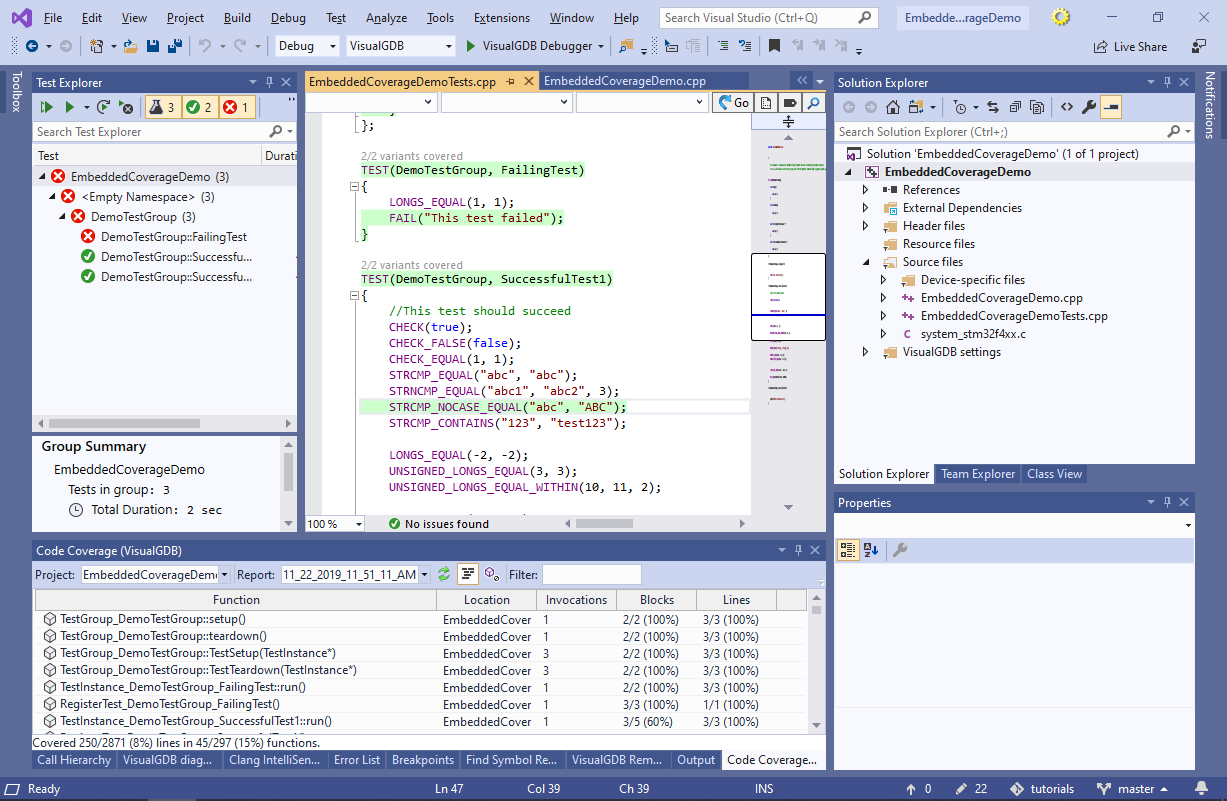 The Code Coverage window will show statistics on the coverage of various functions in the project. As long as the coverage highlighting is enabled and you are using the Clang IntelliSense engine, the lines that were executed will be highlighted green and the lines that were never executed will be highlighted red. Note that the lines that could be resolved during compile time (e.g. CHECK_EQUAL(1,1)) will be excluded from the coverage report by gcc in order to reduce the memory overhead.
 - Now try running only a single test:

- Note how the body of the other tests is now highlighted in red (the test declaration will be highlighted in green because it contains a static constructor):
- Now we will show how to reduce the memory overhead caused by the code coverage. Open Visual Studio Project Properties for the project itself and go to the Embedded Project page. Make sure that the Instrument Code for Code Coverage setting is turned on:
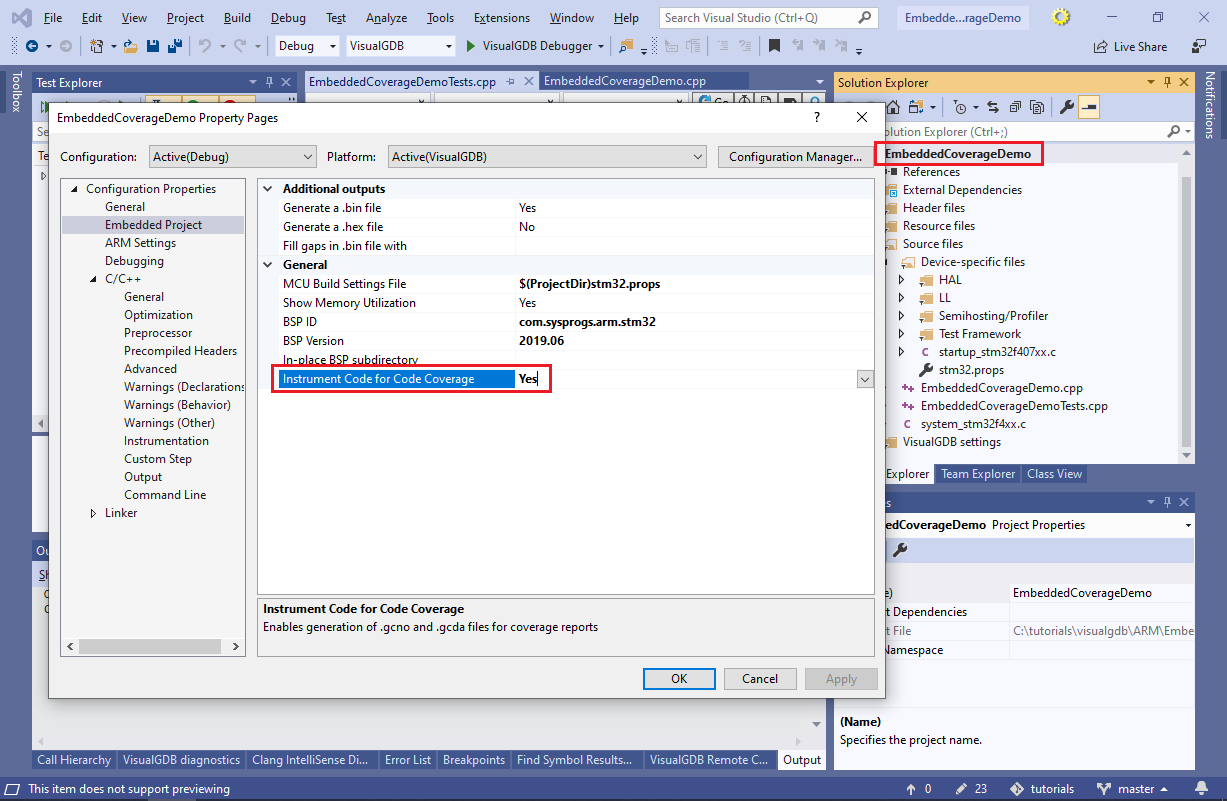 Enabling this setting turns on coverage information optimization by VisualGDB. Unless it is enabled, GCC will try to insert the function layout information for every function defined in the project (even the unused ones) into the final binary, quickly consuming most of the available RAM.
 - Go to the C/C++->Instrumentation page of Visual Studio Project Properties and turn off the Generate Code Coverage Reports setting there. This will disable the instrumentation of all source files unless we override it for specific files:
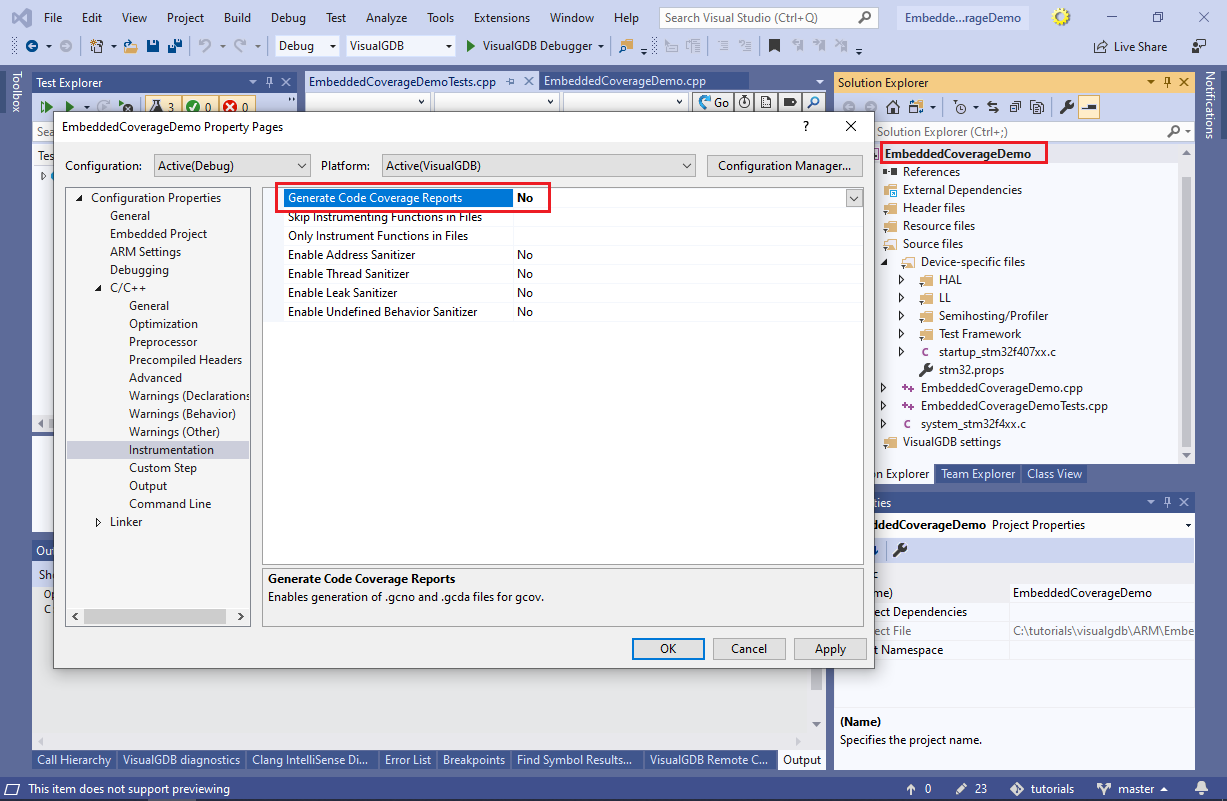 Note that the project-level setting configured in the previous step needs to be turned on.
 - Now select specific file(s) you want to instrument and enable the “Generate Code Coverage Reports” option for them:
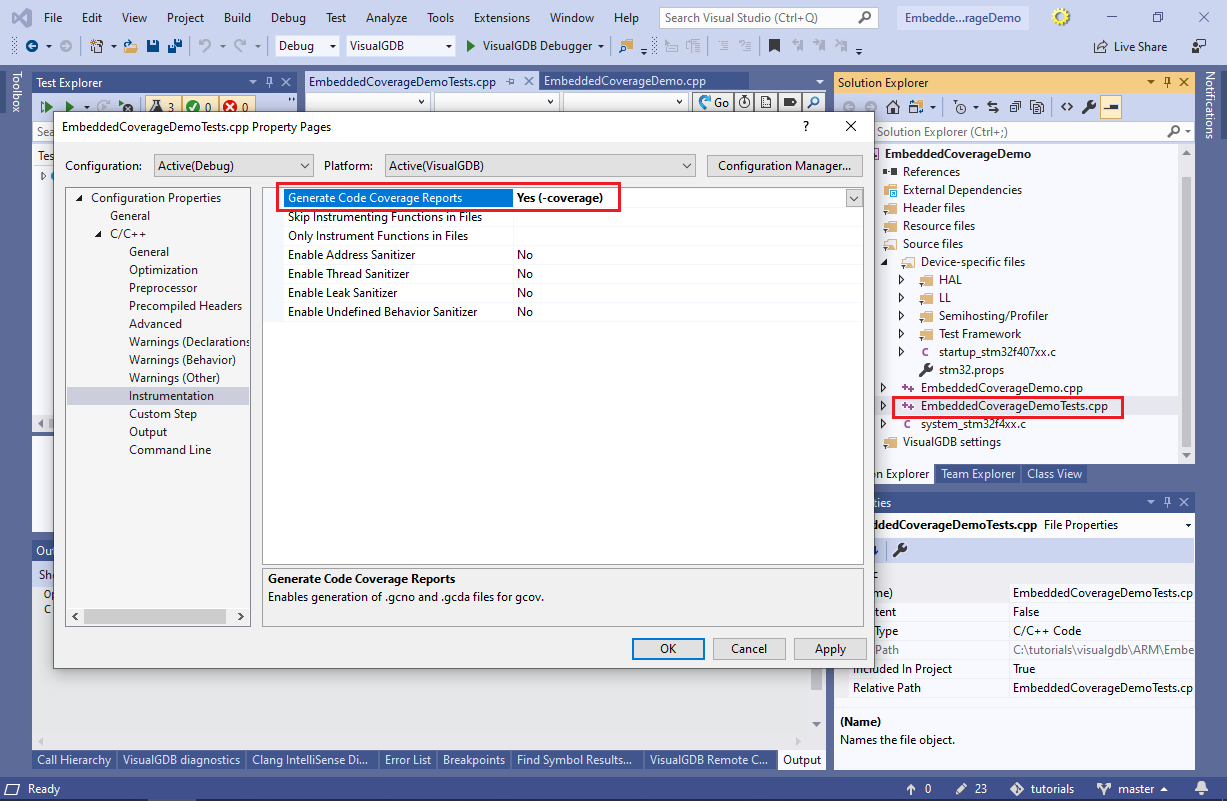
- Build the project and run the tests. Note that the coverage report will only include the functions in the instrumented files and the overall memory overhead will be much lower:
- Another way of limiting the files that get instrumented is using the “Only instrument Functions in Files” and “Skip Instrumenting Functions in Files” settings on the “C/C++->Instrumentation” page of VS Project Properties. E.g. you can re-enable the instrumentation for all source files and then limit it to files ending with “Tests.cpp” as shown below:
 Note that setting the “Generate Code Coverage Reports” setting for individual files affects the entire translation unit (i.e. it will instrument the selected .cpp file and any inline functions in any header file that were called from that .cpp file). The “Only Instrument Functions in Files” setting filters the functions based on the exact file where they were defined. E.g. setting it to .*Tests\.cpp (note the regex syntax) will instrument all functions defined in EmbeddedCoverageDemoTests.cpp, but not the inline functions in headers that were called from that .cpp file. Similarly, you can use the “Skip Instrumenting Functions in Files” option to exclude specific headers (e.g. defining syscalls) from instrumentation.
 - VisualGDB builds its coverage reports from the raw reports generated by gcov. If you would like to feed the gcov files into another tool, enable Tools->Options->VisualGDB->General->Keep Raw Coverage Reports:
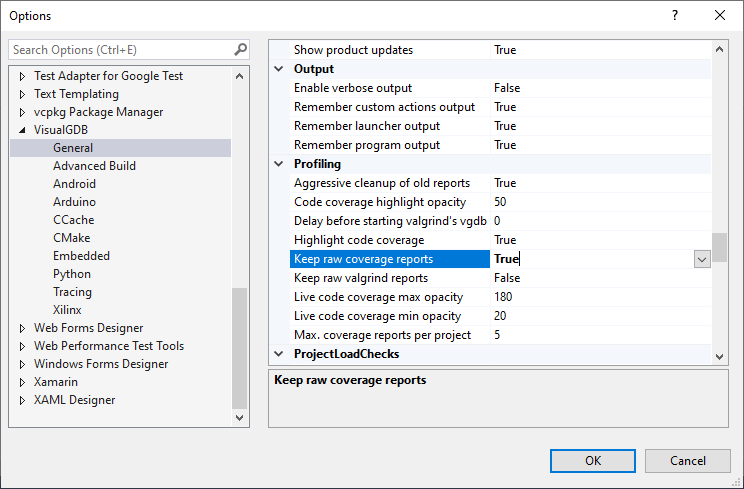
- You will find the raw report files next to the .o files inside the build directory:
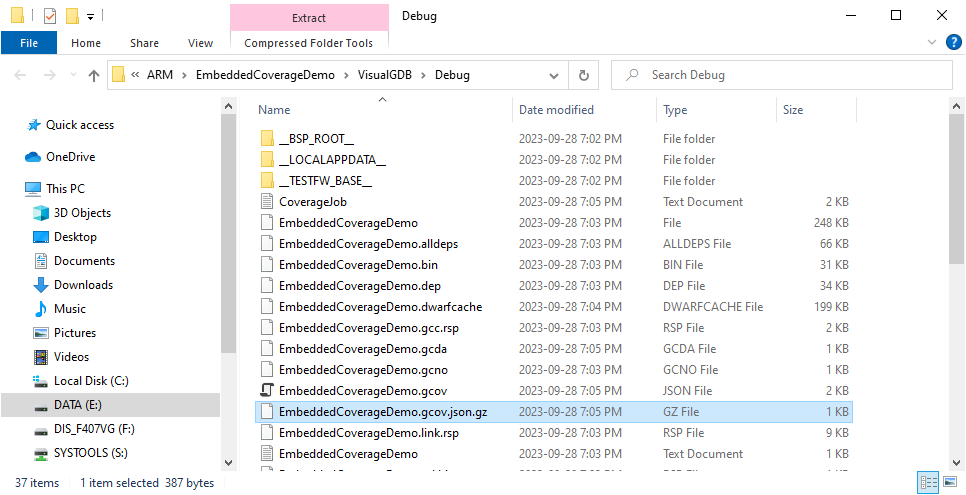
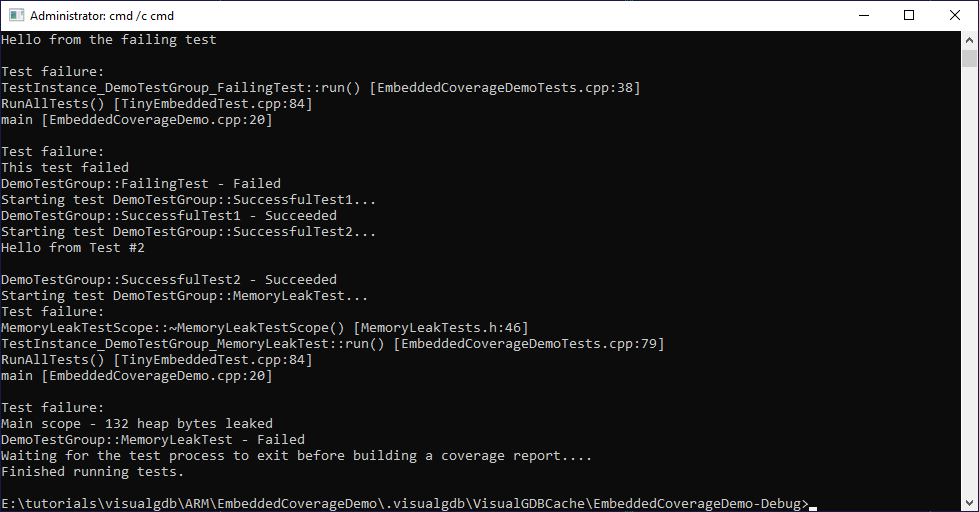
- You can also run the tests and generate reports from command line by locating the test container file (.vgdbtestcontainer) and running VisualGDB.exe /runtests <container file>. As long as the project is configured to produce coverage reports, running it via command line will produce them as well (including the raw files):
You can read more about VisualGDB coverage reports, and programmatic ways of reading them on this page.