Using Olimex ARM-JTAG-SWD to Debug Devices via SWD
This tutorial shows how to use the Olimex ARM-JTAG-SWD adapter with VisualGDB and OpenOCD to debug the devices that do not support the JTAG transport.
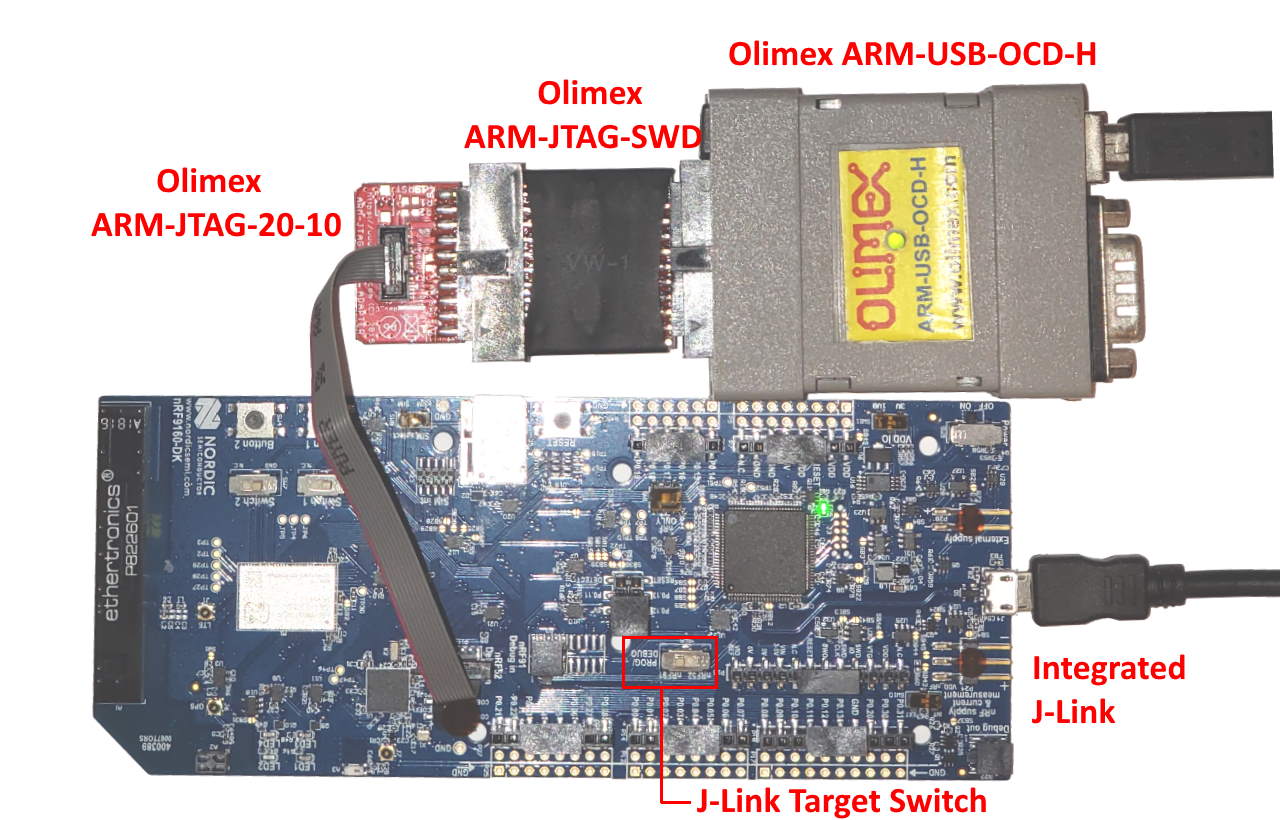
We will use the nRF9160-DK board that includes 2 ARM microcontrollers (nRF52840 and nRF9160) and includes an integrated J-Link probe that can be used to debug one chip at a time. In this tutorial we will show how to debug the second chip using an external Olimex ARM-USB-OCD probe with the ARM-JTAG-SWD adapter, while the on-board J-Link is used to debug the primary nRF9160 chip.
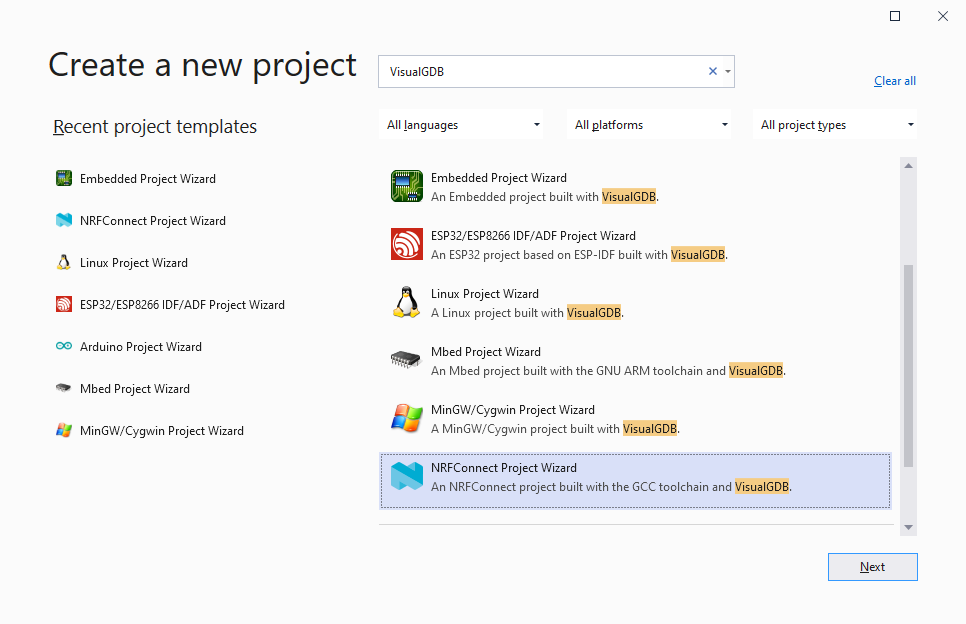
- Start Visual Studio and open VisualGDB Embedded Project Wizard (most regular devices) or NRFConnect Project Wizard (Nordic nRF5x devices):
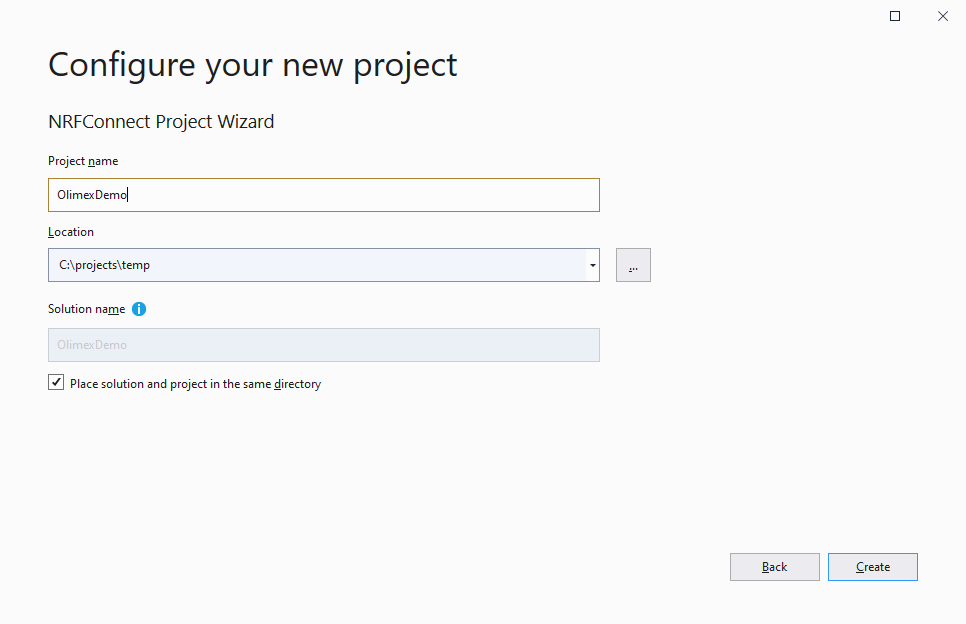
- Pick a name and location for the project:
- Proceed with the default project type setting (create a new project):

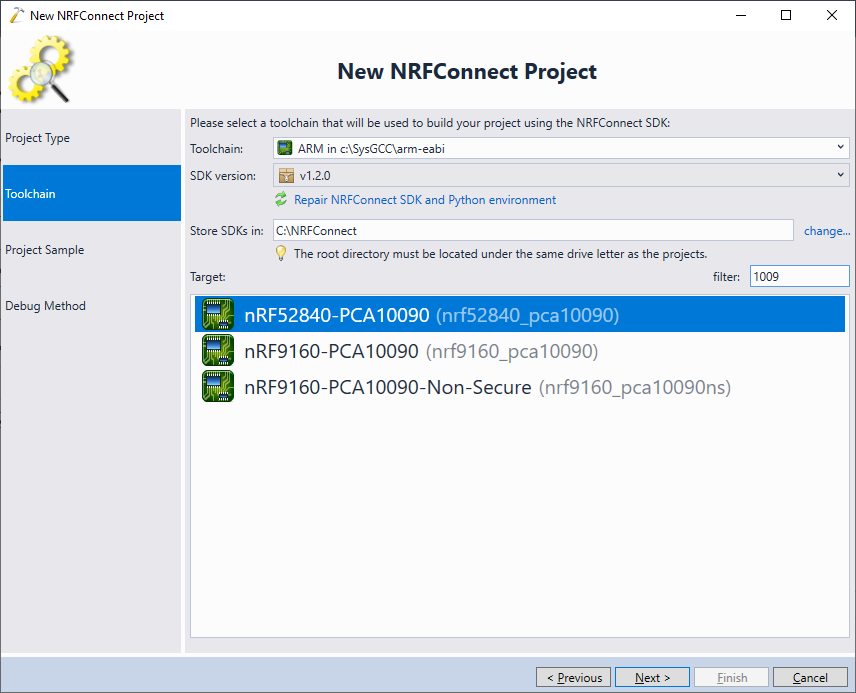
- Select the toolchain and the target. In this tutorial we will use the nRFConnect SDK, however the debug setup shown here will work for the regular Embedded projects as well:
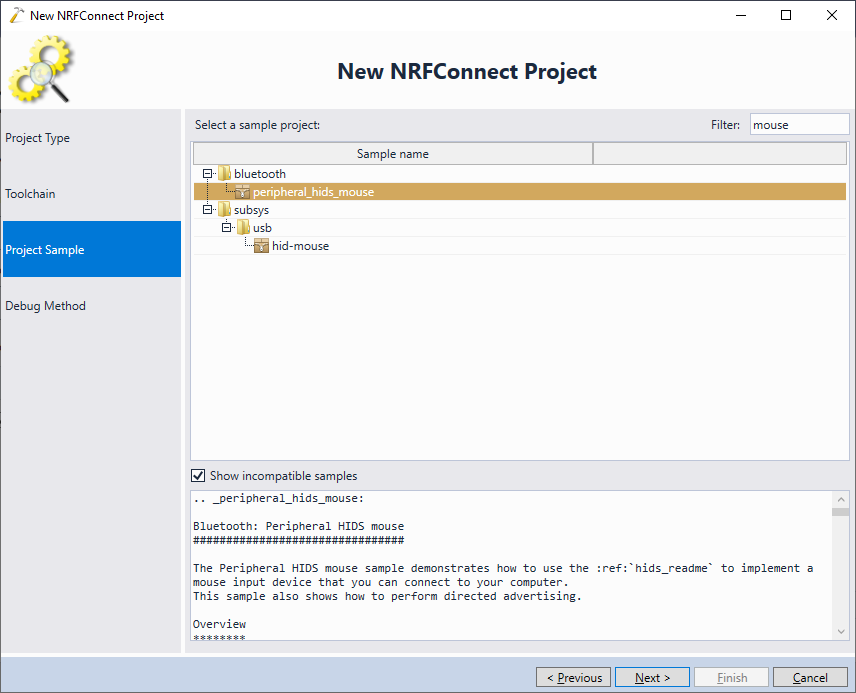
- As of version 1.2.0, the none of the nRFConnect SDK samples are explicitly marked compatible with the nRF52 on the PCA10090 board (nRF91-DK), however many of the regular nRF52 samples might work. Check the “Show incompatible samples” checkbox and pick the peripheral_hids_mouse sample:
 If you are using the regular Embedded Project Wizard instead, simply proceed with the LEDBlink sample.
 - Switch the on-board J-Link target selector to target the nRF91 chip and connect the Olimex ARM-USB-OCD-H debugger to the nRF52 debug port as shown below:
- Go to the Debug Settings page of the wizard and try testing the settings. If you try testing the default settings, you will see the following error:
target/swj-dp.tcl:30: Error: newtap: nrf52.cpu missing IR length
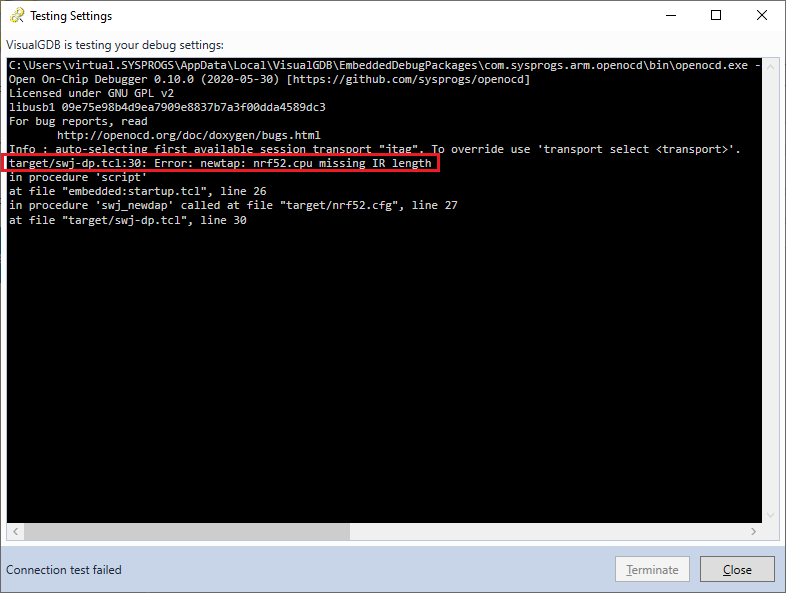
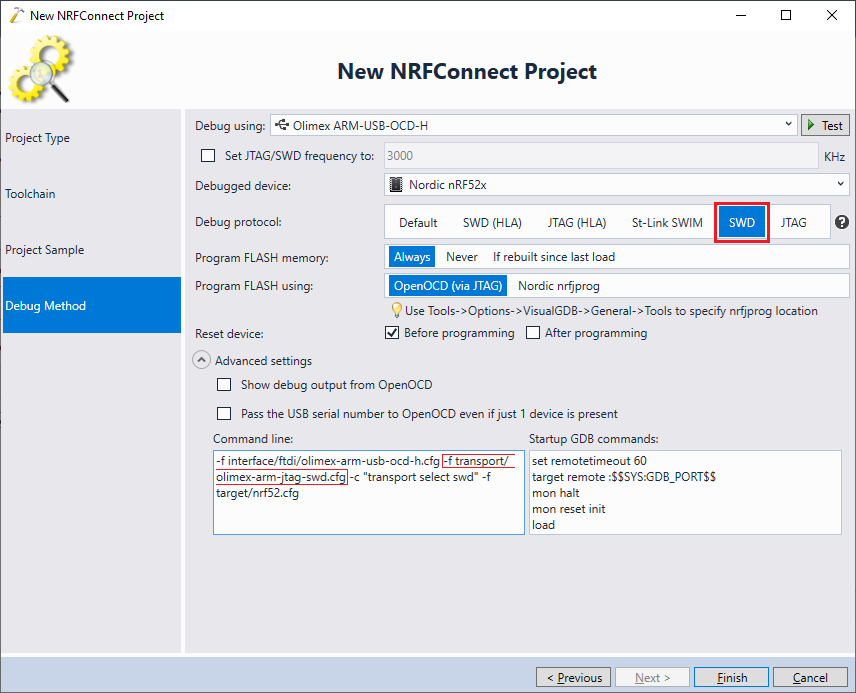
- This happens because the OpenOCD definitions for the nRF52 chip only work with the SWD transport. Select SWD explicitly in the Debug Settings and make sure VisualGDB picks up the transport/olimex-arm-jtag-swd.cfg script:
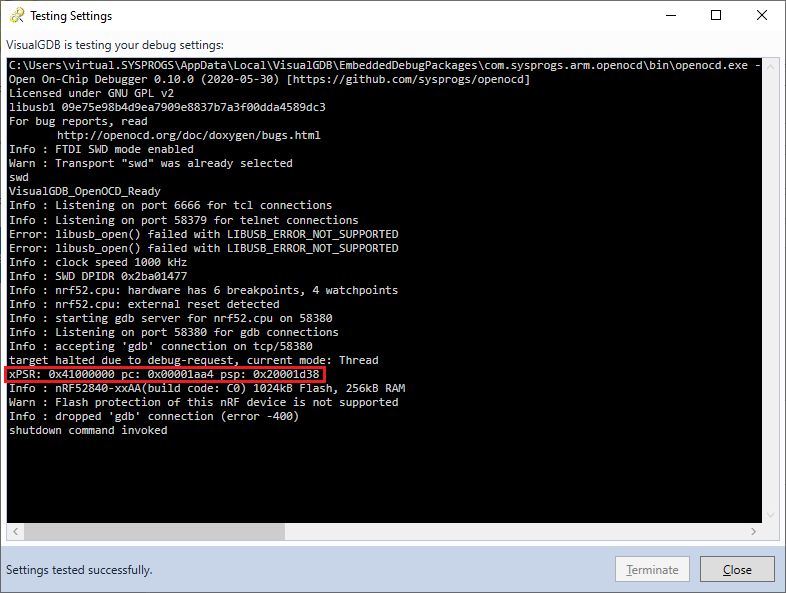
- Now you will be able to debug the chip successfully:
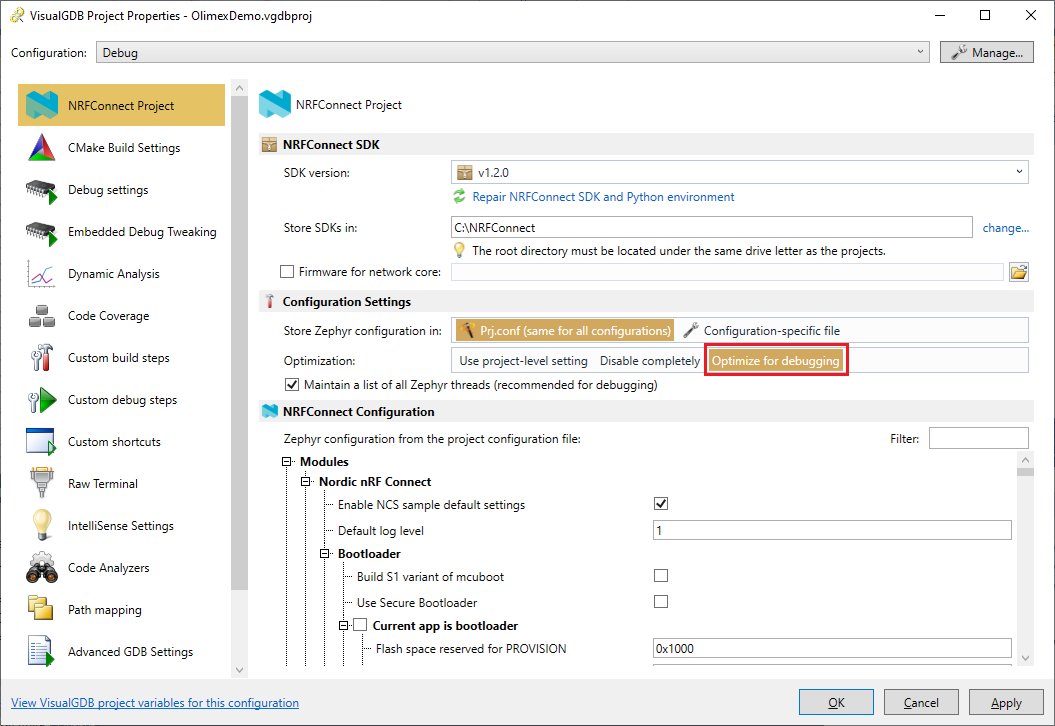
- Click “Finish” to complete creating the project. Then go to VisualGDB Project Properties and make sure the debug optimization level is set to “Optimize for debugging” and not “Disable completely”, as otherwise nRF52 will run out of stack space:
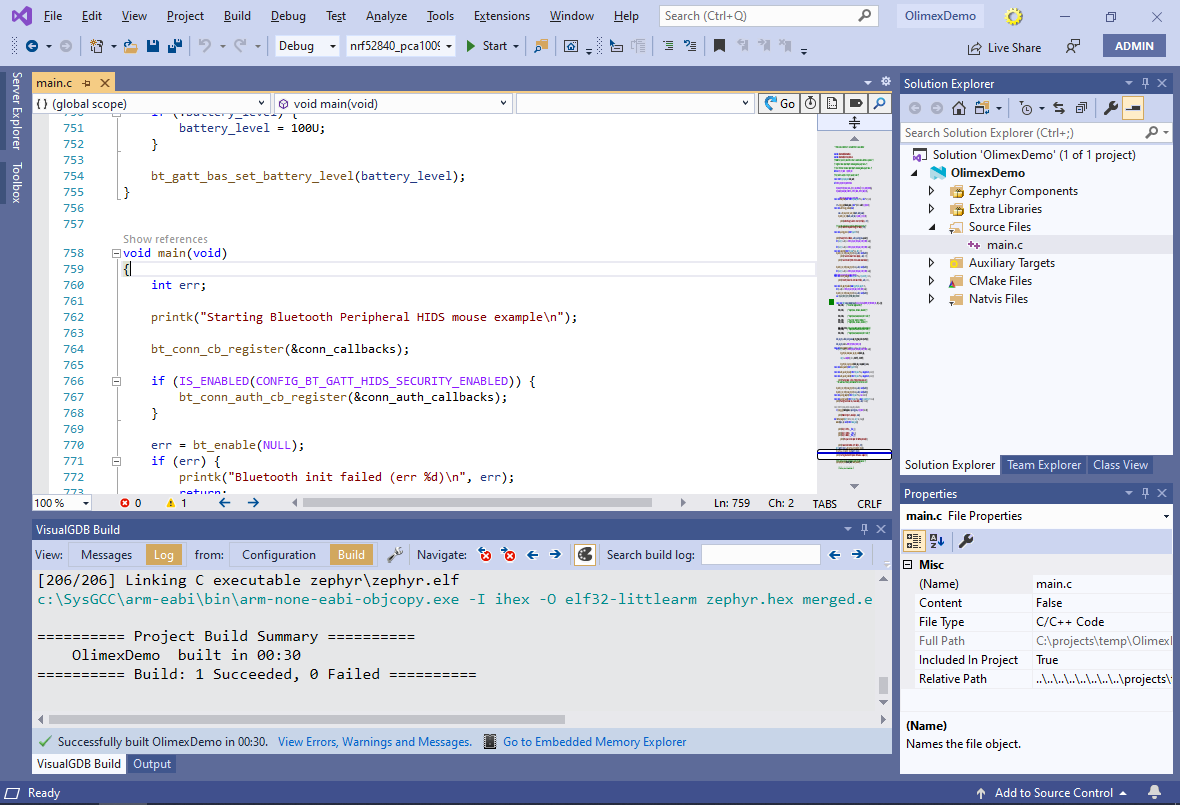
- Press Ctrl-Shift-B to build the project:
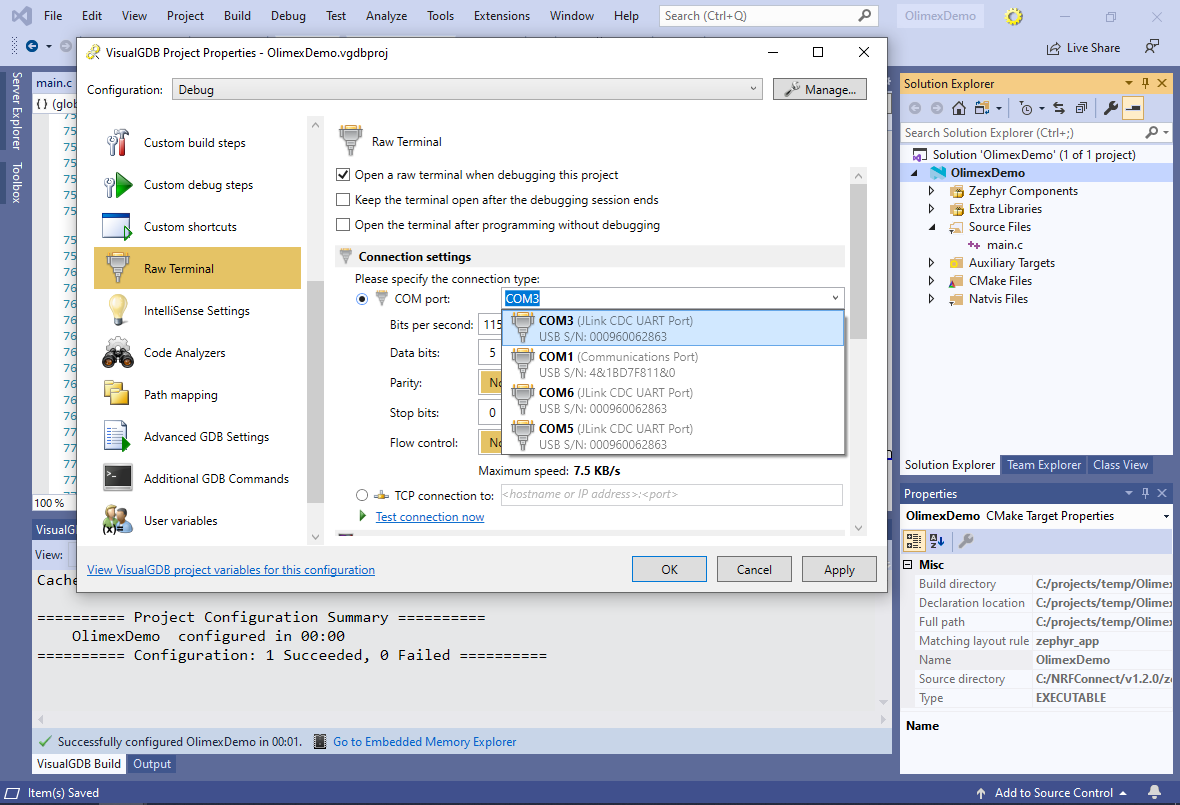
- You can now start another debug session on the nRF91 chip (e.g. by following this tutorial). As the Olimex debug probe is completely separate from the on-board J-Link, our nRF52 debug session will not interfere with nRF91. If you are using the Custom edition, you can configure VisualGDB to connect to one of the COM ports provided by the on-board J-Link (it will also not interfere with the regular J-Link debug session):
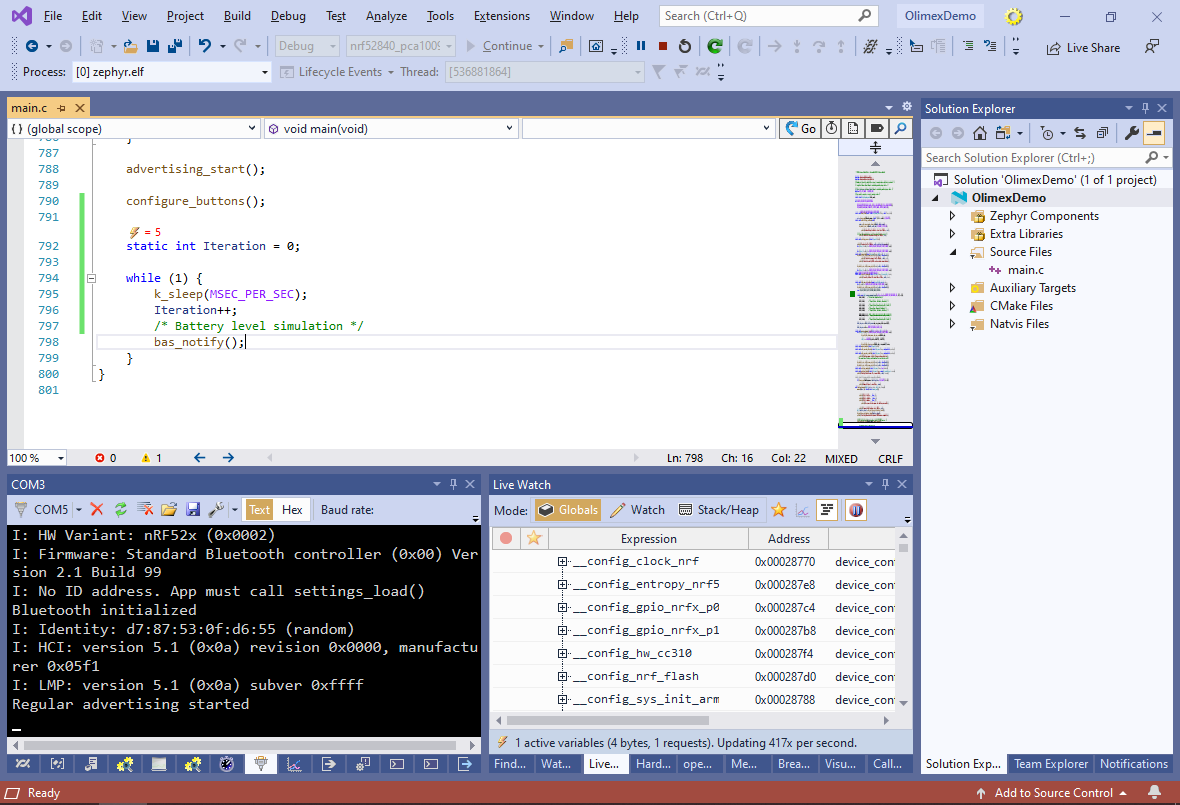
- To avoid stopping the program at breakpoints, we advise adding a counter to the loop inside main() and observing its value via Debug->Windows->Live Watch:
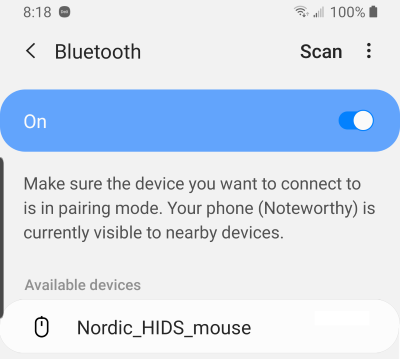
- Try scanning for nearby Bluetooth LE devices with a Bluetooth-capable phone or a laptop. The Nordic_HIDS_Mouse device will appear in the list:
- If you try pairing the mobile device with the example project running on the nRF52 chip, it would normally expect a confirmation by pressing one the on-board buttons, that are typically used by the nRF91 chip:

- You can modify the pairing_process() function in main.c to call num_comp_reply(true) directly instead of asking for the confirmation. Now you will be able to pair your device with the example program and debug it with the Olimex debugger:
