Targeting the RISC-V core on Raspberry Pi Pico 2
This tutorial shows how to build and debug projects for the RISC-V core on the Raspberry Pi 2 (RP2350). We will show how to create a basic project, configure the debugging settings, and will use VisualGDB’s Chronometer to analyze the cycle counts of individual code lines, so you can compare performance between the ARM and RISC-V cores.
Before you begin, install VisualGDB 6.1 or later.
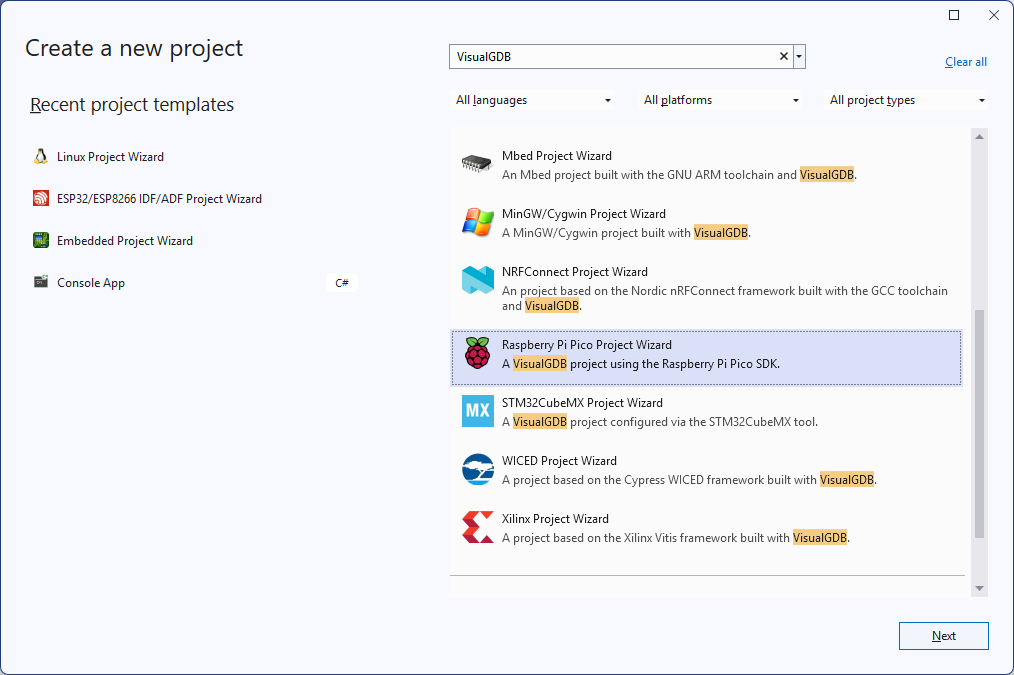
- Start Visual Studio and open the VisualGDB’s Raspberry Pi Pico project wizard:
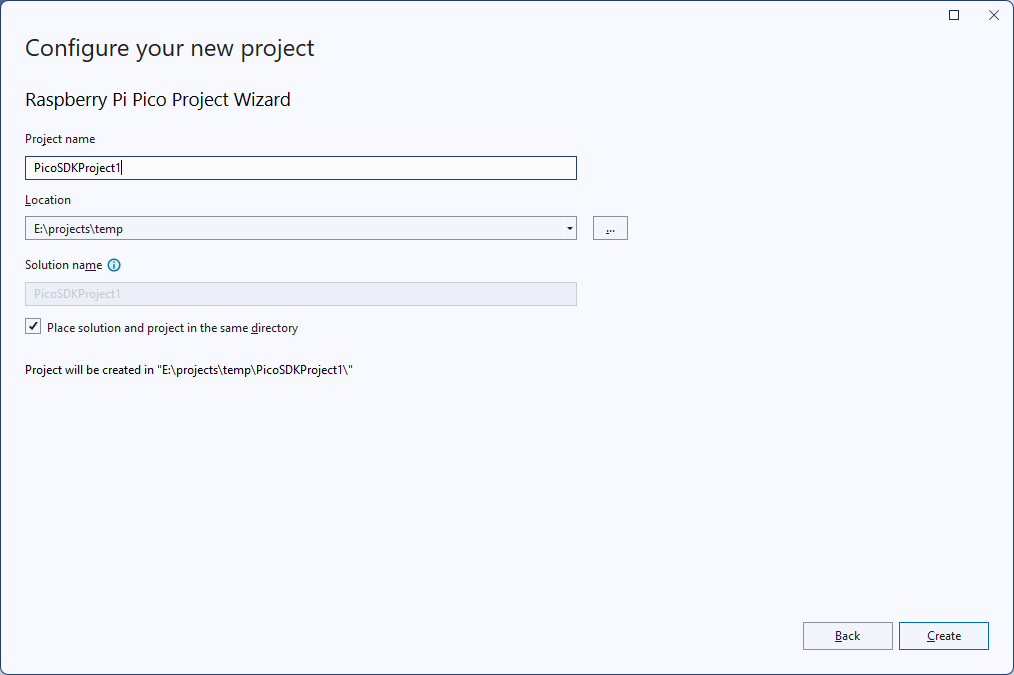
- Enter the name and location for your project:
- Targeting the RISC-V core requires using the toolchain shipped by the Raspberry Pi developers, so make sure you select that option in the toolchain selector:
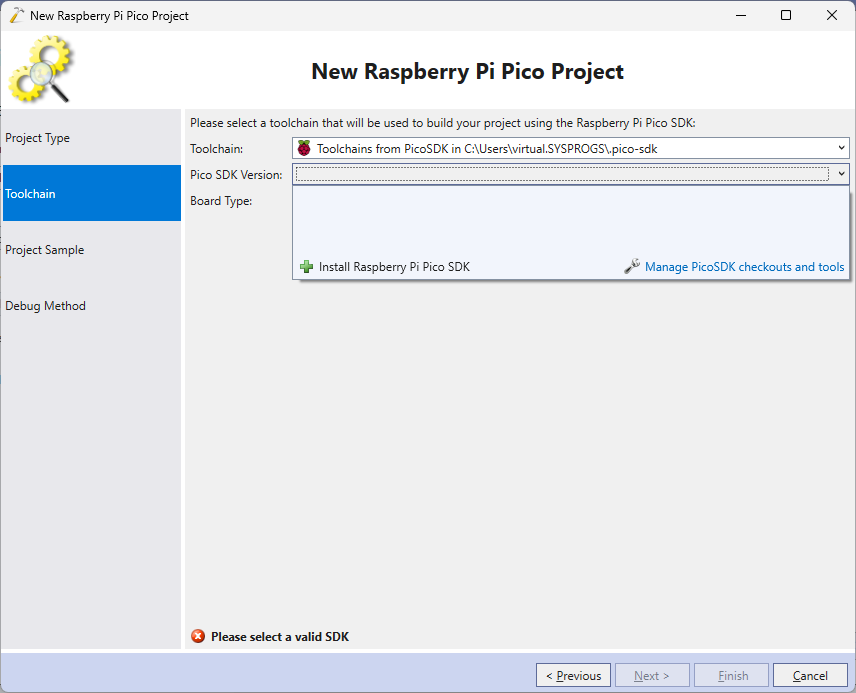 If you are using the PicoSDK Code extension, VisualGDB will automatically pick up the tools/SDKs installed by it. If not, click the “Install Raspberry Pi Pico SDK” link to view the versions available for download.
 - Select the SDK version you would like to download. The package icon means that the Raspberry Pi foundation has published pre-built tools (e.g. picotool) for that version:
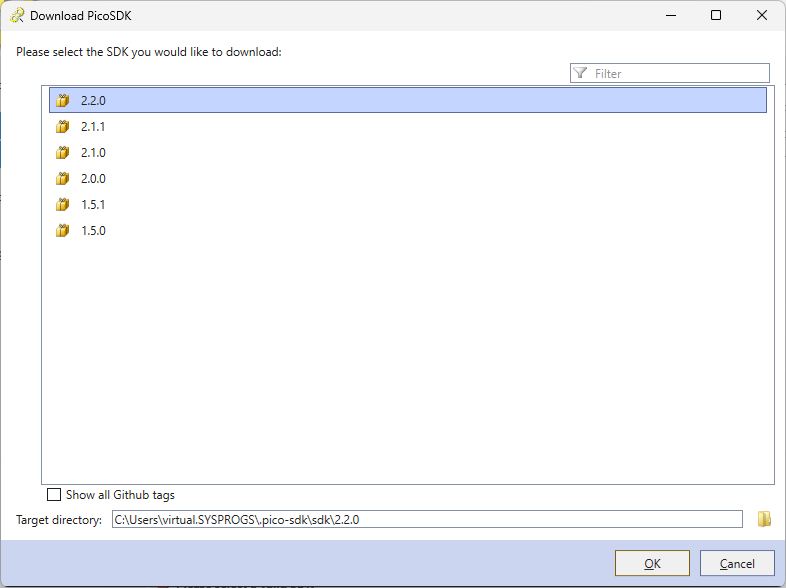 You can also clone an arbitrary Github tag and use it as an SDK, but you would need to setup tools like the toolchain/picotool manually.
 - Press “OK”. VisualGDB will automatically load the list of the dependencies from the PicoSDK VS Code extension, and will download the necessary tools:
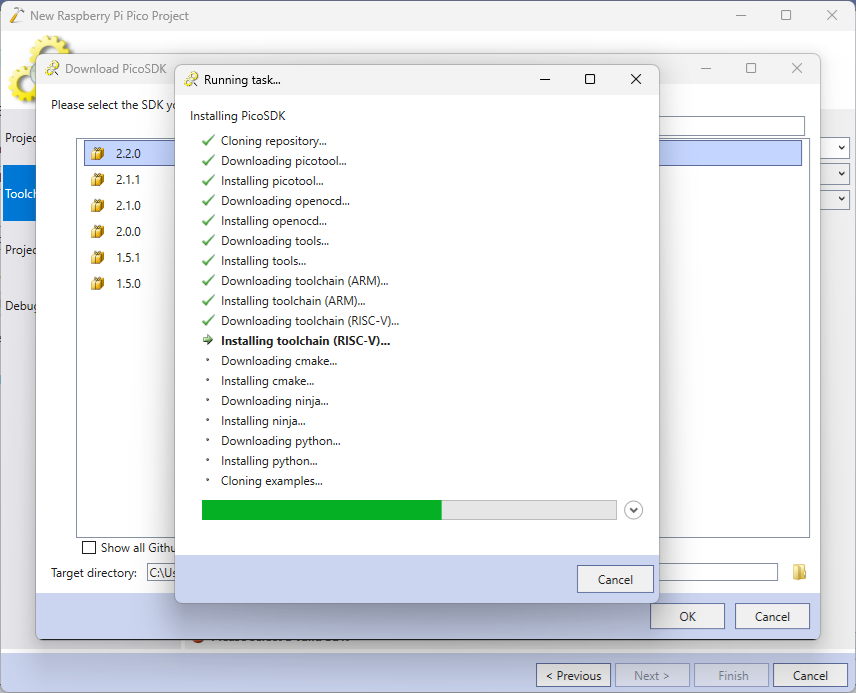 If you have previously downloaded them using VS Code, VisualGDB will simply reuse the existing tools.
 - Select the latest SDK in the SDK selector, pick the board that is based on the Pico 2 chip (RP2350) and make sure the RISC-V core is selected:

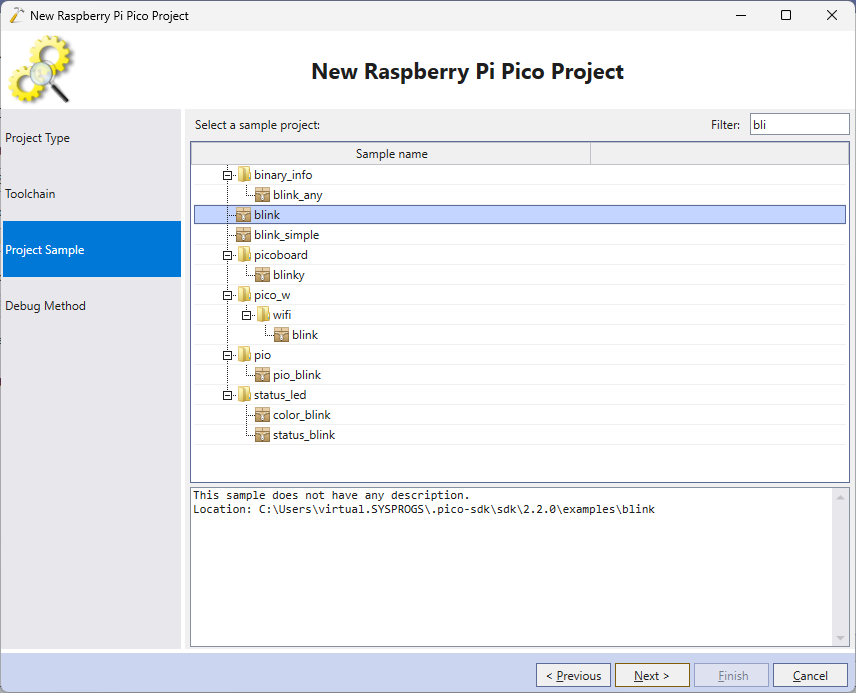
- Pick a sample you would like to clone. In this tutorial we will clone the simplest “Blinking LED” sample:
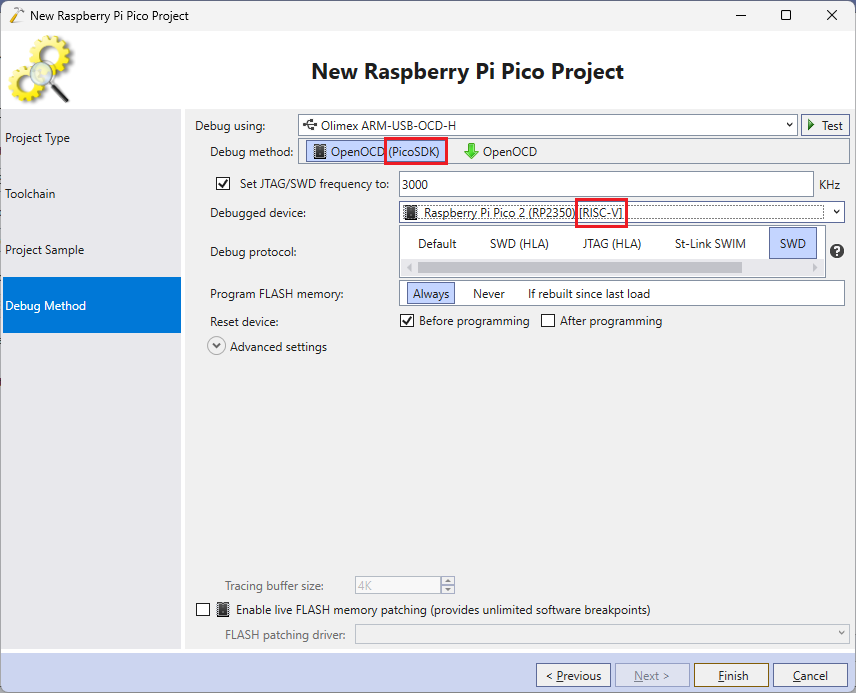
- Finally, select the debug method. The RISC-V core can only be debugged using the Raspberry Pi’s own fork of OpenOCD, so make sure you have selected OpenOCD (PicoSDK) and the Debugged Device explicitly mentions RISC-V:
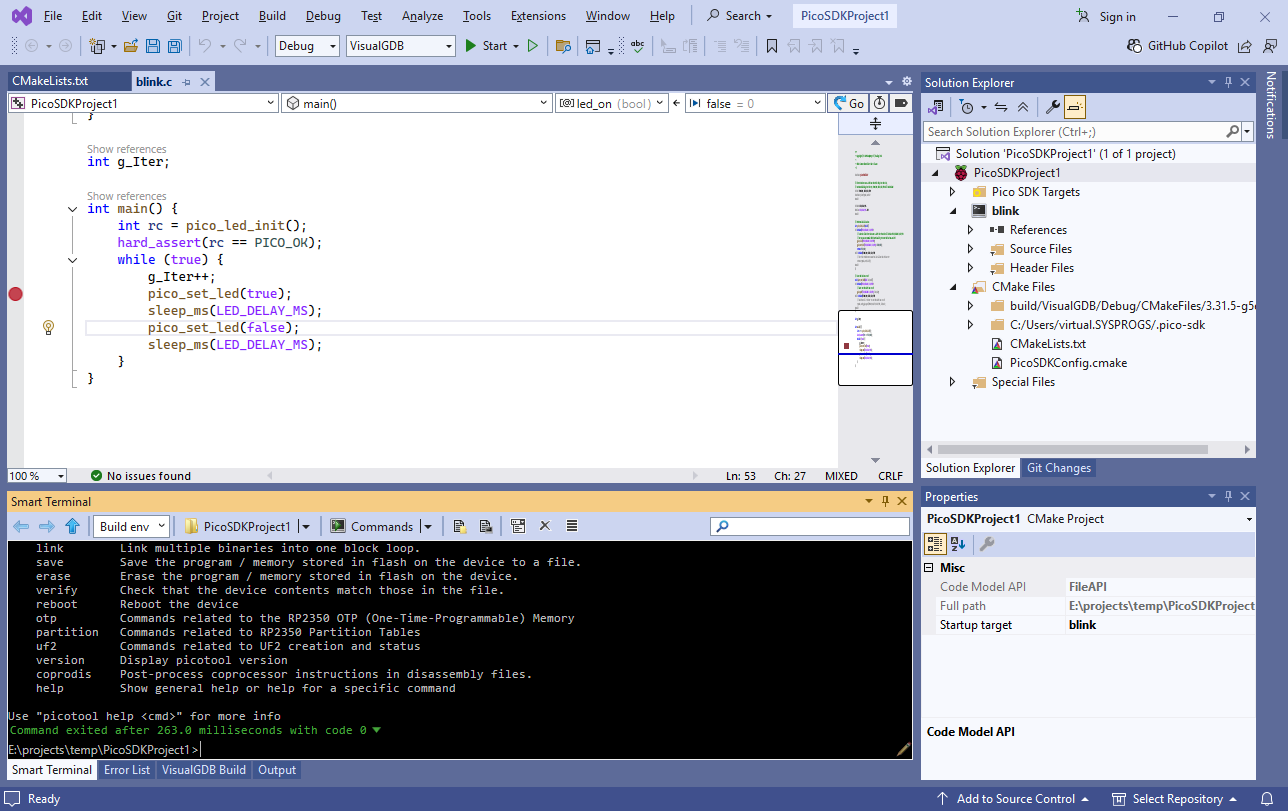
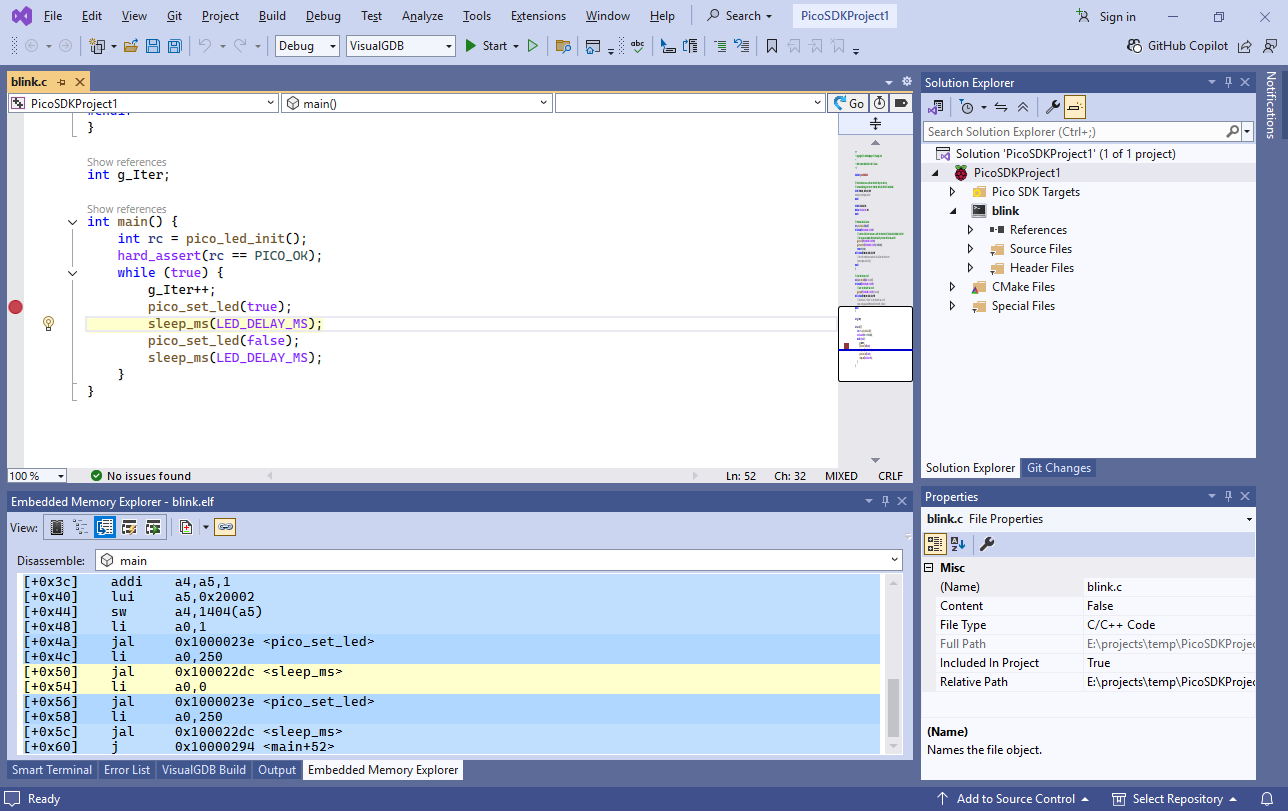
- Press”Finish”to generate the project. You can use the Disassembly view in the Embedded Memory Explorer to verify that the code is using RISC-V instructions:
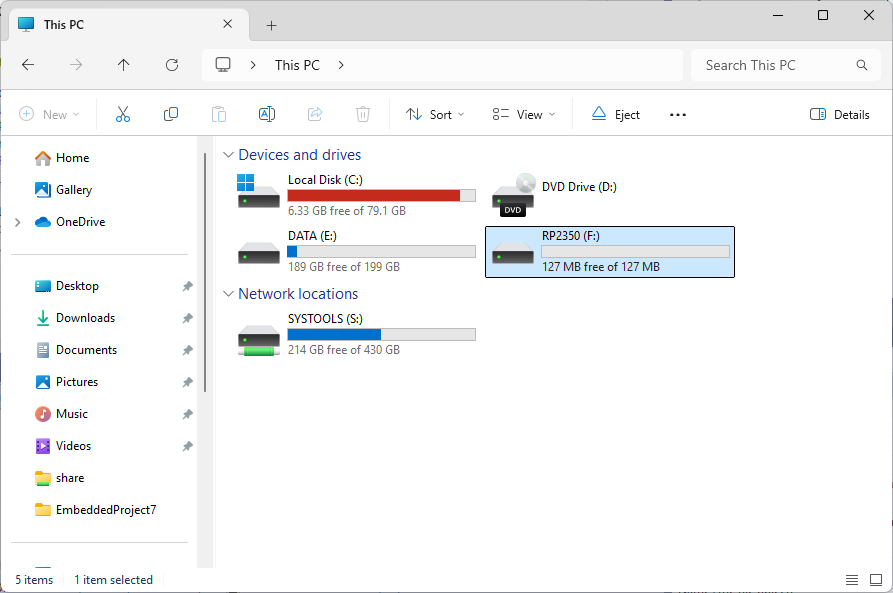
- WARNING! If this is the first time you are running RISC-V firmware on your Raspberry Pi, the RISC-V cores won’t be running, and hence the debugging will fail! To fix this, you would need to first program the RISC-V image into the board using the bootloader. Hold the BOOTSEL button on the board, and re-plug it into the USB port. Make sure it appears as a disk drive:
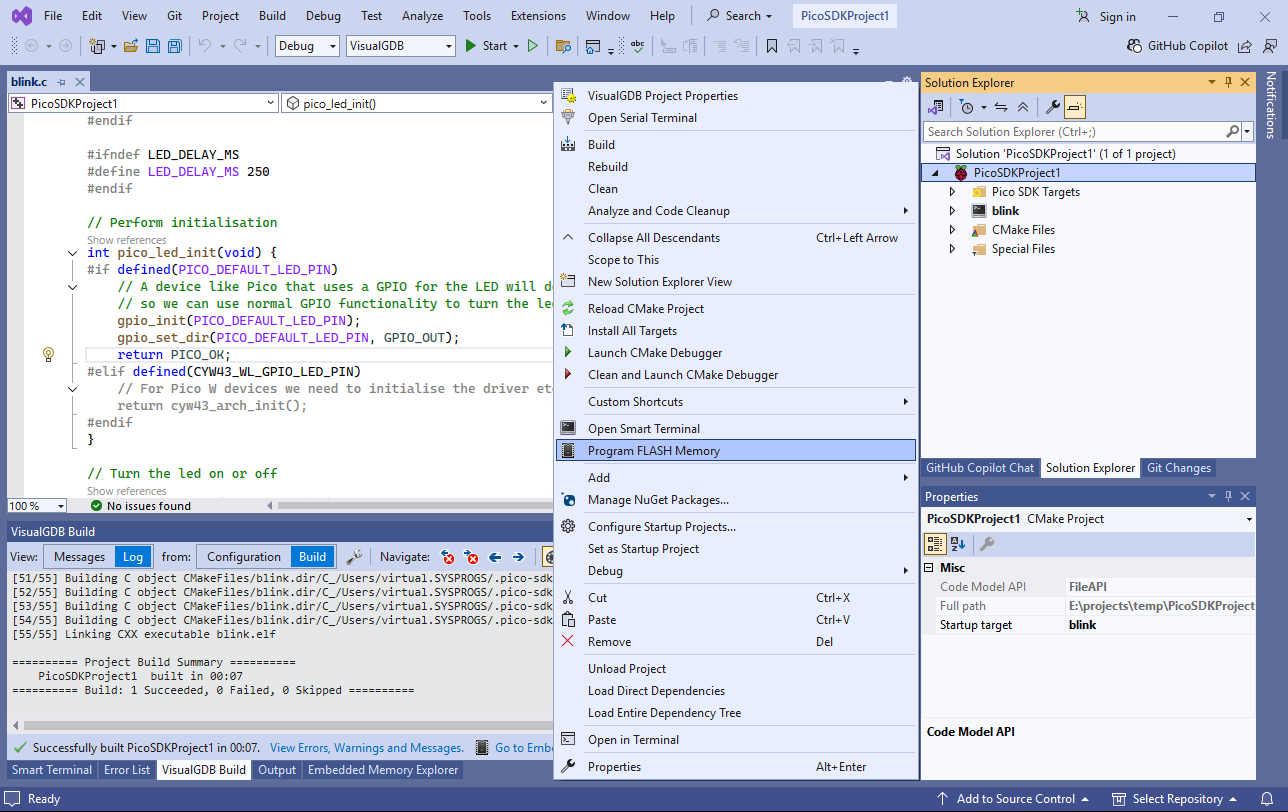
- Right-click on the project node in Solution Explorer (with the Raspberry Pi icon) and select “Program FLASH Memory”:
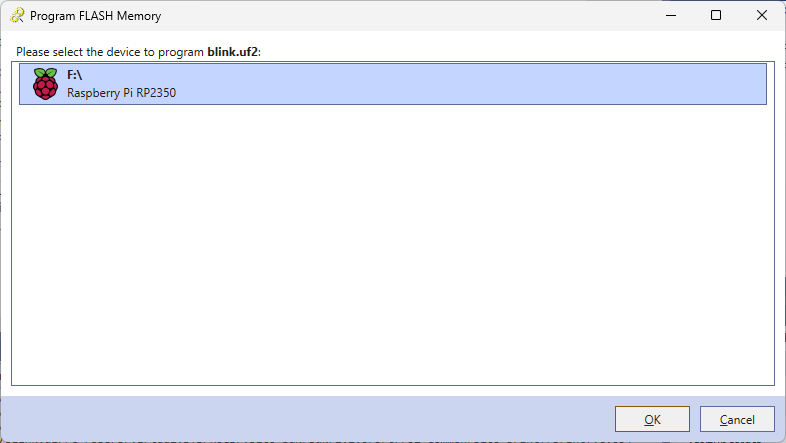
- Select your Pico device in the list and press OK:
- The FLASH memory will get programmed and the RP2350 will restart in the RISC-V mode. You can now press F5 in Visual Studio to begin debugging it:
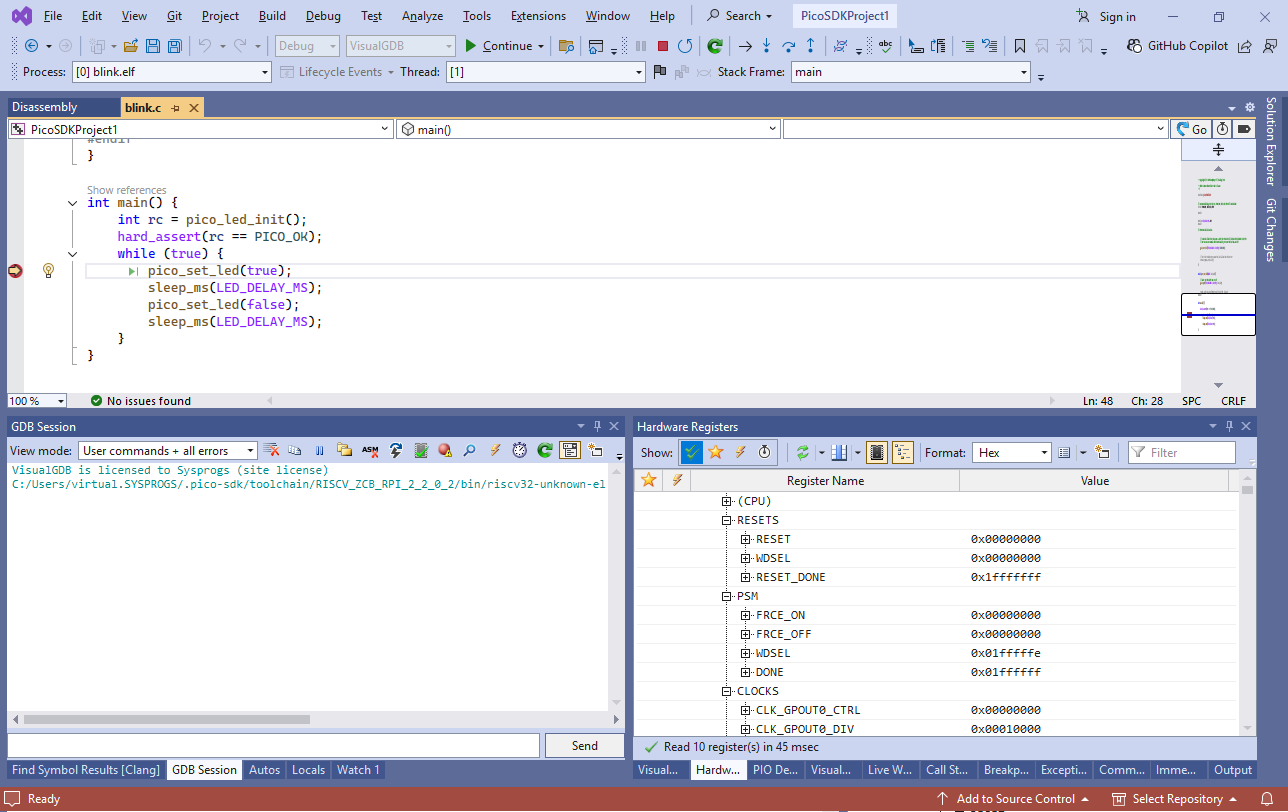
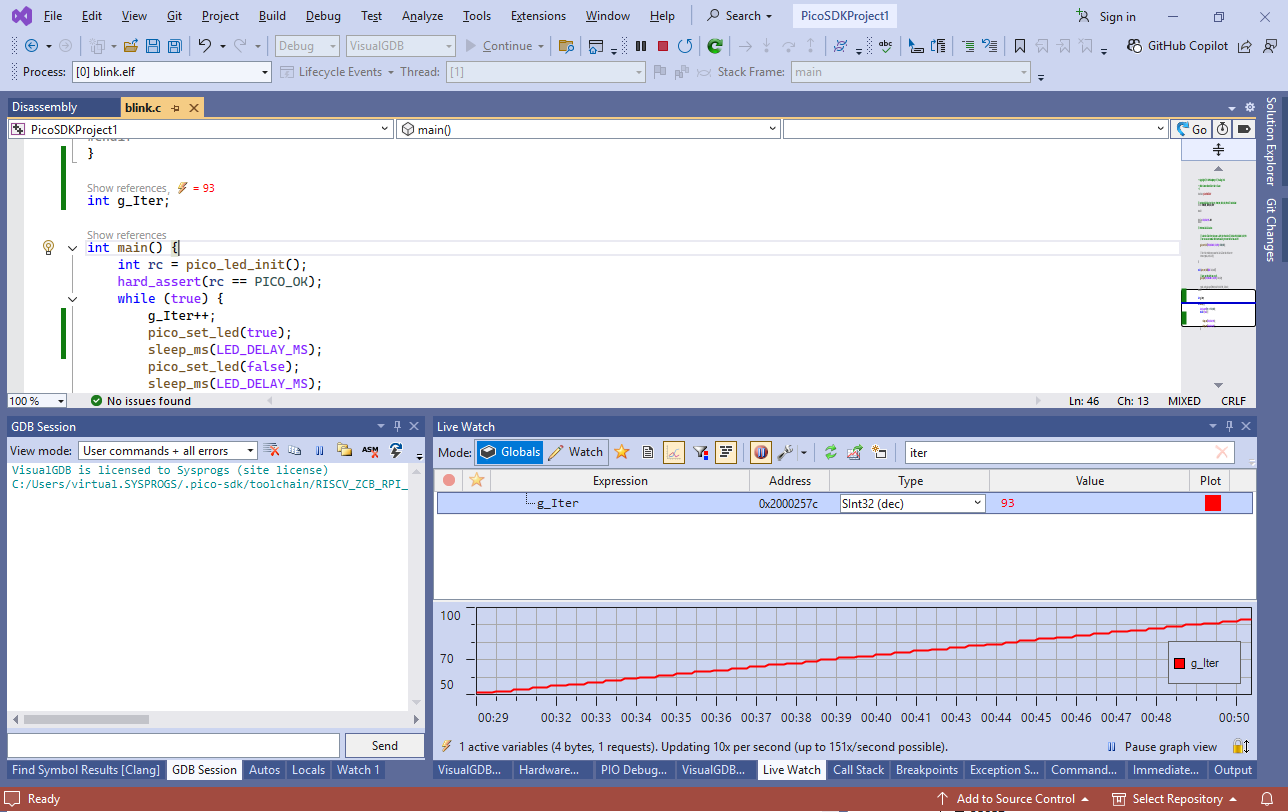
- Just like the ARM CPUs, RISC-V supports background memory reads, so you can use the Live Watch window to view global variables in real time without stopping the target:
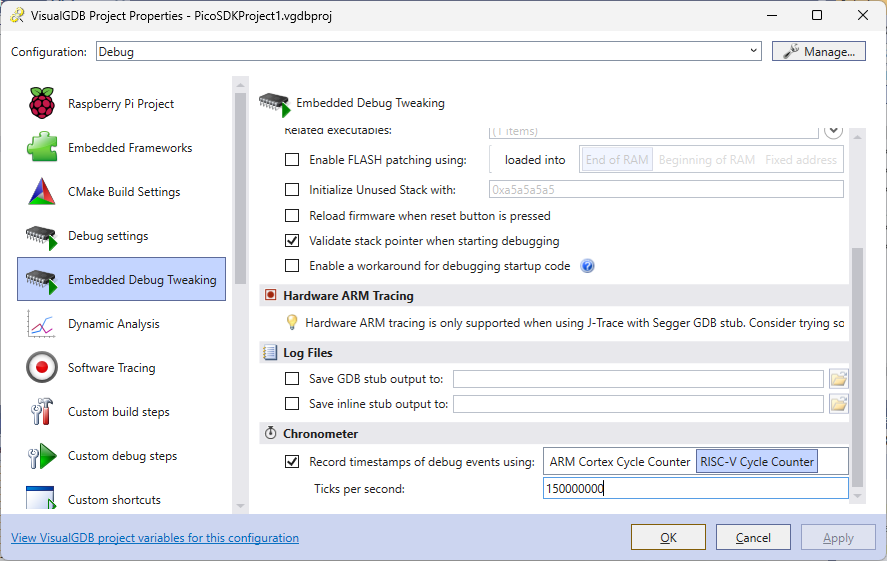
- RISC-V also supports instruction counters. You can enable it via the Chronometer configuration in VisualGDB Project Properties -> Embedded Debug Tweaking (Custom edition or higher):
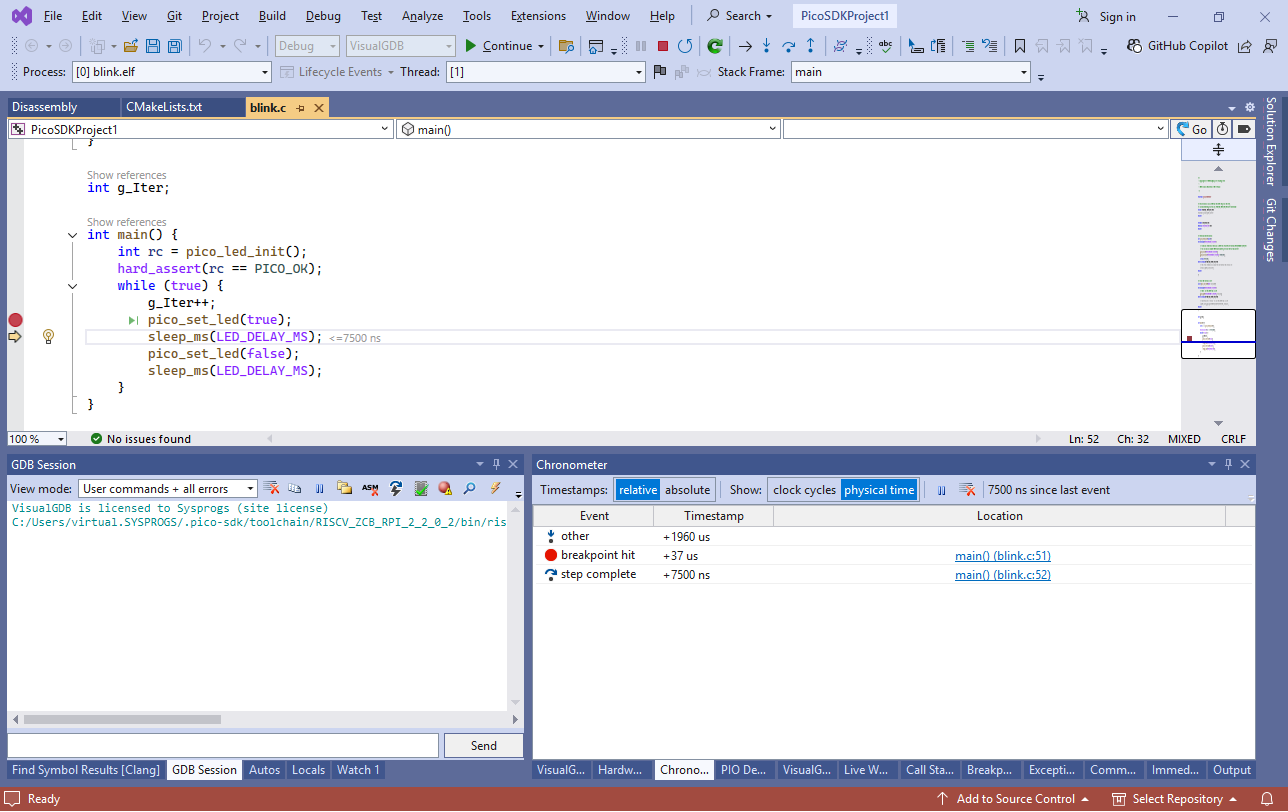
- Now you can see how many cycle counts it took to do a step, or reach another breakpoint, so you can fine-tune and optimize your code:
- If you would like to use picotool to directly control your device (e.g. reboot it into ARM/RISC-V mode), you can use the View->VisualGDB Smart Terminal command. It will open a terminal window with the PicoSDK build environment pre-loaded, and will remember the command and directory history for each individual project: