Customizing Tool Window Behavior
VisualGDB comes with many tool windows that facilitate various debugging tasks (e.g. GDB Session, Live Watch, Hardware Registers, etc.). Normally, these windows automatically appear when the related functionality becomes available (e.g. when debugging a device that has hardware register definitions, the Hardware Registers window will be shown):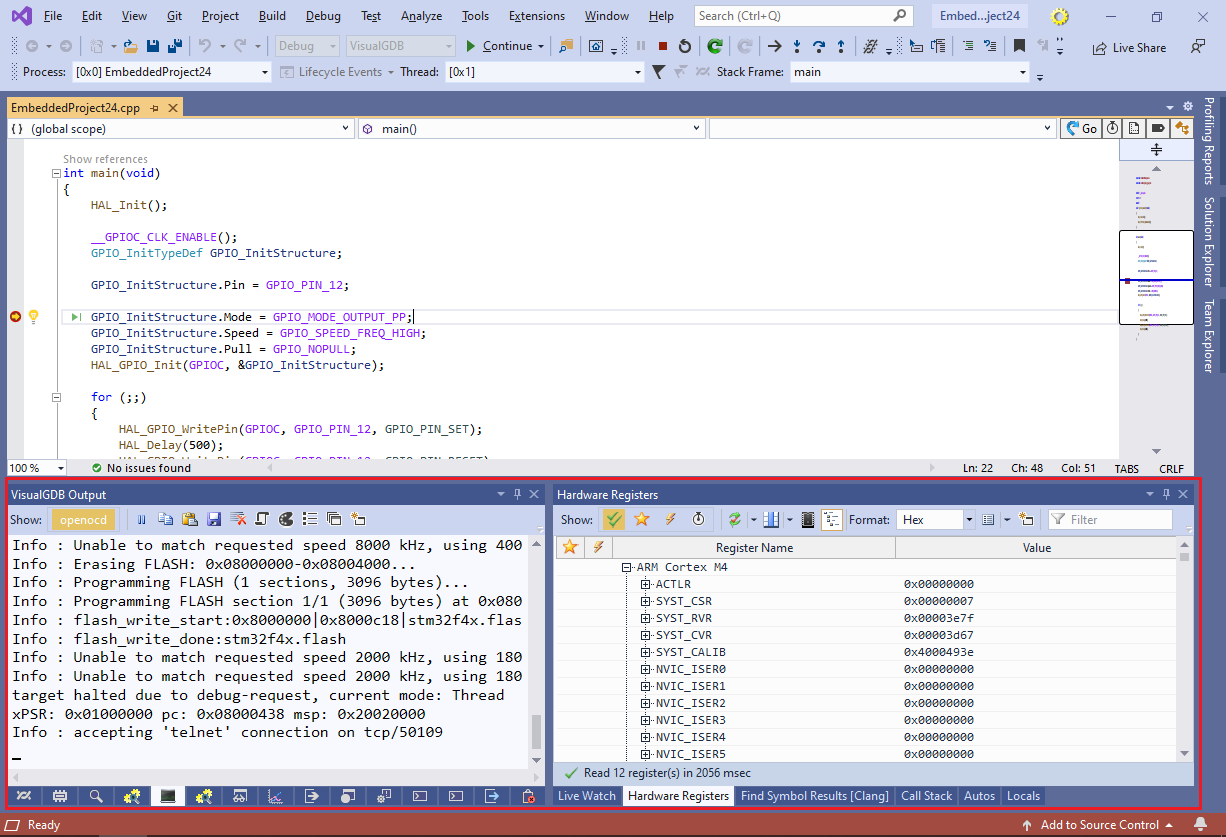 You can reduce the amount of active tool windows, or prevent them from being shown on top of other windows via Tools->VisualGDB->Configure Tool Window Behavior:
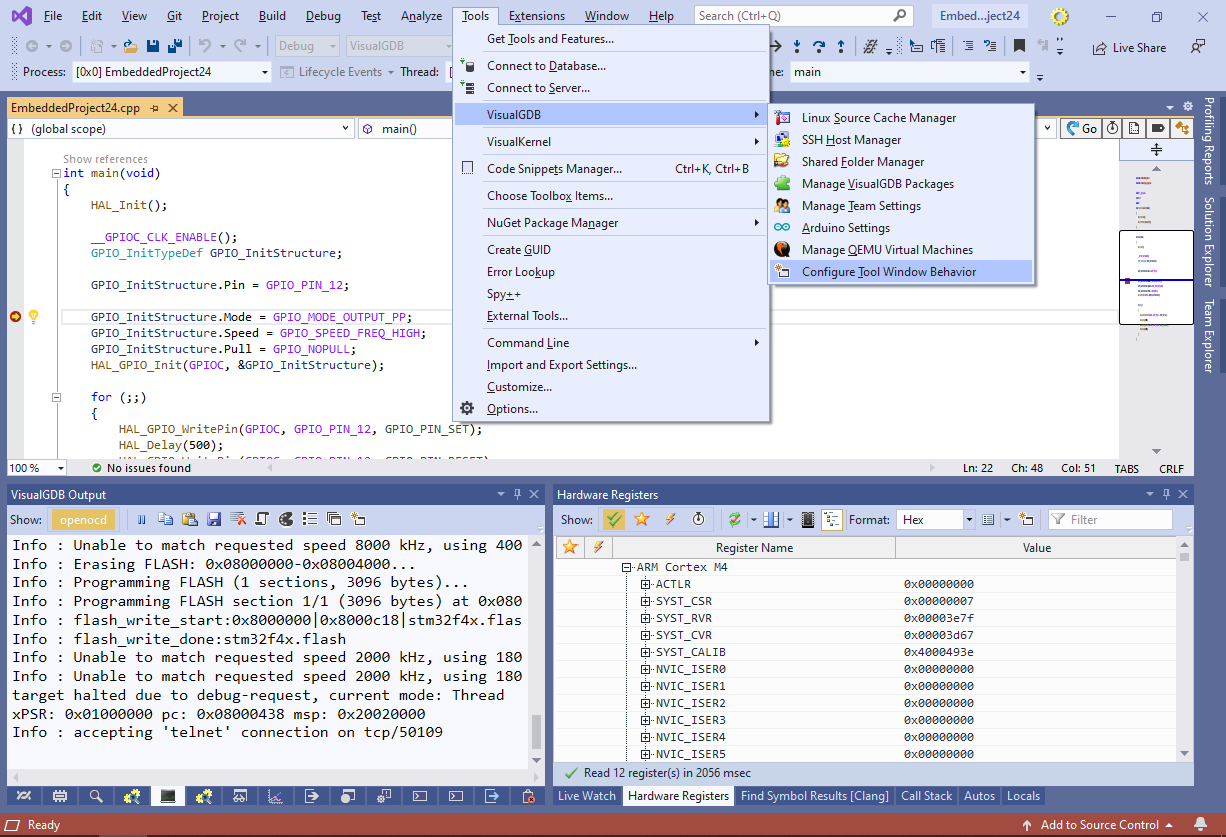 This opens a list of all tool windows supported by VisualGDB along with various events that could trigger their activation:
 Some windows have multiple activation events that can be configured separately. For instance, you can configure the console window to automatically activate when a new output channel opens (e.g. the firmware has initialized the semihosting logic). You can sort the tool window events by the last occurrence time by clicking at the “Last Occurrence” column header in the configuration window.
Each event can be configured to one of the 3 modes:
- Activate – the tool window will immediately appear. If it was already open in the background, it will be brought to top.
- Show – if the tool window was previously closed, it will be shown. If it was open in the background, it will remain in place and will not be brought to top.
- Ignore – if the tool window was previously closed, it will not be automatically shown. You can manually activate it via a command under Debug->Windows.
Many tool windows provide a convenient button to show the behavior configuration window and highlight the current tool window in it: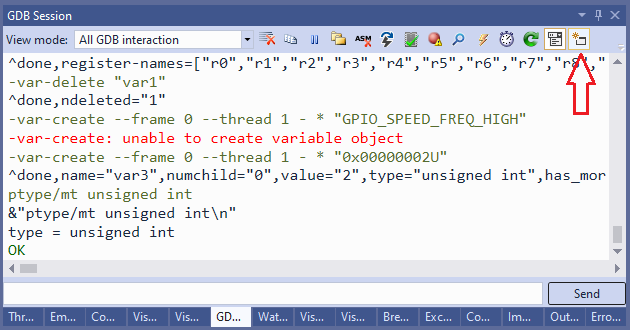
Examples
The examples below explain the difference between various window modes:
Example 1 – Explicit Activation
- Set the Hardware Registers behavior to Activate.
- Start an embedded debug session. Both windows will be brought to top (the order can be arbitrary).
- Bring the Watch window on top of the Hardware Registers window.
- Stop the debug session and start another one. Because the window behavior was set to Activate, the Hardware Registers window will appear on top of the Watch window.
Example 2 – Show without Activation
- Set the Hardware Registers behavior to Show.
- Start an embedded debug session. Bring the Watch window on top of the Hardware Registers window.
- Stop the debug session and start another one. The Watch window will remain on top of the GDB Session window as it was left at the end of the previous session.
Example 3 – Reopening Windows
- Set the Hardware Registers behavior to Show.
- Start an embedded debug session. Close the Hardware Registers window and open the Watch window in its place.
- Stop the debug session and start another one. The Hardware Registers window will appear on top of the Watch window (as if it was set to Activate). This happens because reopening a previously closed window always brings it to top. If you keep the Hardware Registers window open in the background instead, it will remain open.
Example 4 – Ignoring Events
- Set the Hardware Registers behavior to Ignore.
- Start an embedded debug session. Close the Hardware Registers window.
- Stop the debug session and start another one. The Hardware Registers window will remain closed. You can manually open it via Debug->Windows->Hardware Registers.
Example 5 – Different project Types
- Set the Hardware Registers behavior to Show.
- Start an embedded debug session. The Hardware Registers window will be shown.
- Stop the session and start a Linux debug session. The Hardware Registers window will be closed because it is not relevant for Linux projects.
- Stop the session and start an embedded debug session again. The Hardware Registers window will be shown on top of any other window. This happens because running a Linux debug session (without the Hardware Registers window) was equivalent to closing it manually. You can set the window behavior to Ignore to avoid this.
Limitations
Due to the way Visual Studio handles tool windows, VisualGDB cannot distinguish between closed tool windows and background tool windows that have not been used since starting Visual Studio. This way, every tool window configured to Show will be brought to top first time it is used after restarting Visual Studio. Windows opened in the background will remain in the background during subsequent debug sessions.