Creating and Debugging a Wi-Fi HTTP Server with the RS14100 Module
This tutorial shows how to create a basic Wi-Fi HTTP server using the RS14100 wireless module. We will create a basic project based on the access_point sample from the RS14100 SDK, will show how to build and debug it, and will then modify the sample to act as a basic HTTP server.
Before you begin, install VisualGDB 5.5 or later, and make sure you have the latest updates via Tools->VisualGDB->Manage VisualGDB Packages.
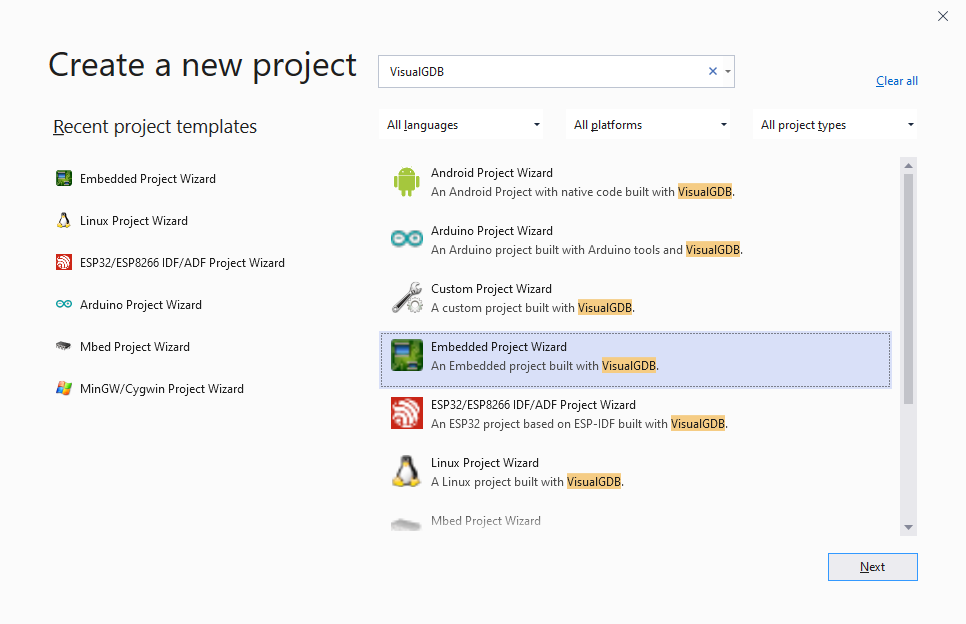
- Start Visual Studio and select “File->New Project”. Then pick the VisualGDB Embedded Project Wizard:
- Enter the name and location for the new project, then press “Create” to launch the VisualGDB-specific part of the wizard:

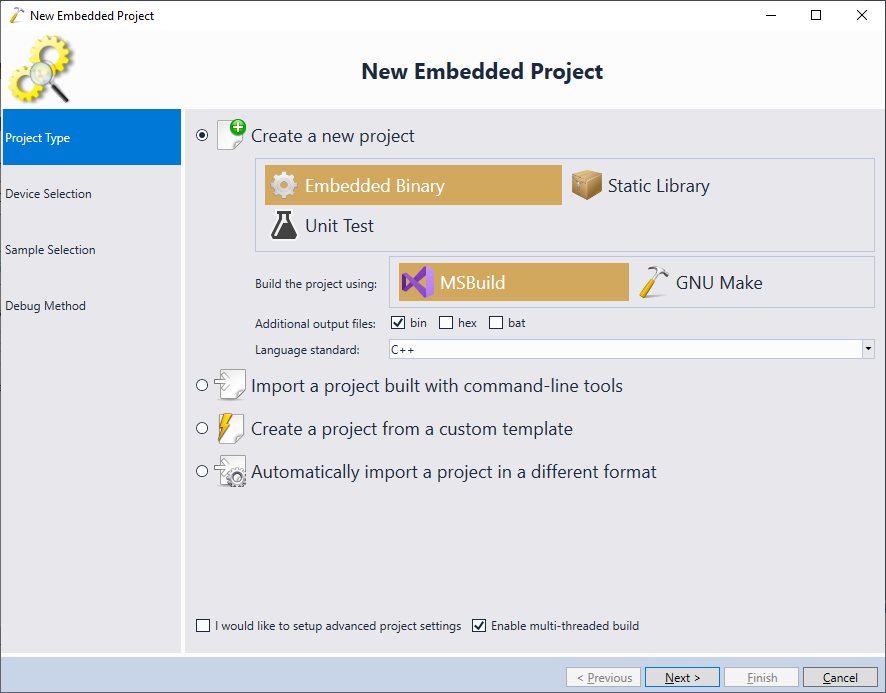
- Proceed with the default project type and build subsystem (Embedded Binary -> MSBuild):
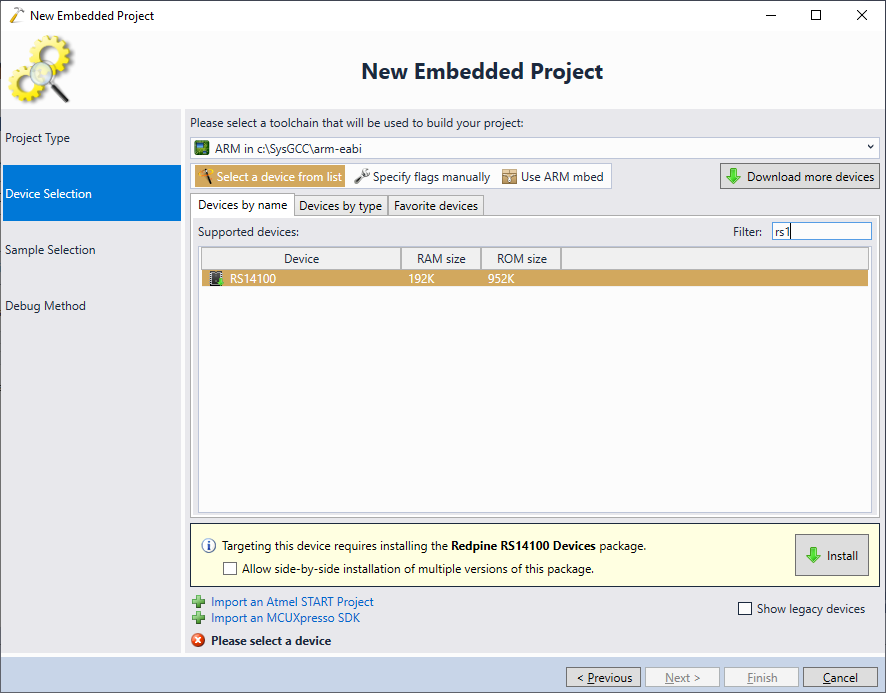
- On the next page pick the default ARM toolchain and select the RS14100 module in the list. Click “install” to automatically download and install the RS14100 support files:
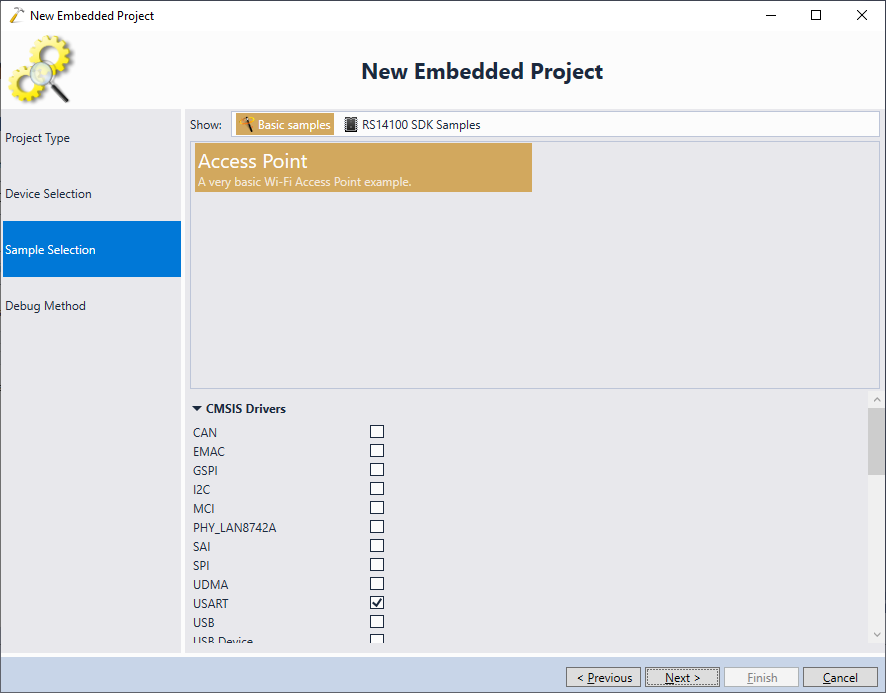
- The next page of the wizard allows selecting a sample. In this tutorial we will use the “Access Point” sample from the “Basic samples” view:
 You can also explore various samples from the RS14100 SDK by switching to the “RS14100 SDK Samples” view. They will build out-of-the-box, however we have not tested them on the hardware.
 - Connect your board to an JTAG/SWD debugger, and make sure both the board and the debugger are powered on.
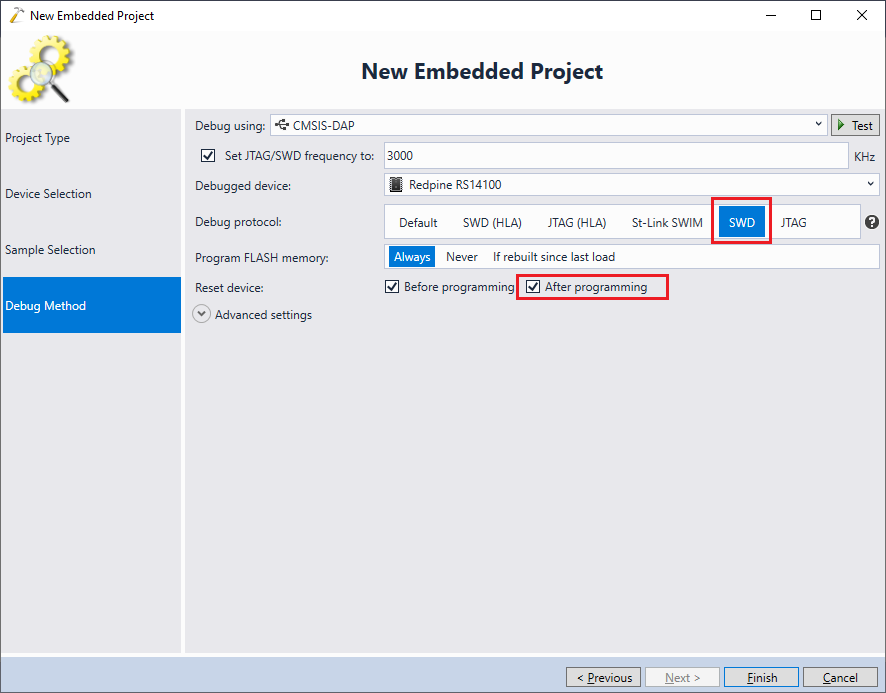
WARNING: In this tutorial we will use the CMSIS-DAP debugger that comes with the RS14100 evaluation board, however it is known to be relatively unreliable and have random connectivity problems. If you are not able to debug the board using it, please try a different SWD-capable debugger and a different SWD cable. You can find instructions for connecting different JTAG/SWD debuggers on this page. - Once the debugger is connected to USB, VisualGDB will automatically detect it and configure OpenOCD. If you encounter problems, make sure the debug protocol is set to SWD and the “Reset device after programming” checkbox is checked:
 If you are using Segger J-Link and the J-Link GDB Stub does not support RS14100, simply select OpenOCD instead of J-Link Software on the Debug Settings page and you will still be able to debug RS14100 with it.
 - Press the “Test” button to verify the debugging setup. Note that VisualGDB will warn about zero values for most registers:
 This is normal for RS14100 devices and can be ignored, as long as there are no other errors.
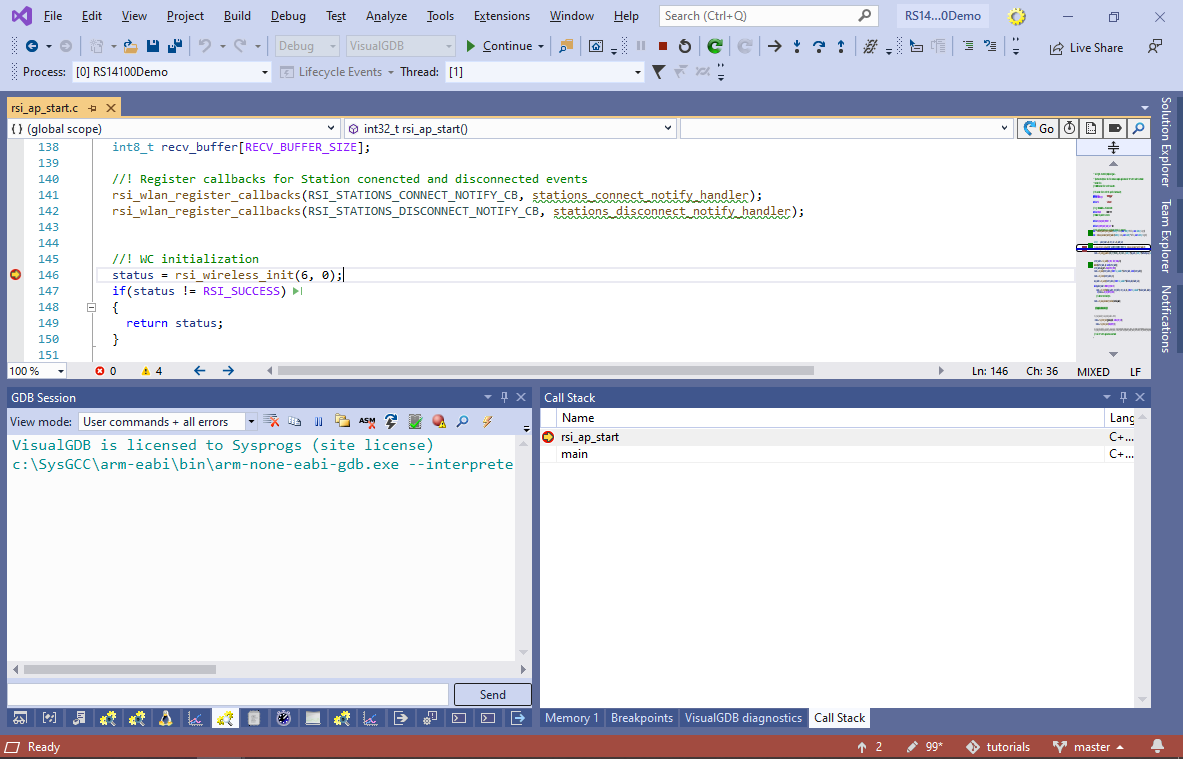
 - Press “Finish” to create the project. Then, set a breakpoint in the rsi_ap_start() function at the call to rsi_wireless_init() and press F5 to build the project and start debugging it:
- Before we can do any meaningful debugging, we will first adjust the project to display diagnostic output (including the correct IP address) via the fast semihosting interface. Stop debugging by pressing Shift-F5 and open VisualGDB Project Properties -> Embedded Frameworks. Then, reference the “Fast Semihosting and Embedded Profiler” framework:
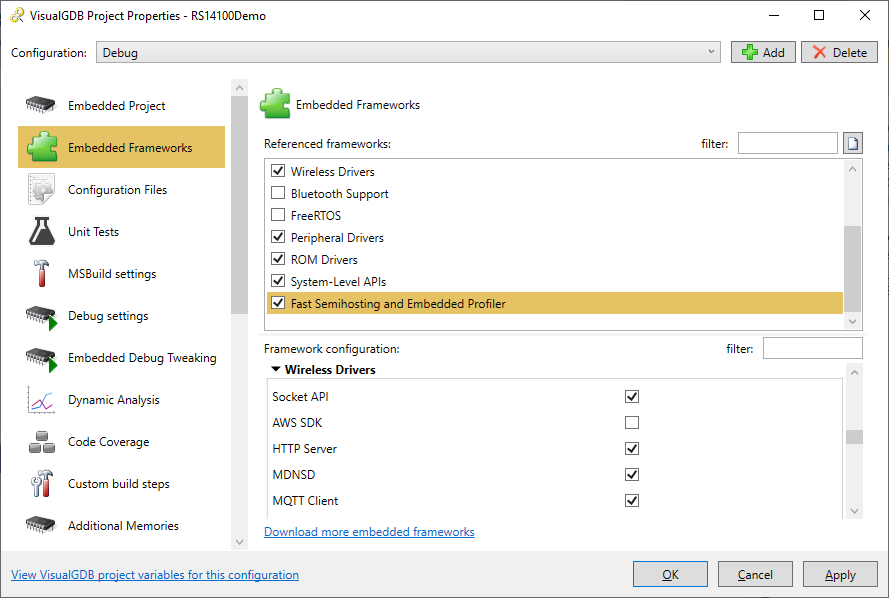 You can also use the Embedded Frameworks page to reference various components of the RS14100 SDK. Each framework can be further tweaked using the “Framework Configuration” view.
 - Now that we referenced the Fast Semihosting framework, we can modify the project to produce more debug output (note that unless each line ends with “\n”, printf() won’t output it immediately):
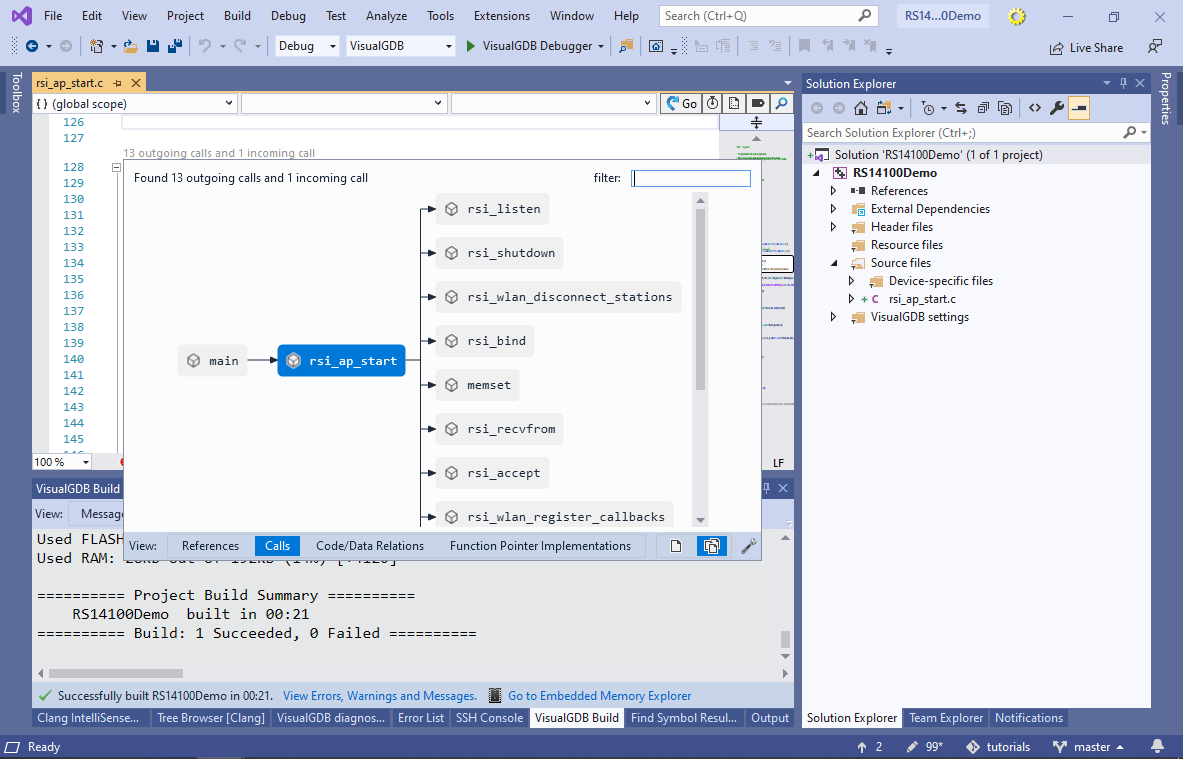
- Locate the rsi_ap_start() function in the main source file. You can get a quick overview of the functions called by it via the CodeJumps link just on top of the function name:
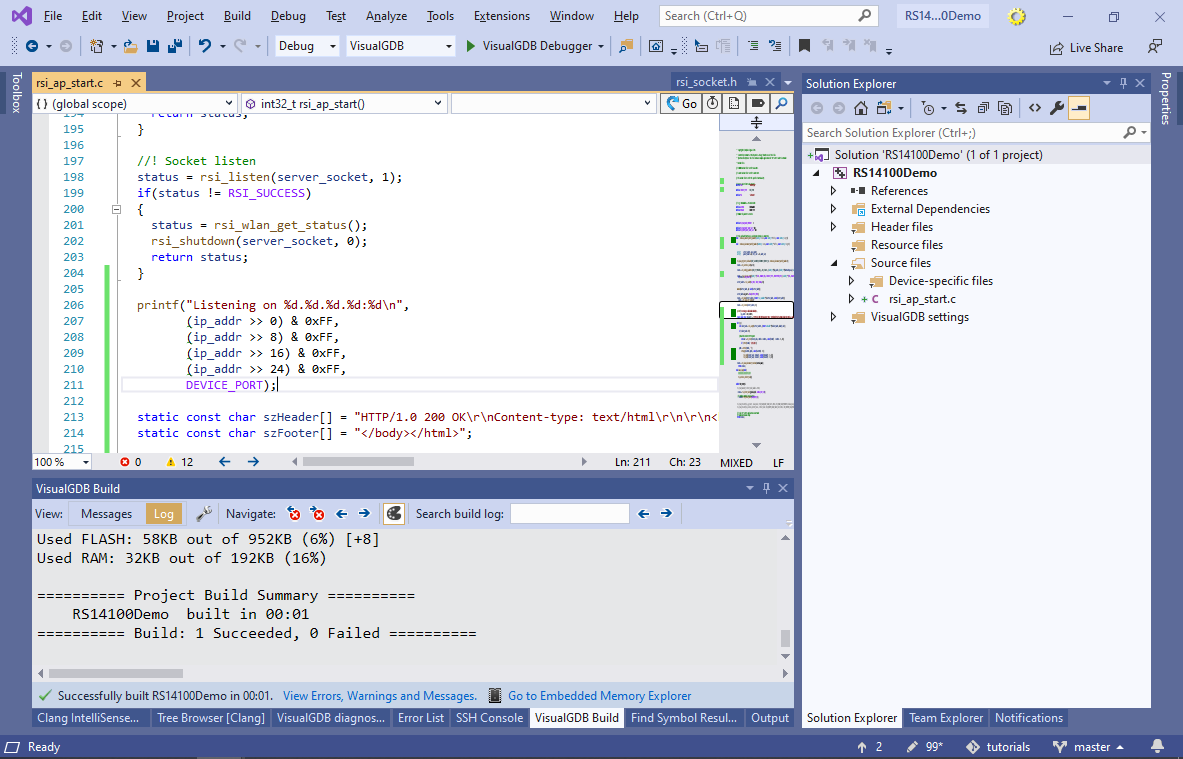
- The function calls the RSI socket api (e.g. rsi_listen(), rsi_accept(), …) to listen to the incoming connections on a fixed TCP port. Once an incoming connection is received, it transfers some data and closes the connection. We will replace this logic with a very basic HTTP server that will continuously listen for connections on the given port and will print back the URL in response to each request. Replace the code after rsi_listen() with the following:
  printf("Listening on %d.%d.%d.%d:%d\n",
         (ip_addr >> 0) & 0xFF,
         (ip_addr >> 8) & 0xFF,
         (ip_addr >> 16) & 0xFF,
         (ip_addr >> 24) & 0xFF,
         DEVICE_PORT);

  static const char szHeader[] = "HTTP/1.0 200 OK\r\nContent-type: text/html\r\n\r\n<html><body><h1>Hello, world</h1>Greetings from RS14100! You have requested the following URL: ";
  static const char szFooter[] = "</body></html>";

  static volatile int RequestNumber = 0;
  static volatile char LastURL[128] = {
      0,
  };

  for (;;)
  {
      addr_size = sizeof(server_socket);
      int client_sock = rsi_accept(server_socket, (struct sockaddr *)&client_addr, &addr_size);
      RequestNumber++;
      static char szBuf[4096];
      int readPos = 0;
      char *pURL;
      if (client_sock < 0)
      {
          asm("bkpt 255");
          continue;
      }

      //Read the entire HTTP request
      for (;;)
      {
          int done = rsi_recv(client_sock, szBuf + readPos, sizeof(szBuf) - readPos - 1, 0);
          if (done < 0 || done >= (sizeof(szBuf) - readPos))
              done = 0;
          readPos += done;
          szBuf[readPos] = 0;
          if (strstr(szBuf, "\r\n\r\n"))
              break;
          if (!done)
              break;
      }

      pURL = strchr(szBuf, ' ');
      if (pURL)
      {
          char *pURLEnd = strchr(pURL + 1, ' ');
          if (pURLEnd)
          {
              pURL++;
              pURLEnd[0] = 0;
              strncpy(LastURL, pURL, sizeof(LastURL) - 1);

              rsi_send(client_sock, szHeader, sizeof(szHeader) - 1, 0);
              rsi_send(client_sock, pURL, strlen(pURL), 0);
              rsi_send(client_sock, szFooter, sizeof(szFooter) - 1, 0);
          }
      }

      rsi_shutdown(client_sock, 0);
  }
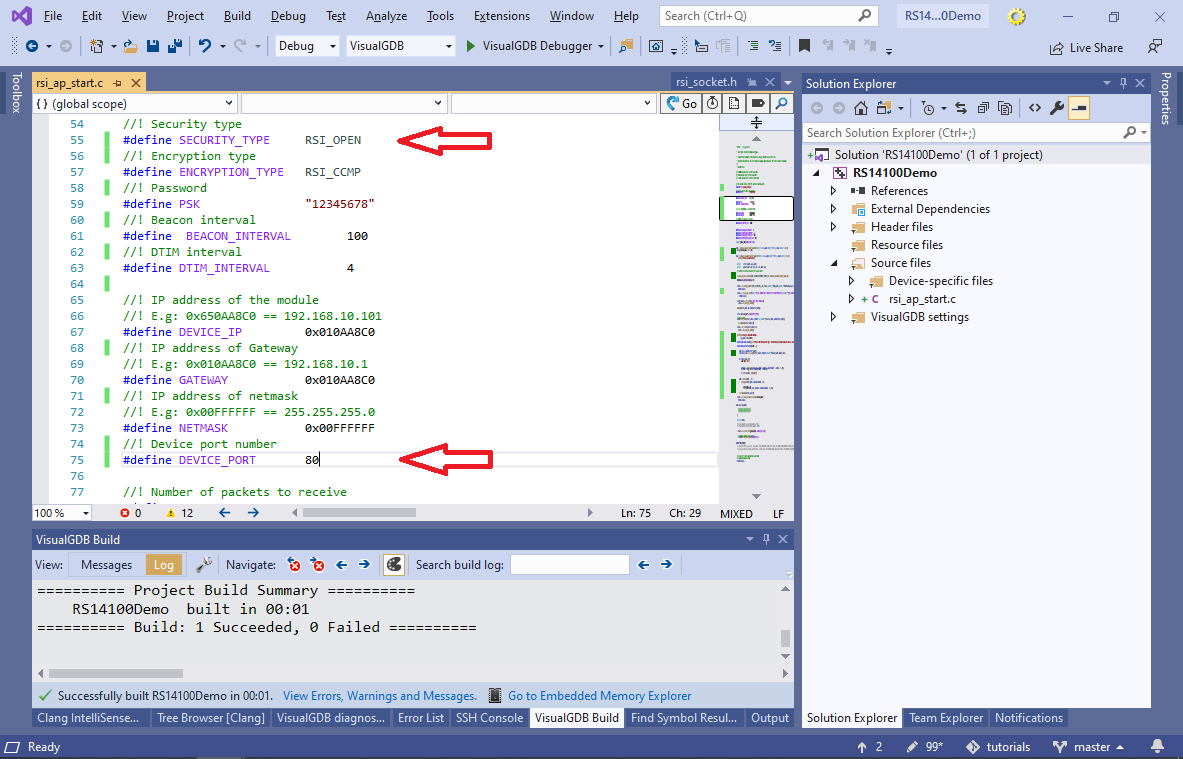
- To minimize compatibility problems with other devices, disable the the Wi-Fi security by setting SECURITY_TYPE to RSI_OPEN. Also set DEVICE_PORT to 80:
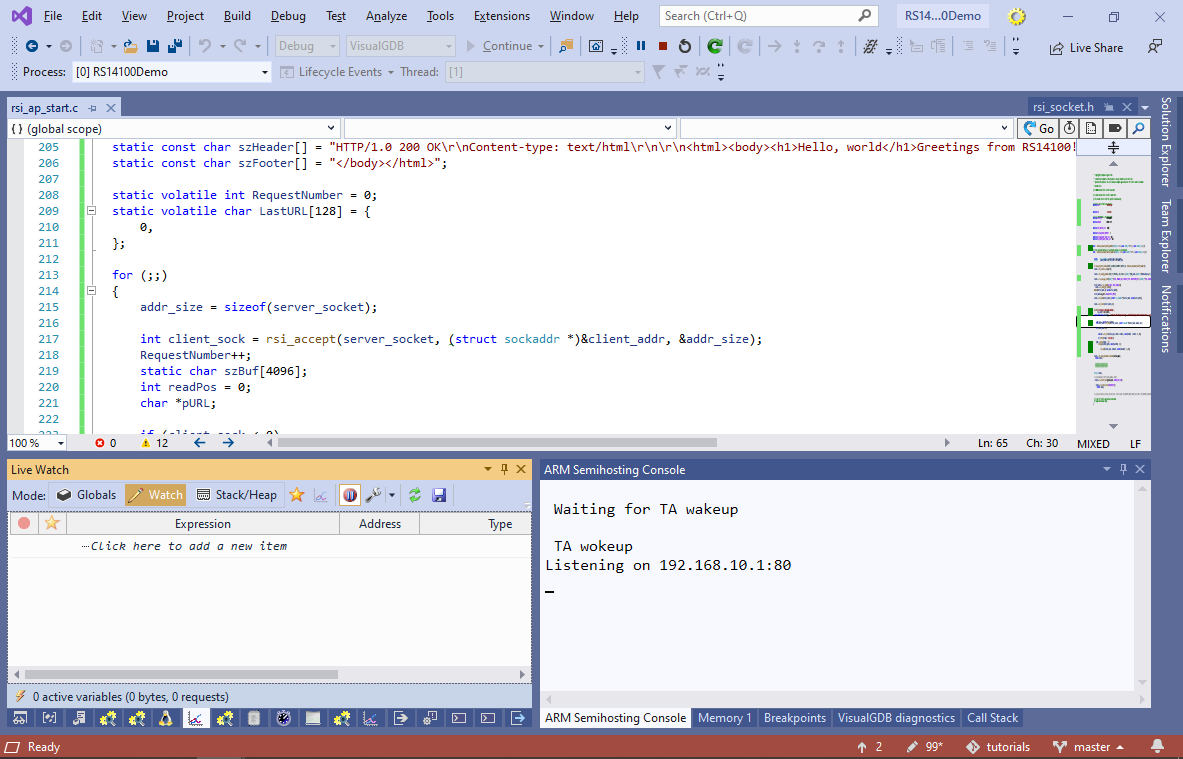
- Build and run the project again. The ARM Semihosting Console will now show the debug output from the board, including the IP address where it is listening:
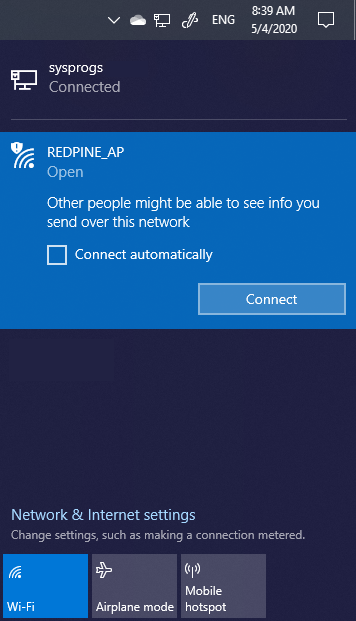
- Locate the REDPINE_AP wireless network on any Wi-Fi-capable computer and click “Connect” to establish a connection:
- Enter the IP address shown in the ARM Semihosting Console in the browser. You will see a basic page echoing back the URL:

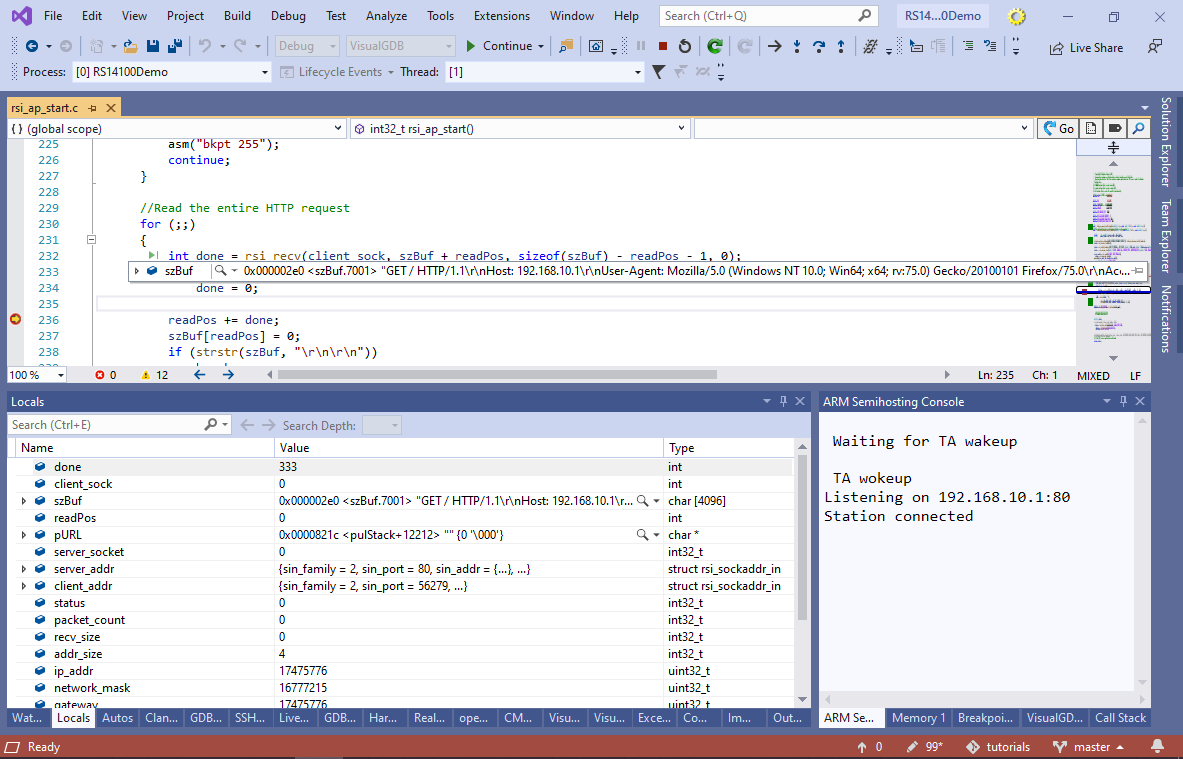
- You can use the regular debugging techniques (e.g. breakpoints, stepping) to see what is going on on the device:
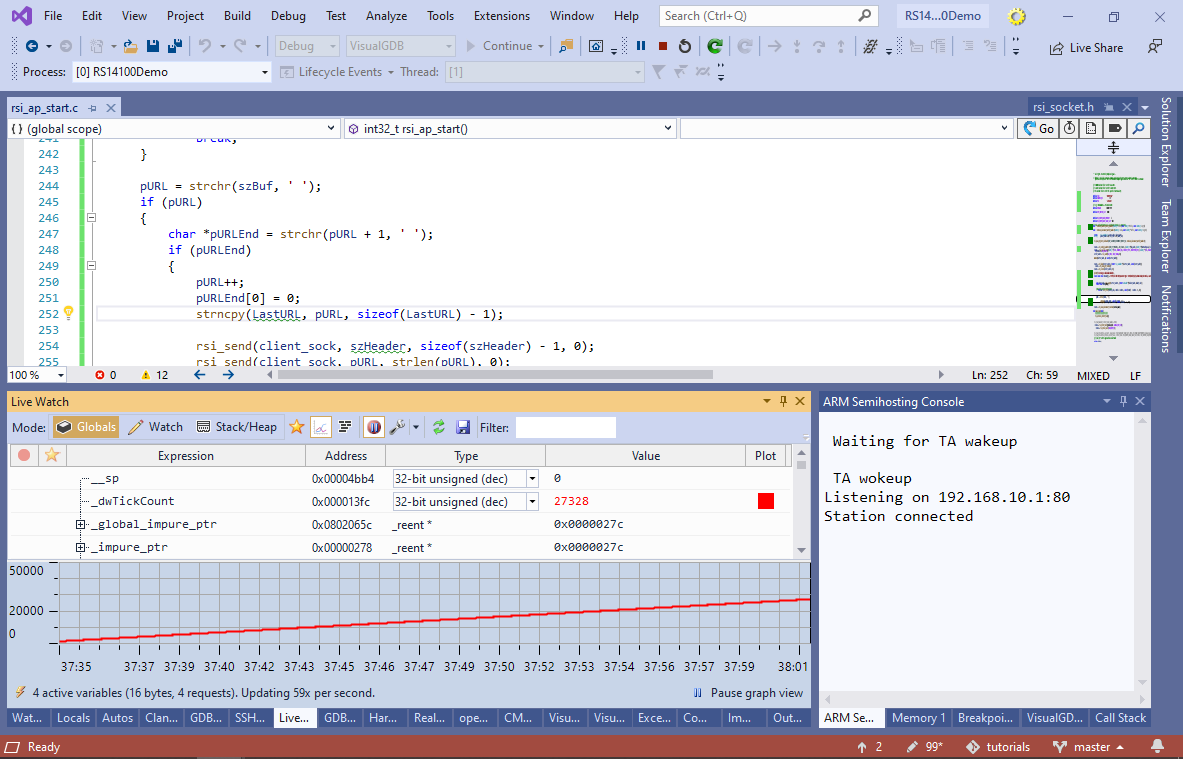
- Note that stopping at a breakpoint for too long may cause network timeouts. In the rest of the tutorial we will show how to avoid it by using VisualGDB’s non-intrusive debugging techniques instead. Open the Debug->Windows->Live Watch view and switch it to Globals. VisualGDB will show the state of all global variables without stopping the program. E.g. you can see how the _dwTickCount variable keeps growing:
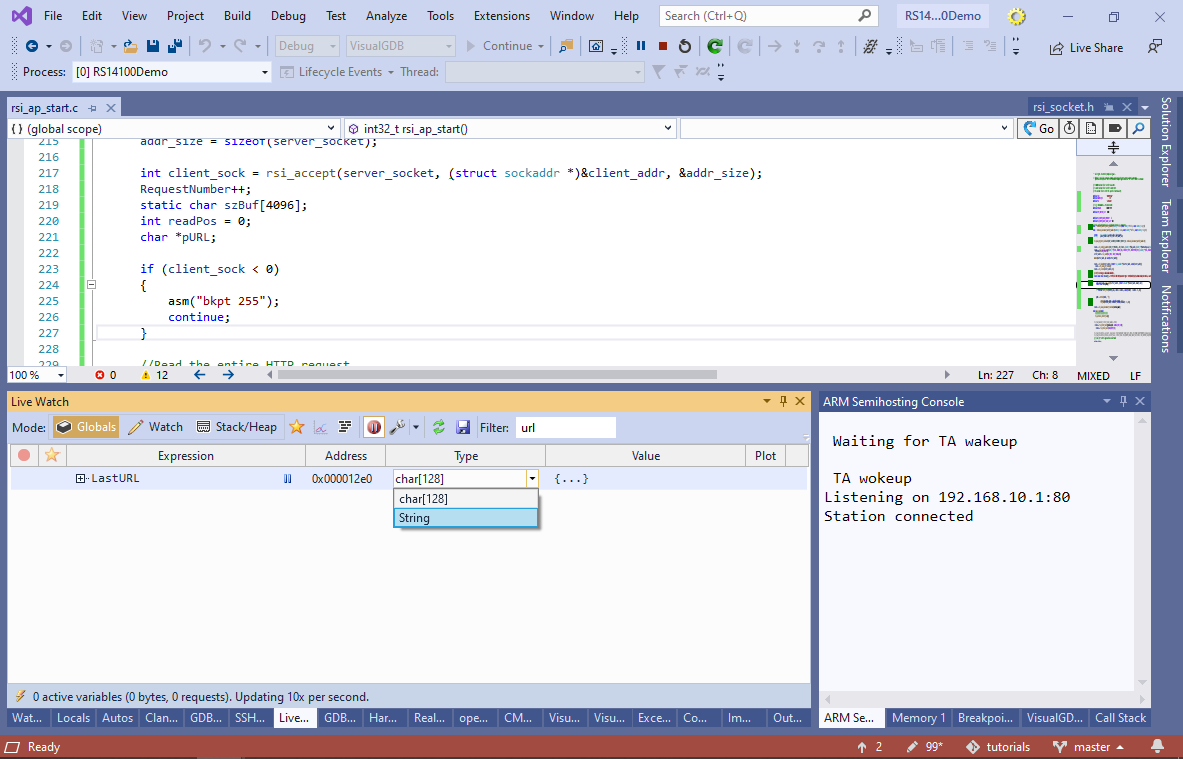
- Locate the LastURL variable in the list and switch its type to String:
- Then, enable the source code annotations in the Live Watch toolbar. VisualGDB will show the value of RequestNumber and LastURL directly in the code:
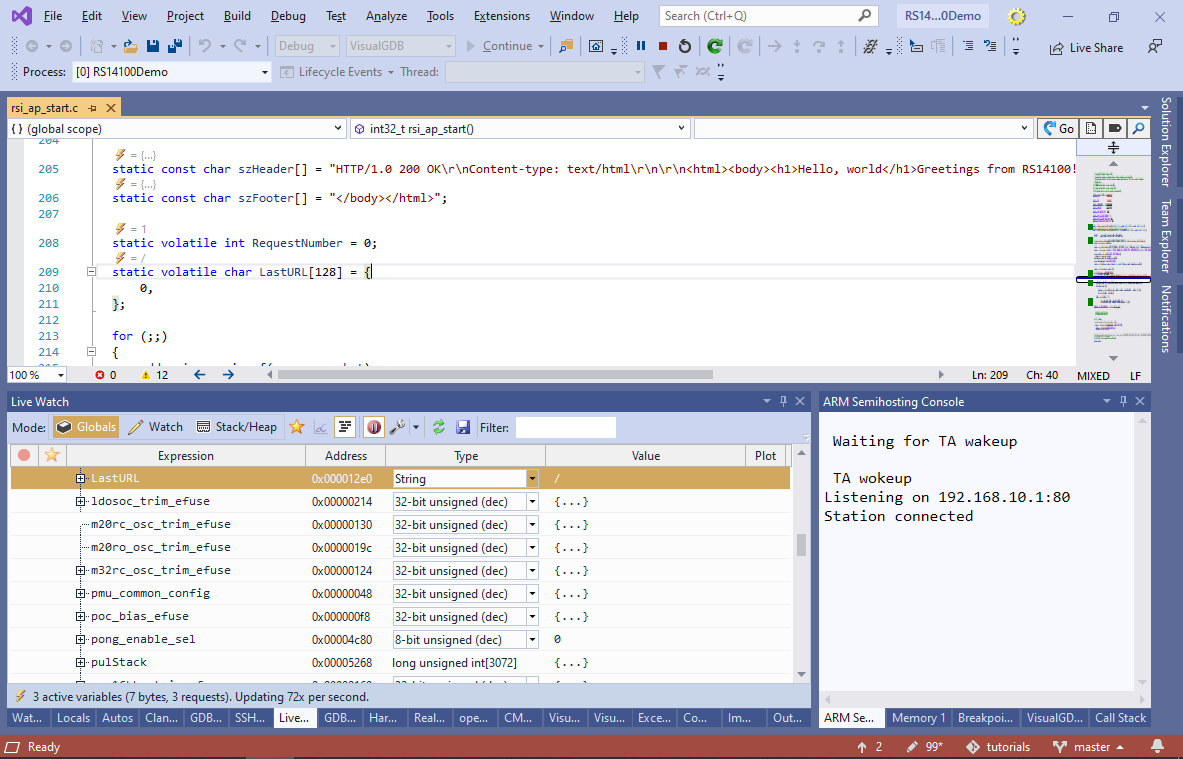
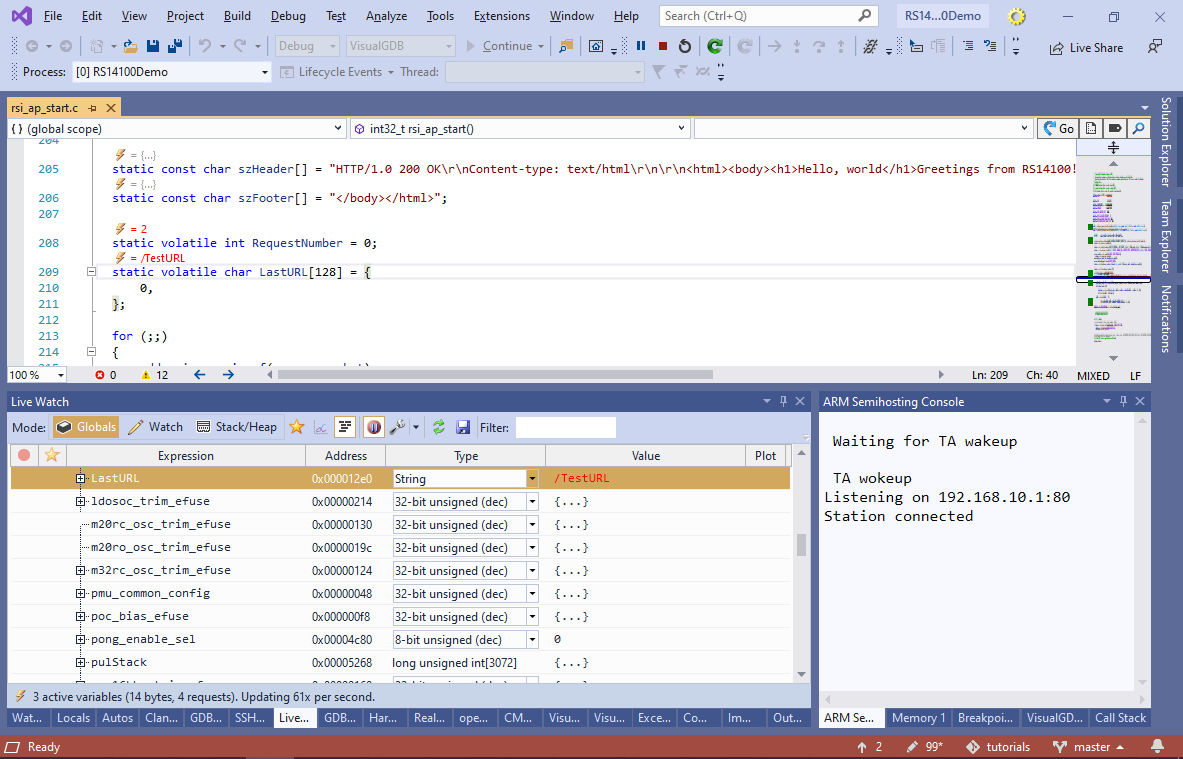
- As soon as you request a new URL, the variables will be immediately updated without having to stop the target, or causing any additional latency:
- Finally, we will show how to see which branches of the program get executed without setting any breakpoints. Open VisualGDB Project Properties and enable Live Coverage:
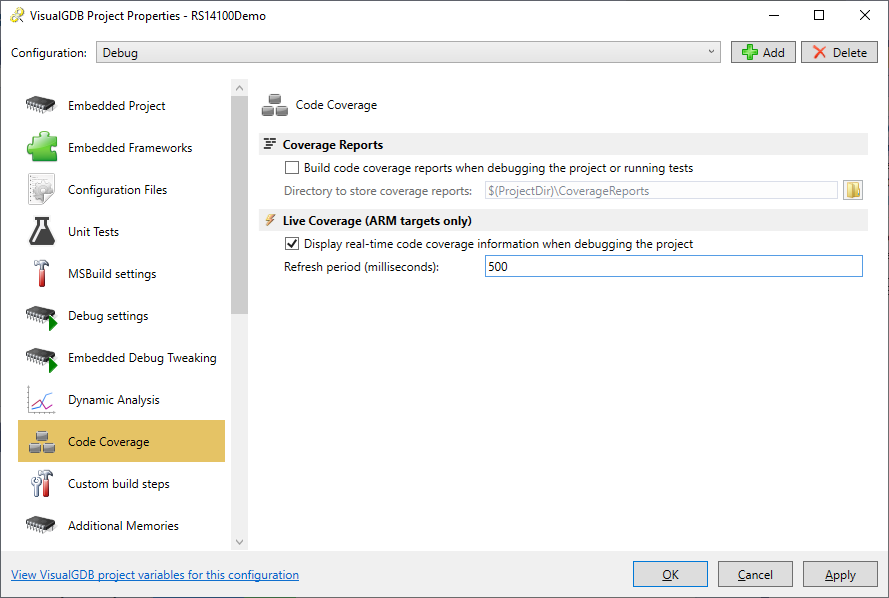
- Note that this will considerably increase the FLASH and RAM usage, as GCC will instrument every branch in the program to count the number of times it’s taken. You can reduce the memory overhead by disabling instrumentation for individual files via MSBuild Properties:
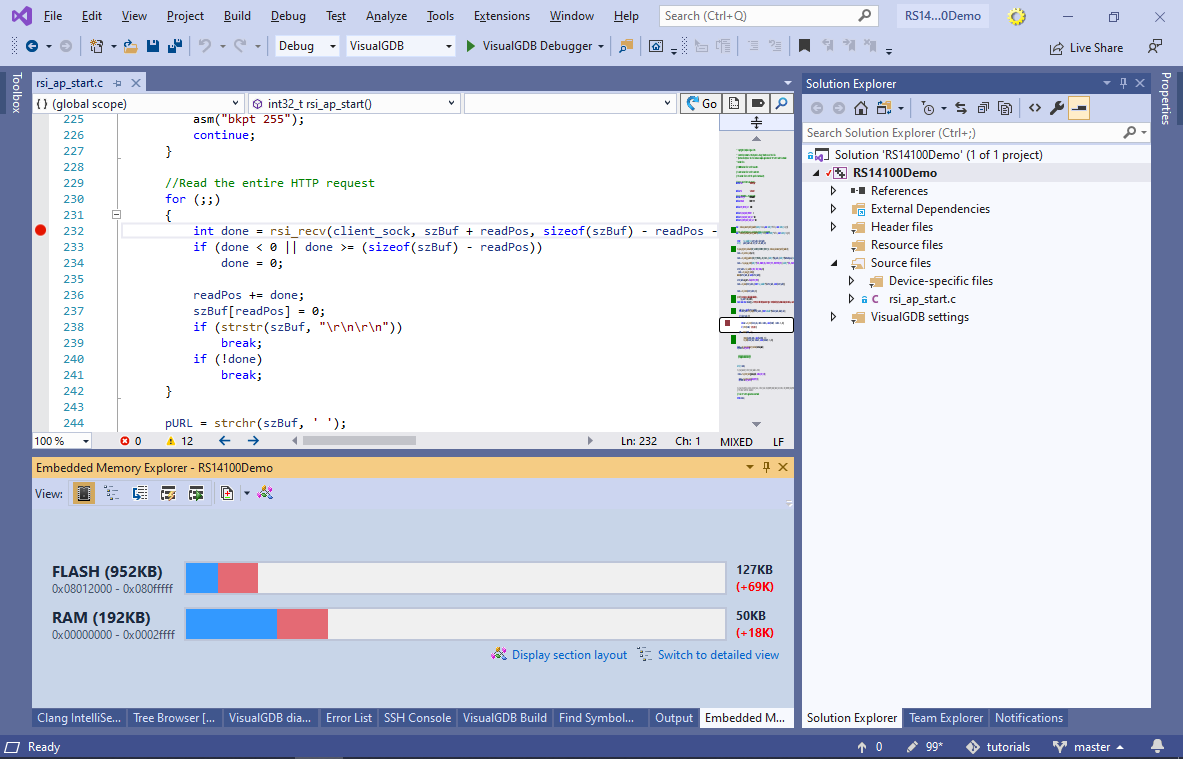
- The Live Coverage will show how many times and how long ago each function was executed, and will also highlight recently executed lines, so you can see what is going on without setting any breakpoints:

You can find the source code shown in this tutorial in our GitHub repository.