Exploring the STM32WL55 Examples with VisualGDB
This tutorial shows how to use VisualGDB to build, debug and explore the sample projects for the wireless STM32WL55 microcontrollers. We will show how to clone the LocalNetwork sample included in the STM32WL55 SDK, adjust it to enable debugging, and fix an issue that causes it to crash out-of-the-box.
The LocalNetwork sample consists of 2 projects: the concentrator that sends periodic beacon events, and the sensor that responds to them. In order to follow this tutorial, you will need two NUCLEO-WL55JC1 boards, as the STM32WL55 SDK 1.0 only includes samples for this type of board.
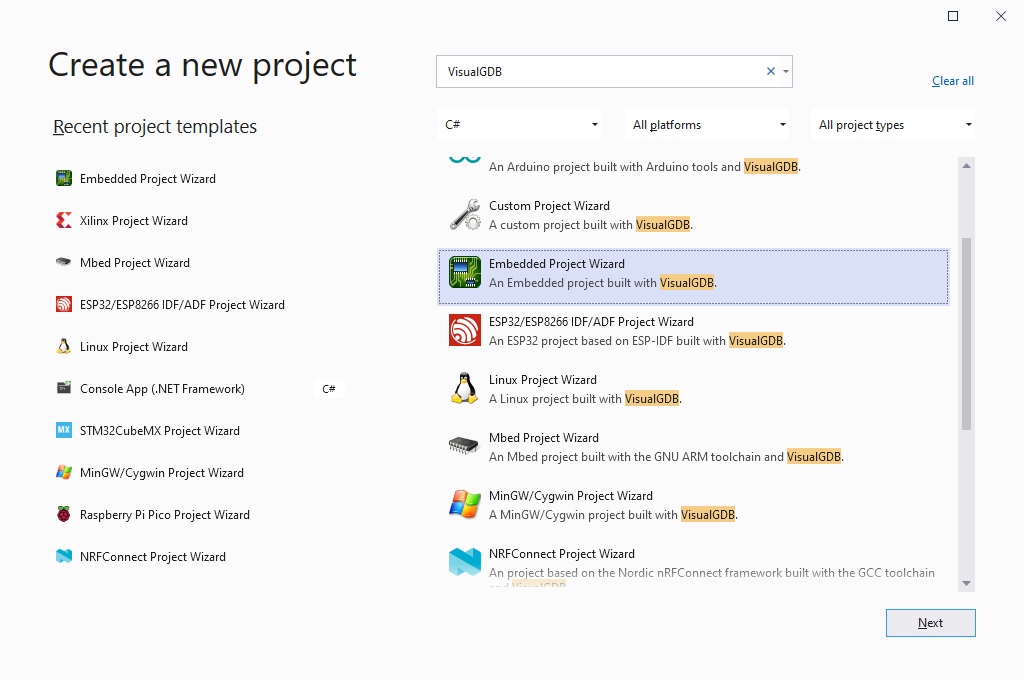
- Start Visual Studio and open the VisualGDB Embedded Project Wizard:
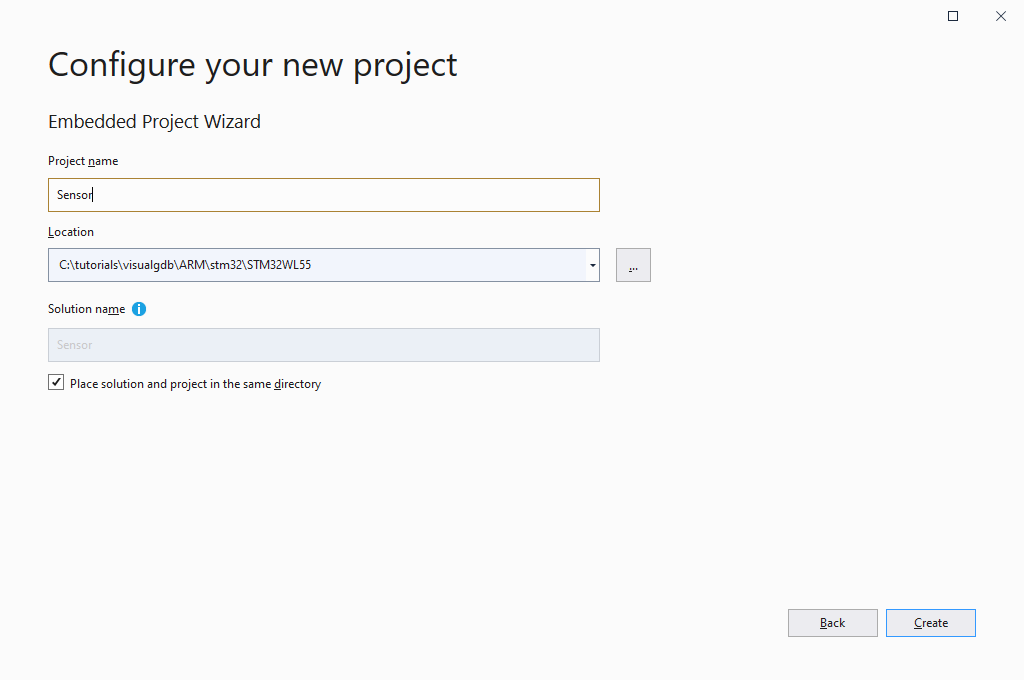
- Pick a name and location for the first project. Note that since we are using two boards, we will need to create two separate projects:

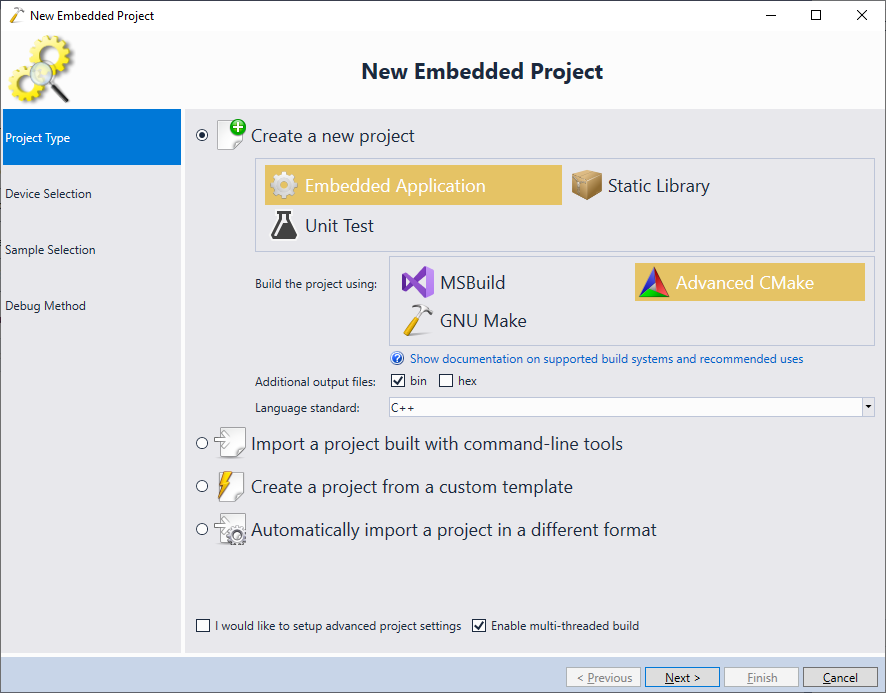
- On the next page, select “Create a new project -> Embedded Application -> Advanced CMake”:
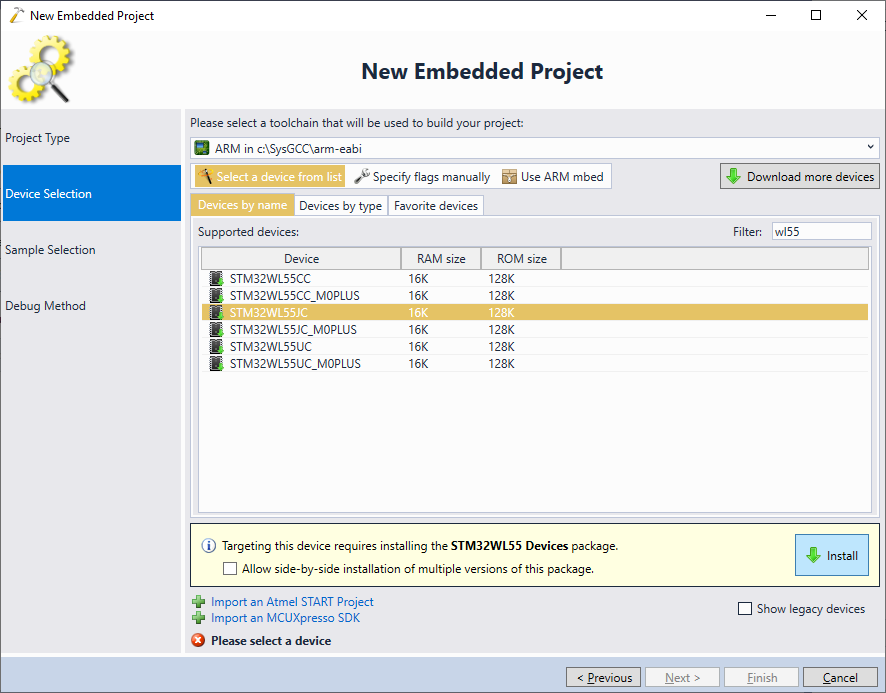
- Pick the ARM toolchain and select the STM32WL55JC device. Click “Install” to automatically download and install the STM32WL55 SDK:
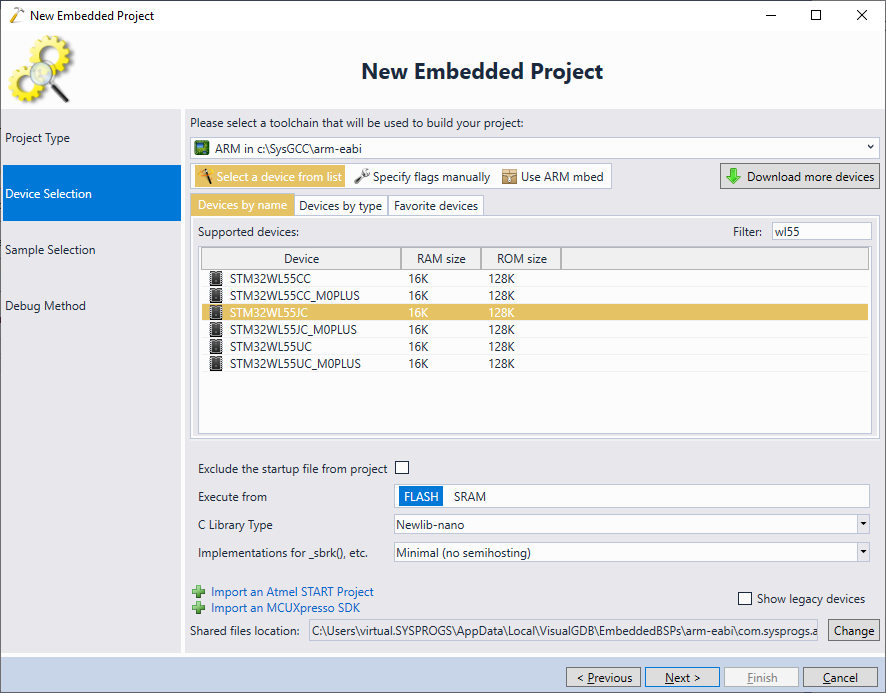
- Now that the SDK is installed, you can proceed with the default settings for the device:
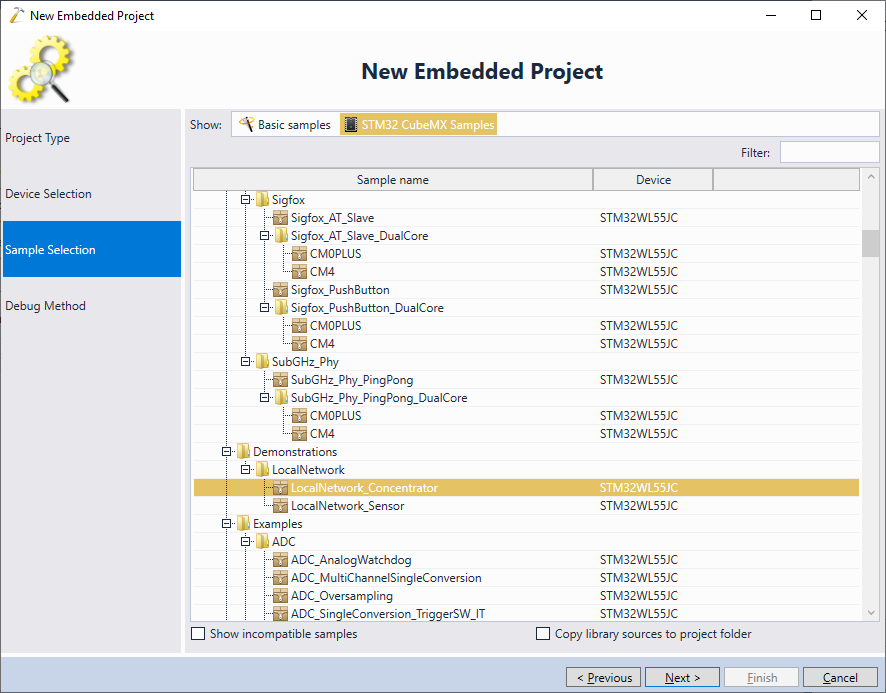
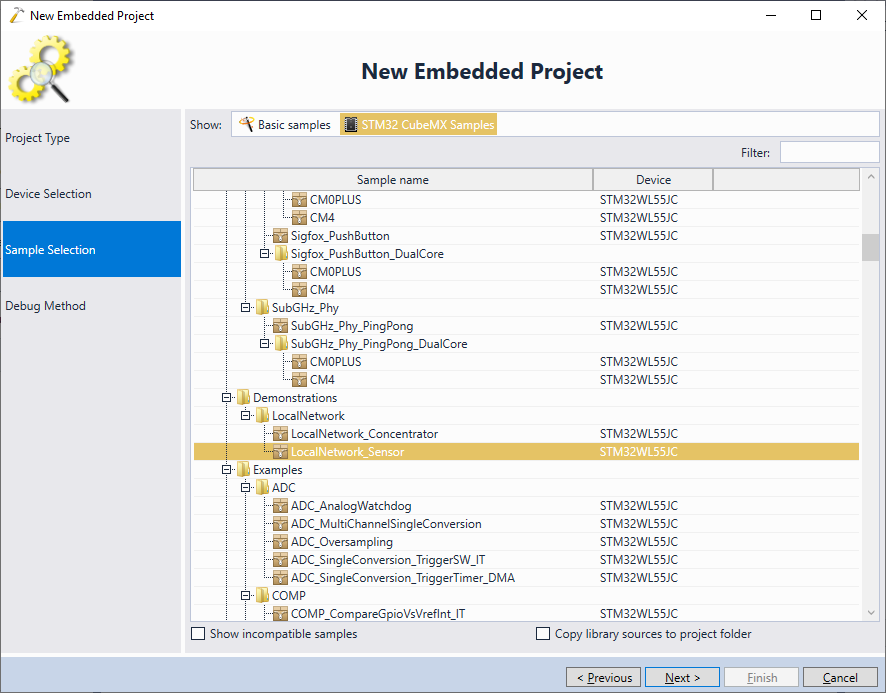
- The STM32WL55 BSP includes numerous examples translated from the original SDK. You can view them by selecting “STM32CubeMX Samples” on the top part of the next page. As we are first creating the concentrator project, pick LocalNetwork_Concentrator and press “Next” to continue:
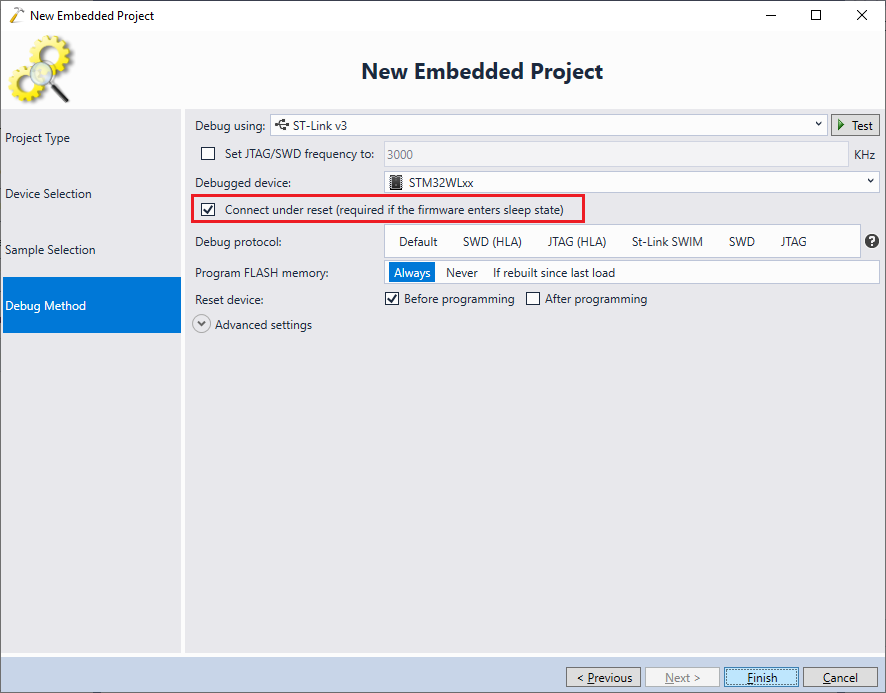
- Connect your board to the USB port and wait for VisualGDB to recognize it. Note that the default firmware that is programmed into the board often enters low-power mode, preventing the debugger from connecting to it. In order to avoid it, make sure you check the “connect under reset” checkbox:
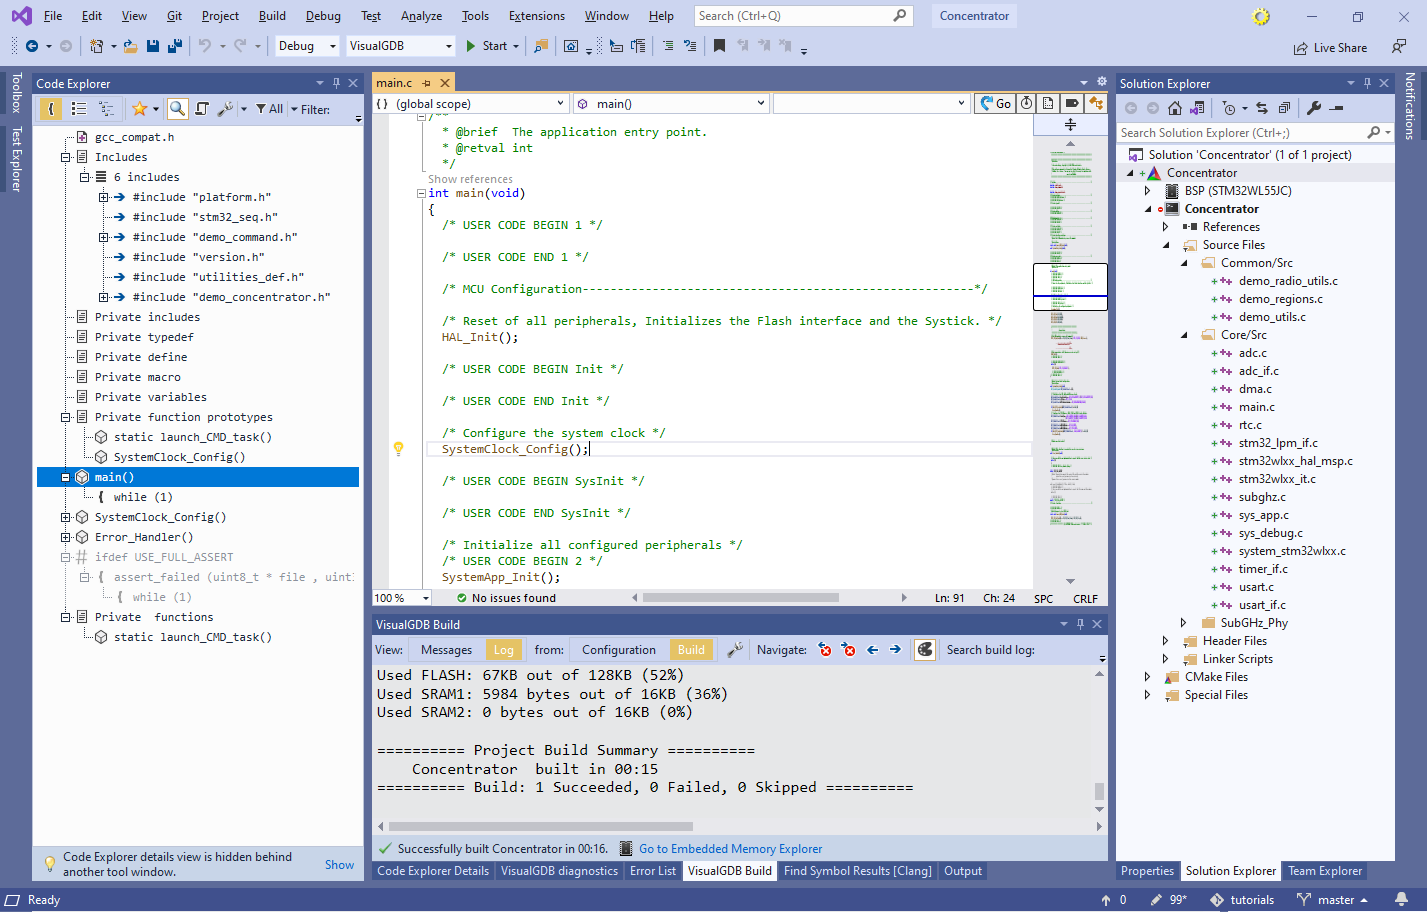
- Press “Finish” to create the project. Once it is created, you can build it by pressing Ctrl-Shift-B:
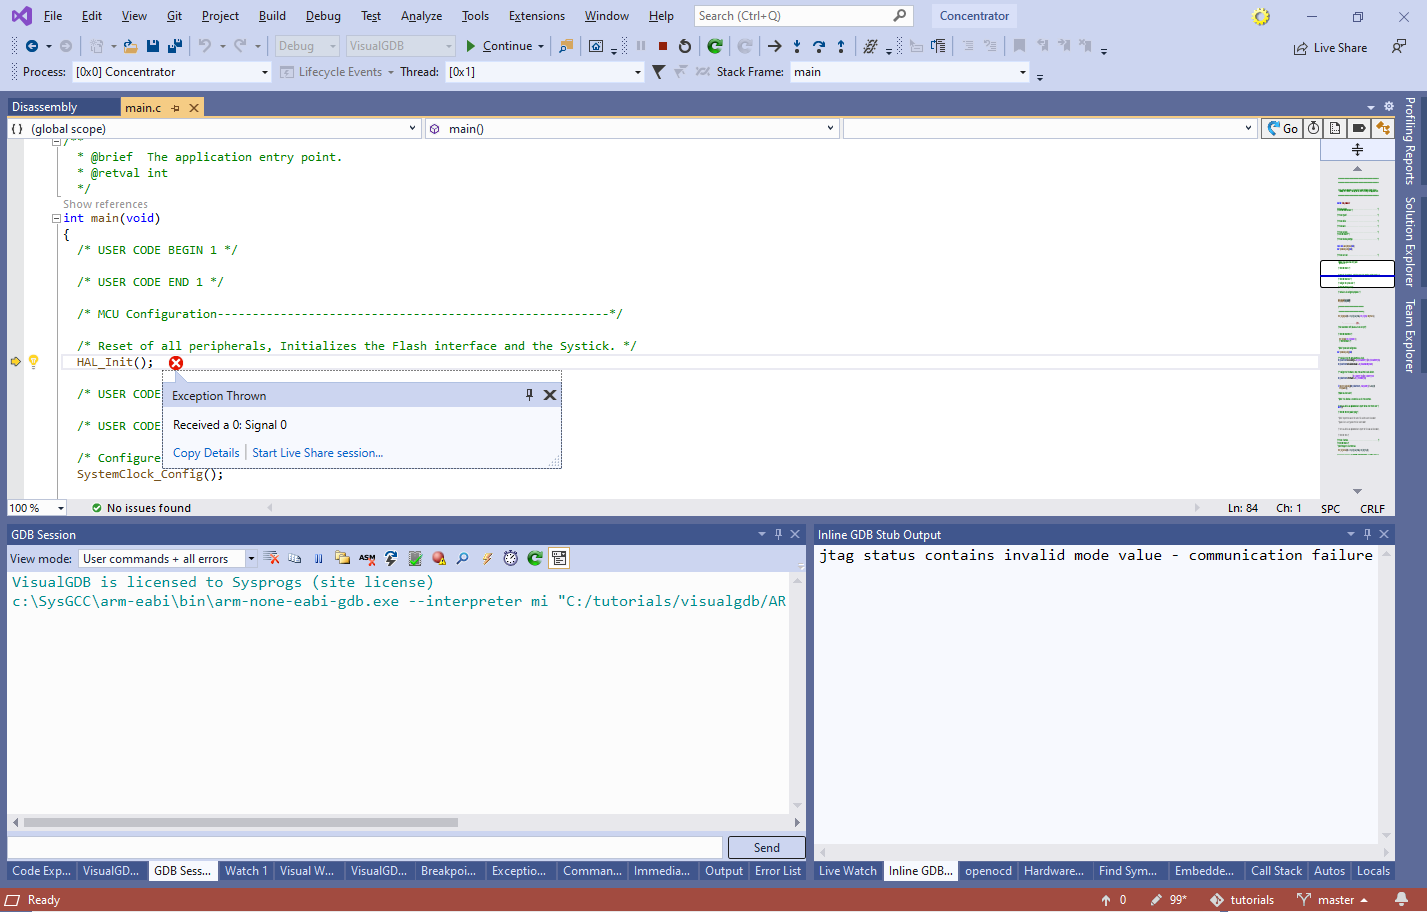
- Try running the project by pressing F5. VisualGDB will show a “Signal 0” in main() and OpenOCD will report a JTAG status error. This actually means that the JTAG/SWD communication with the board was lost after the initial breakpoint in main():
- This happens because the board enters the sleep mode, disabling the debugger-related logic. You can track down the location of this code by switching the Code Explorer to global view, configuring the details to show Outgoing Calls only, pressing the “expand all” button several times, and searching for “sleep”:
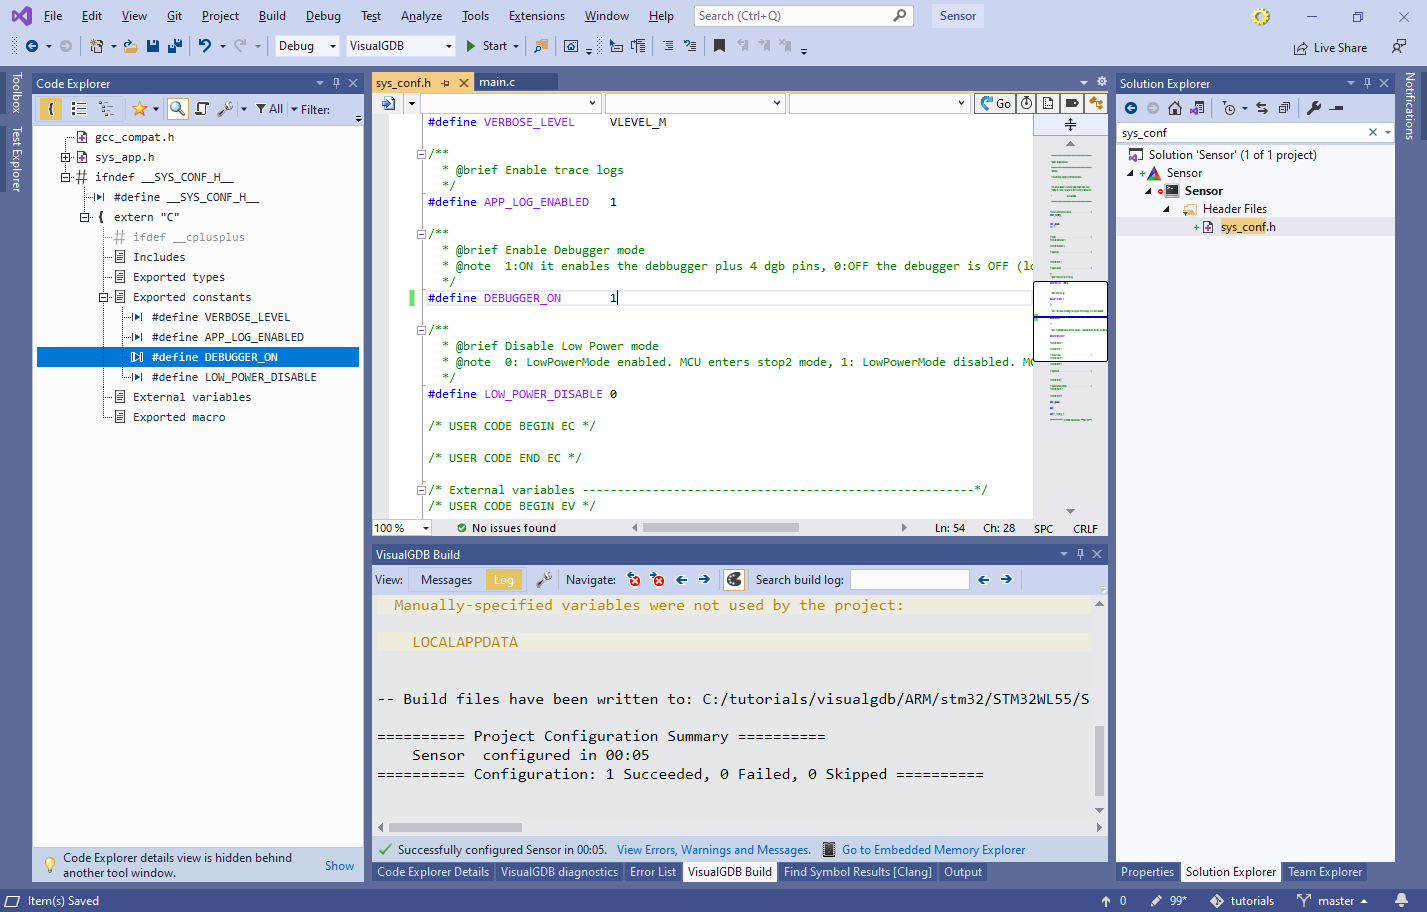
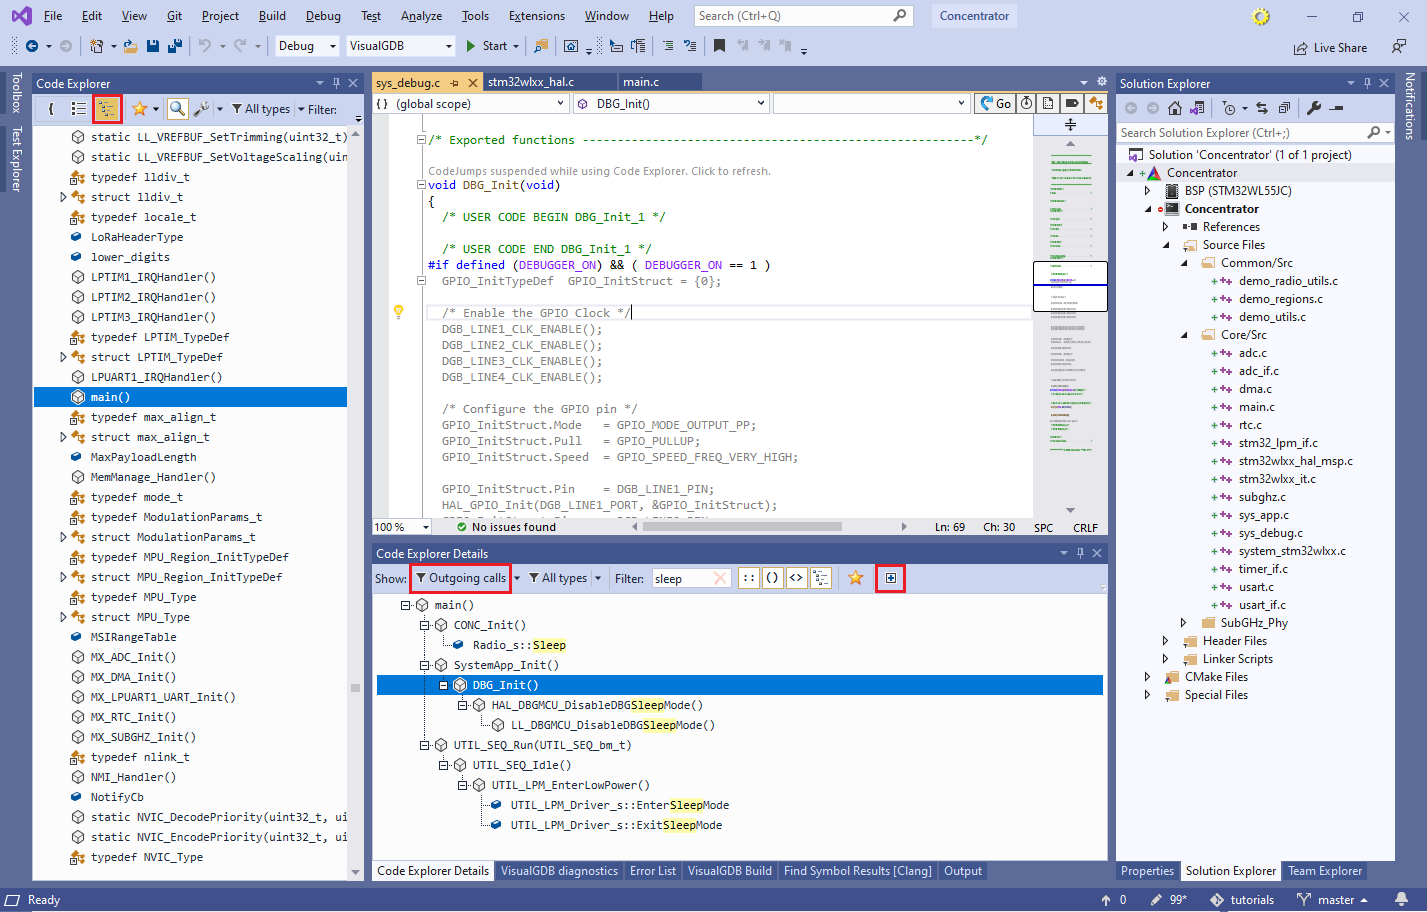 This will point to the DBG_Init() function checking the DEBUGGER_ON macro.
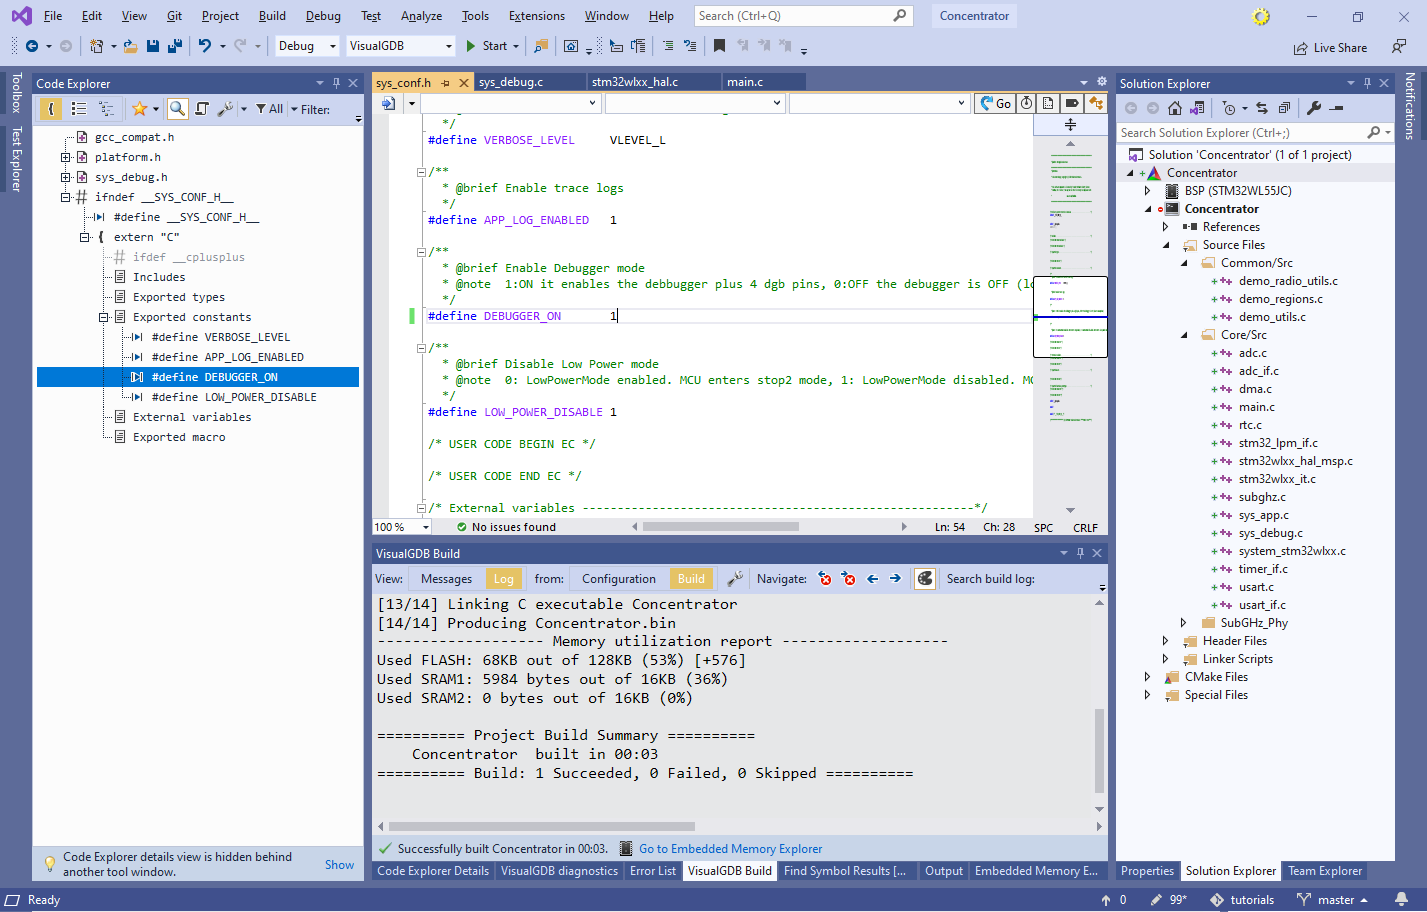
 - Press F12 to go to definition of DEBUGGER_ON and change it from 0 to 1. Note that this will make the compiled firmware bigger and will substantially increase power consumption:
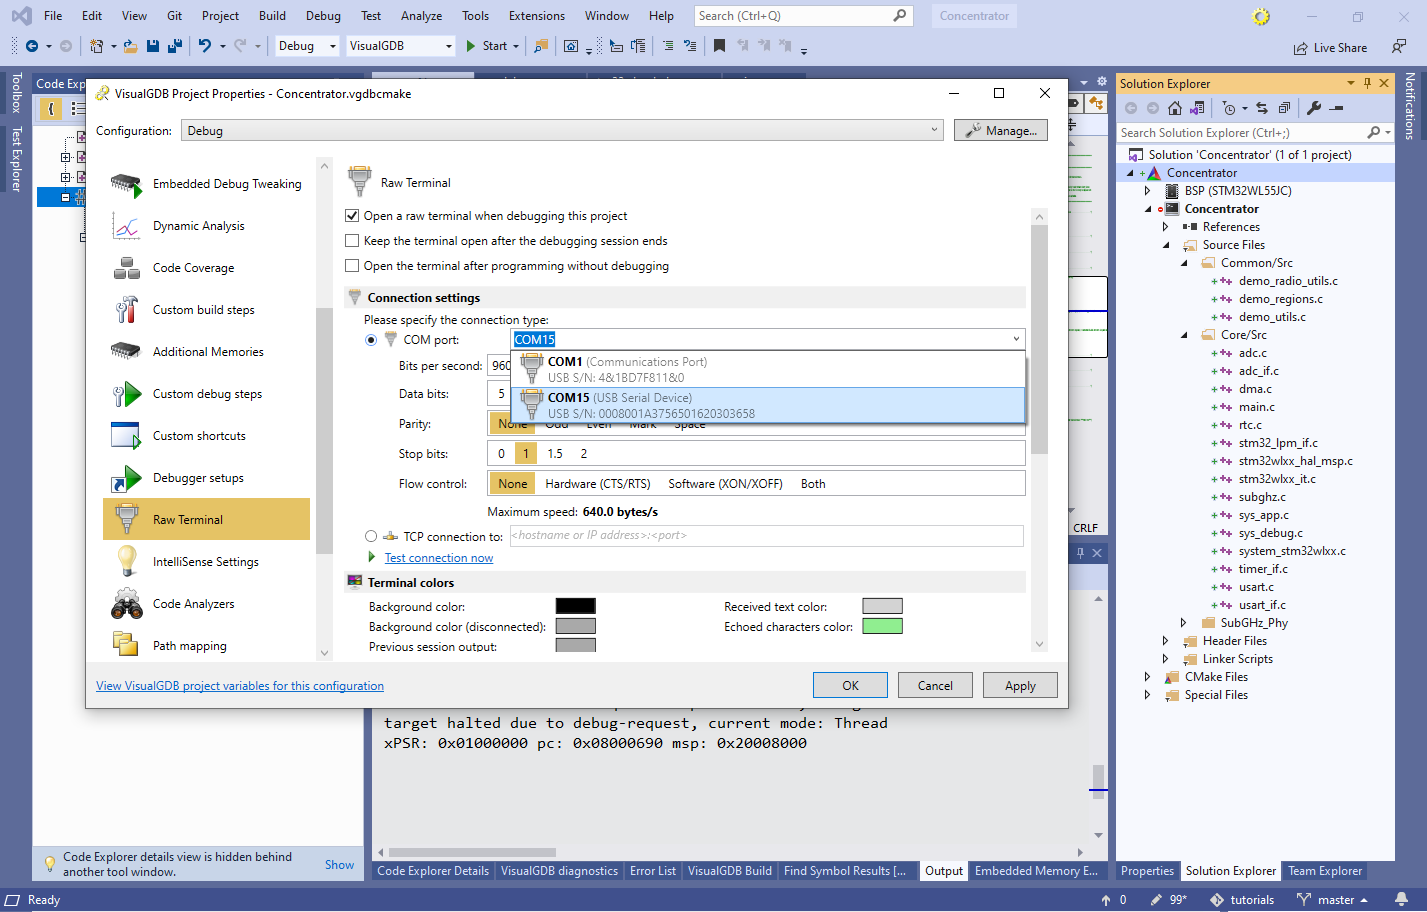
- The Concentrator project will not start sending beacon packets unless you explicitly request it via a COM port. In order to do that, configure the Raw Terminal (requires Custom edition) to connect to the ST-Link port at 9600 bits/second, or use any other terminal program:
- Now you can run the project again, send the “AT+BEACON_ON” command via the COM port and confirm that the board responds with “OK”:
 Warning: in order to comply with your local RF spectrum regulations, you may need to set the device region via a separate AT command. See the readme.txt file from the project directory for more details.
 - Now we will create another project for the second board. Leave the first project running and launch another instance of Visual Studio. Pick the name and location of the second project:
- Select the same project type and the toolchain, but this time pick LocalNetwork_Sensor on the Sample Selection page:
- On the Debug Method page take a note of the serial number of the first board. Then, plug in the second one, and select the newly appeared ST-Link as the debug method:
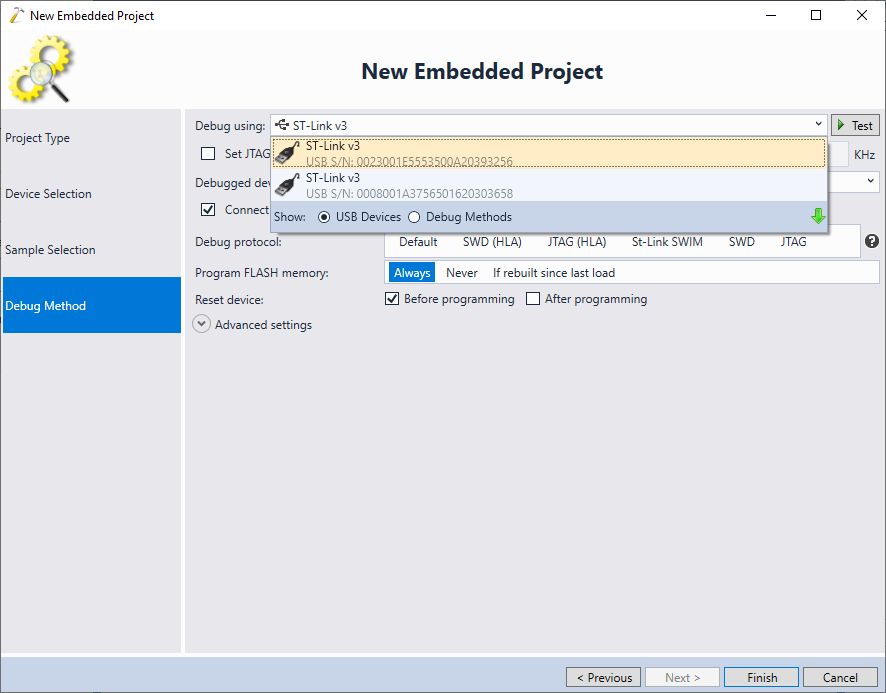 Don’t forget the “Connect under reset” checkbox, as otherwise debugging won’t work!
 - Follow the same steps as before to enable the DEBUGGER_ON macro, then build and run the project:
- The Concentrator project will show a partial AT+RCV message and will stop responding. Press Debug->Break All to see that the code is actually stuck in HardFault_Handler():

- The call stack won’t be very meaningful, indicating a memory corruption error. To track it down, search the source code for “AT+RCV”, and set a breakpoint at a line outputting it. Then, restart the concentrator, issue the initial AT commands, and finally restart the sensor board:
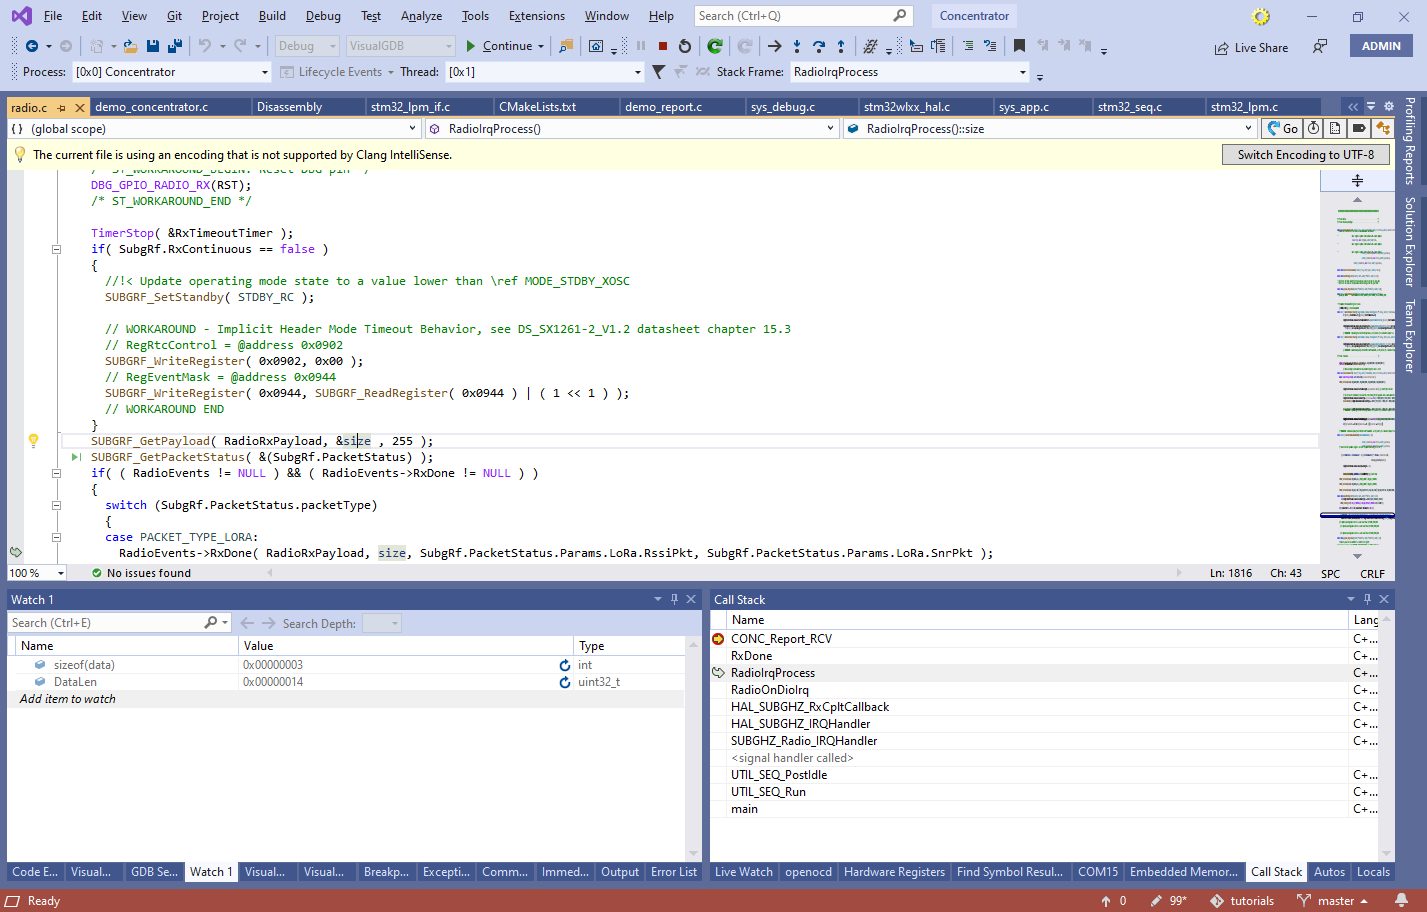
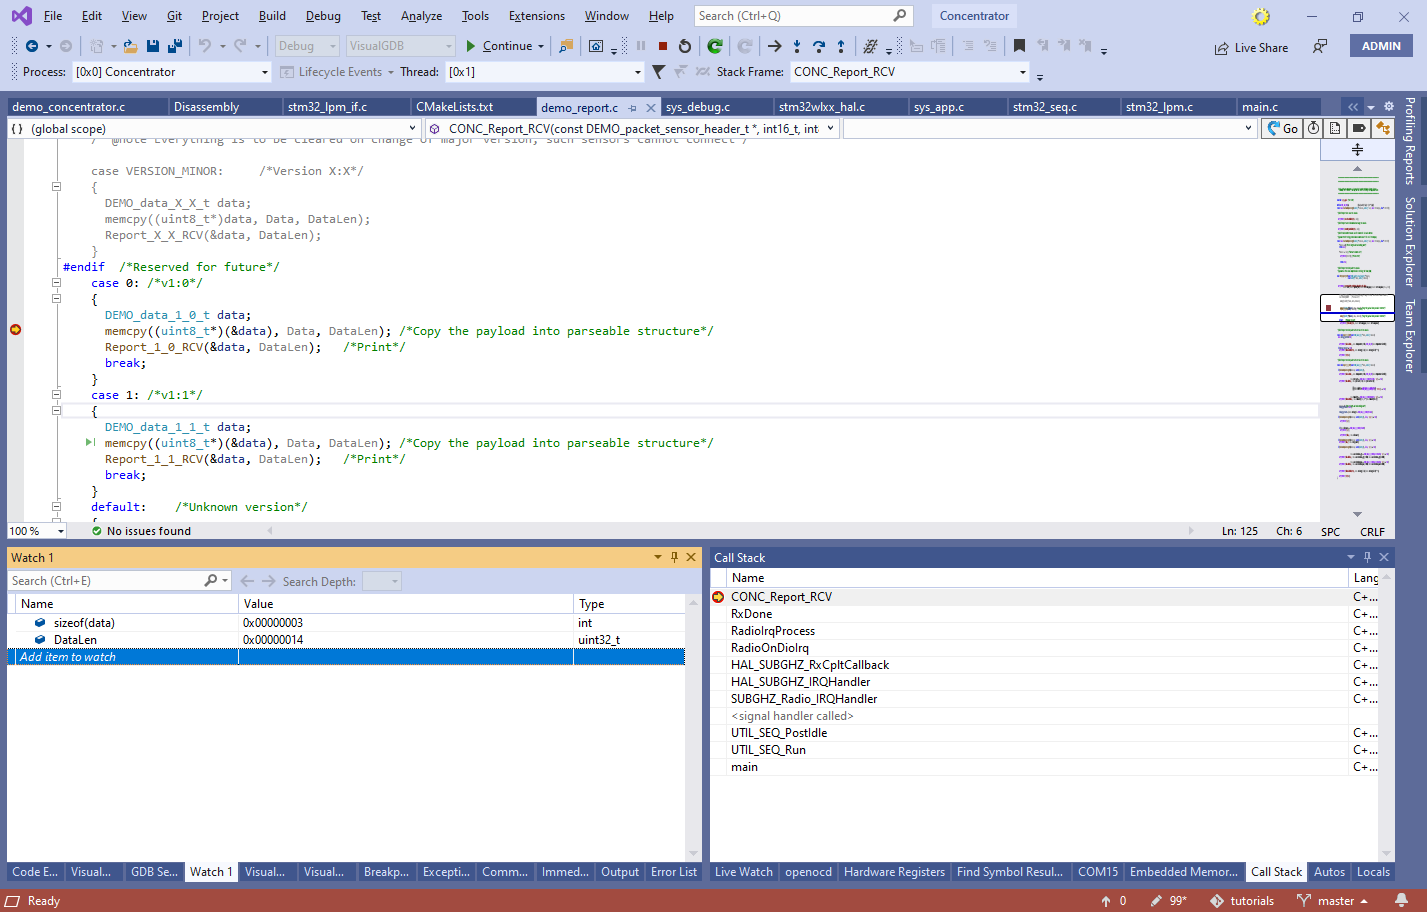 If you step through the CONC_Report_RCV() function that outputs the AT+RCV message, you will notice that it calls memcpy() to set the data variable without verifying the payload size. As of SDK version 1.0, it resulted in trying to copy 20 bytes into a 3-byte variable and overwriting the saved register addresses in the stack.
 - You can use the Call Stack view to find that the value of 20 is derived by subtracting 6 from the payload received via SUBGRF_GetPayload():
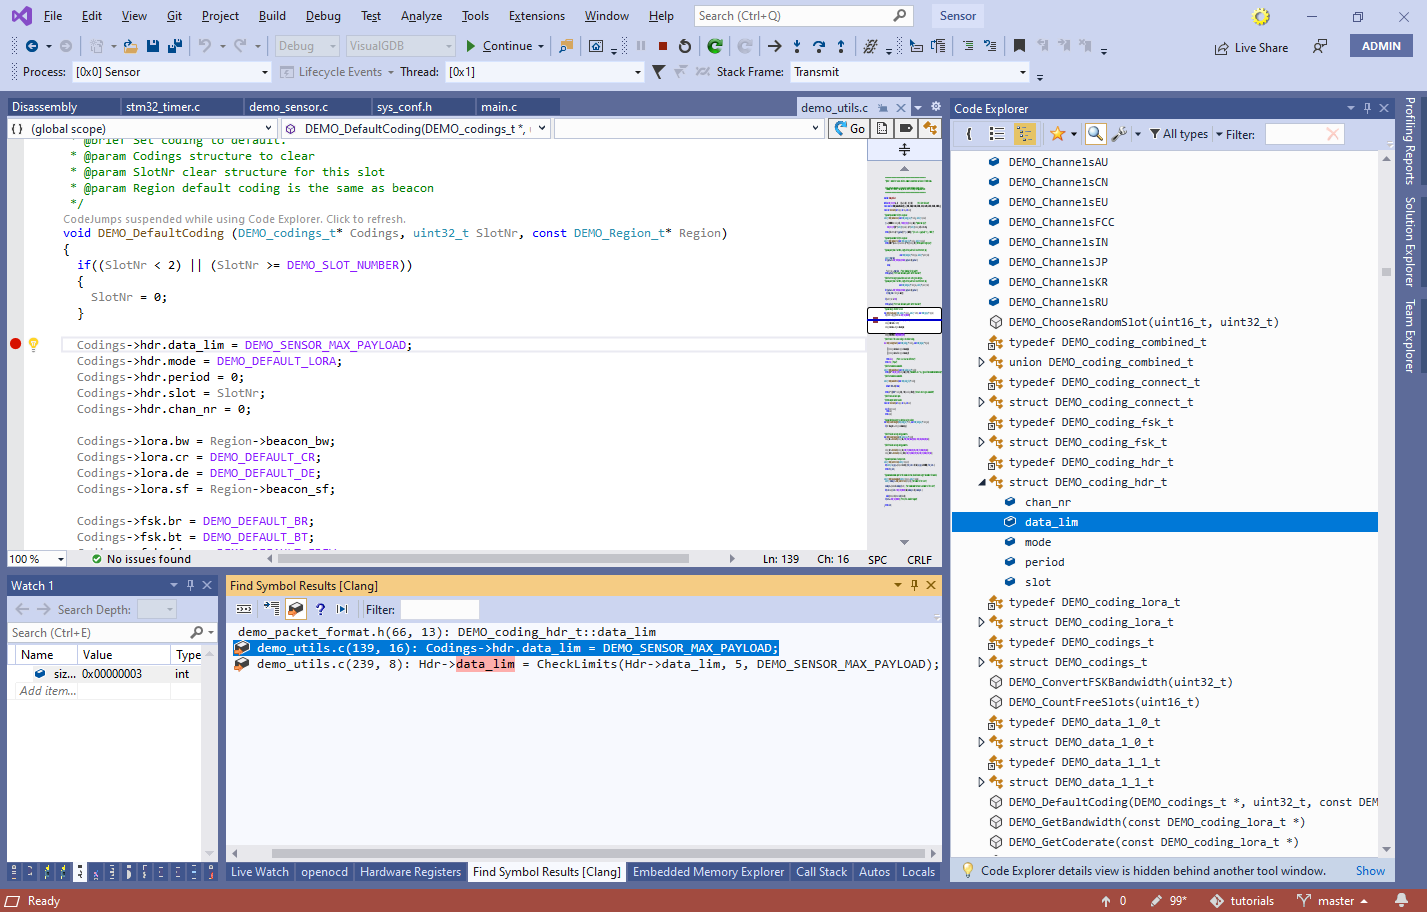
- On the sensor side, this corresponds to the data_lim field that is set to the default value, and is never overwritten. You can use the Find References command (Shift-F12) along with the toolbar buttons in the Find Symbol Results window to quickly show all code locations where a variable is assigned:
- If you set breakpoints at both lines assigning data_lim, the first one will hit as soon as the sensor is ready to send, and the second one will never be triggered:
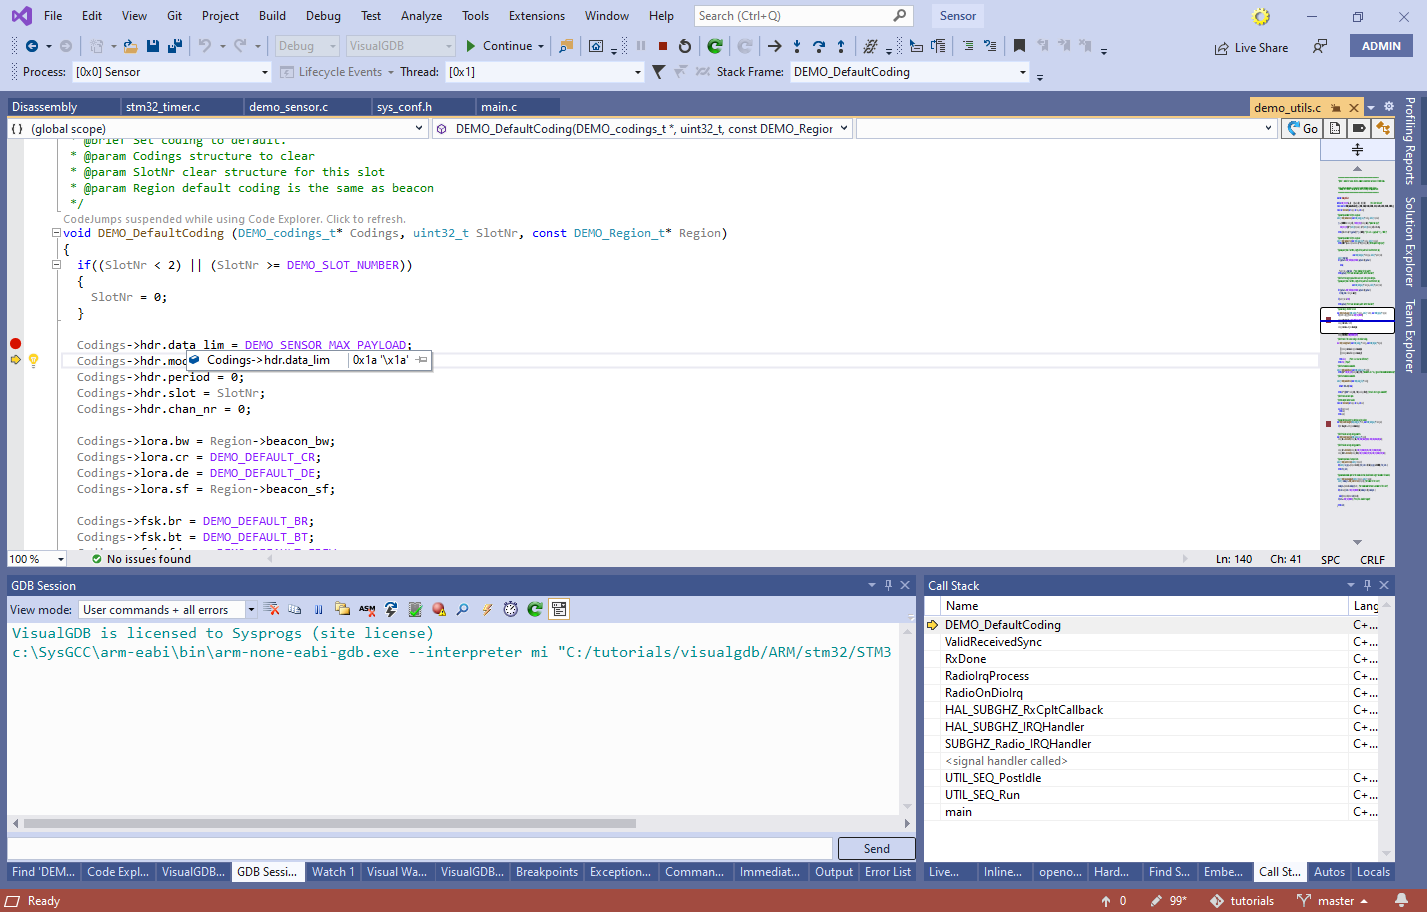 Note that hitting a breakpoint in either of the boards disrupts the board timing and breaks communication between them. We will give an overview of non-intrusive debugging methods that will work in this case at the end of the tutorial.
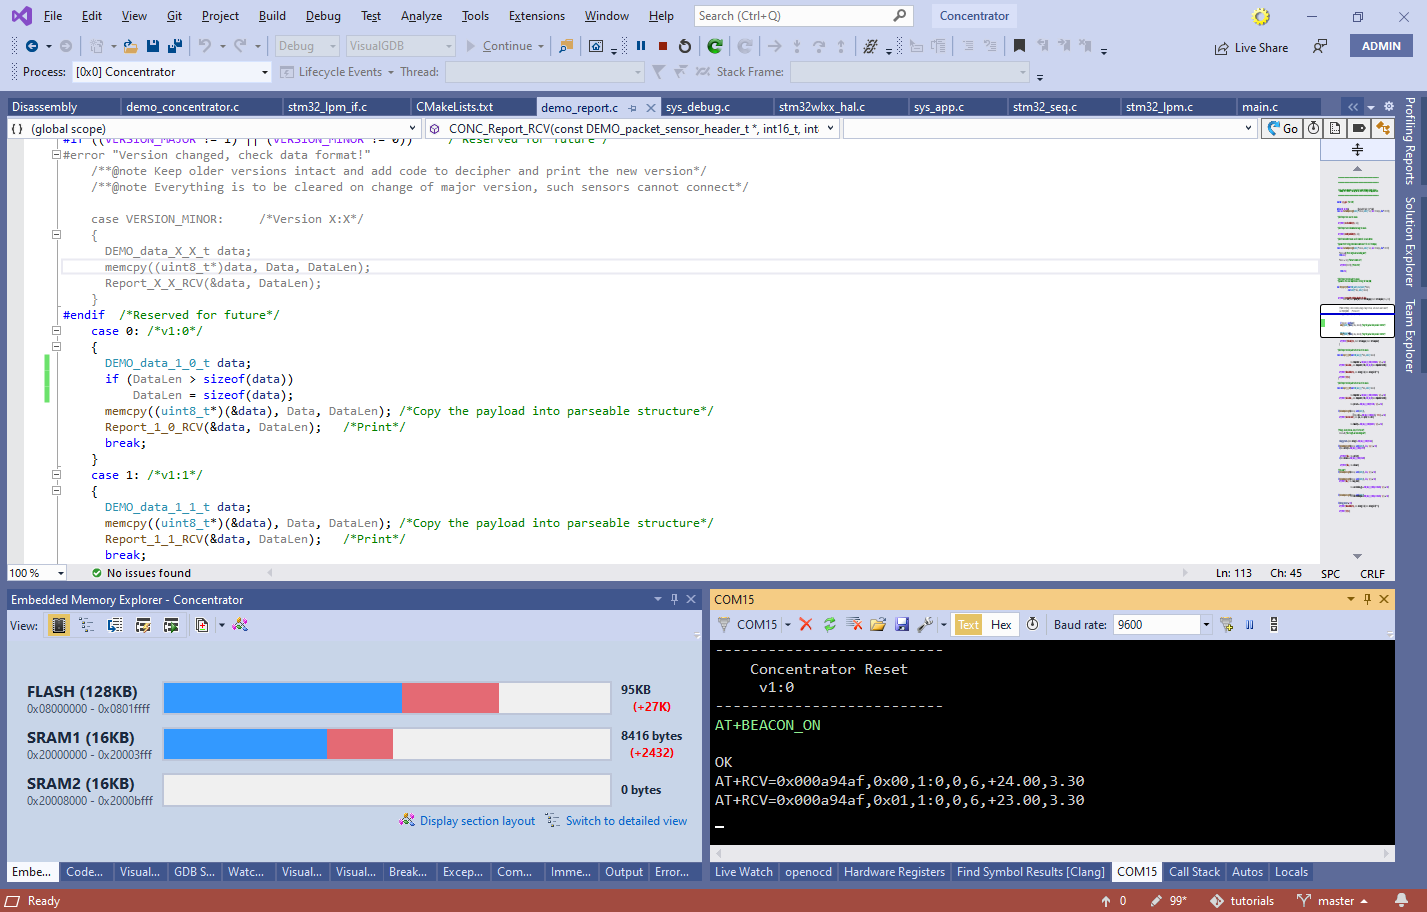
 - The easiest way to fix the concentrator crash would be to add a size check just before the faulty memcpy() call:
      if (DataLen > sizeof(data))
          DataLen = sizeof(data);
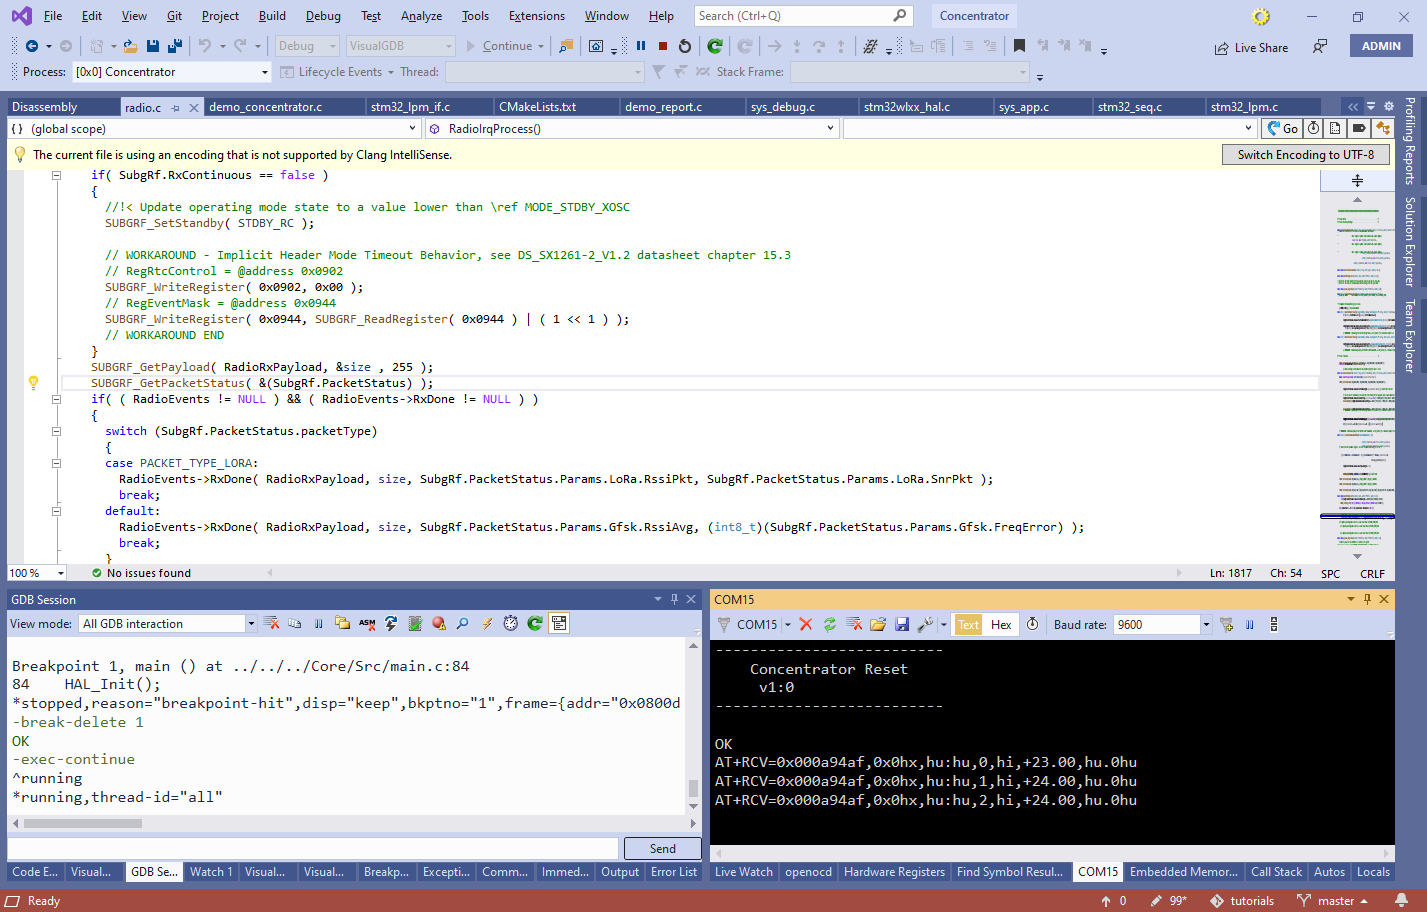
Now you can restart the concentrator again, run the AT commands, start the sensor and confirm that multiple sensor packets are being received successfully:
- Note that default project parameters suggested by VisualGDB do not support the “%hhu” specifier in sprintf(). You can fix it by changing the C library type from Newlib-Nano to Default via VisualGDB Project Properties:
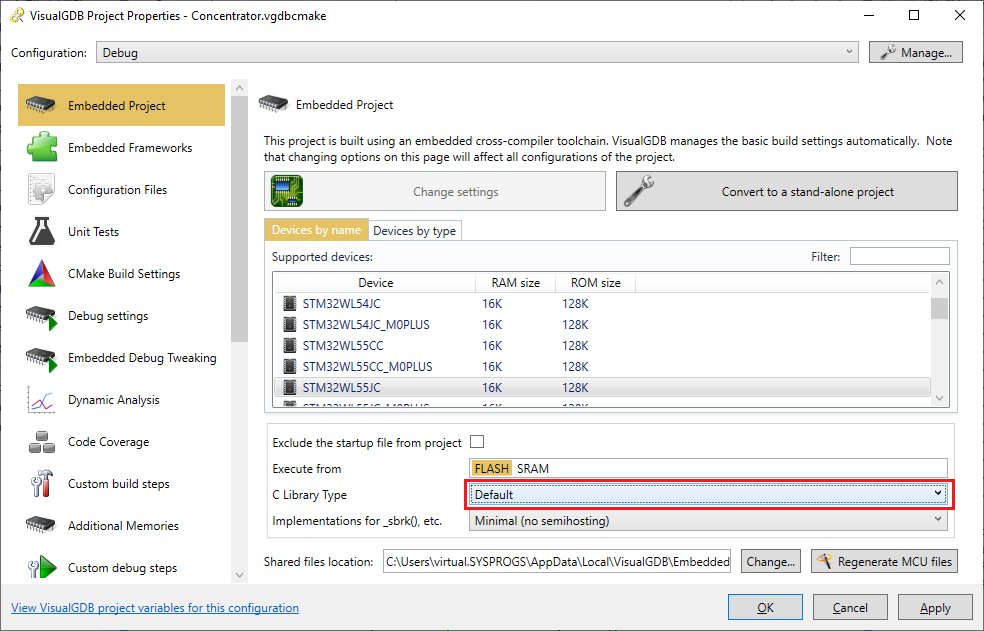
- This will correct the output from AT+RCV at a cost of increasing the FLASH and RAM use:
Note that many wireless applications are critical to timing, so stopping the code at a breakpoint is likely to break the communication. As an alternative to breakpoints, consider the following non-intrusive debugging techniques:
- Live Watch for watching and graphing variable values (e.g. packet counters)
- Real-time watch with custom events for tracking precise events
- Live Code Coverage for viewing the running code paths in real time
- Fast semihosting as a faster alternative to the COM port
- Test Resource Manager for creating binary dump files on your development computer directly from the STM32 code
You can find the source code shown in this tutorial in our GitHub repository.