Debugging the ESP32-LyraT board via JTAG
This tutorial shows how to debug the ESP32-LyraT board using a JTAG debugger with VisualGDB.
We will clone the play_mp3_control sample, program it into the FLASH memory via JTAG and use the debugger to understand the relations between different parts of the example and the ESP-ADF framework.
Before you begin, install VisualGDB 5.4 or later, get a compatible JTAG debugger (e.g. Olimex ARM-USB-OCD-H or Segger J-Link), enable the JTAG via the on-board jumpers and connect the JTAG-related pins to a JTAG20 cable as shown below: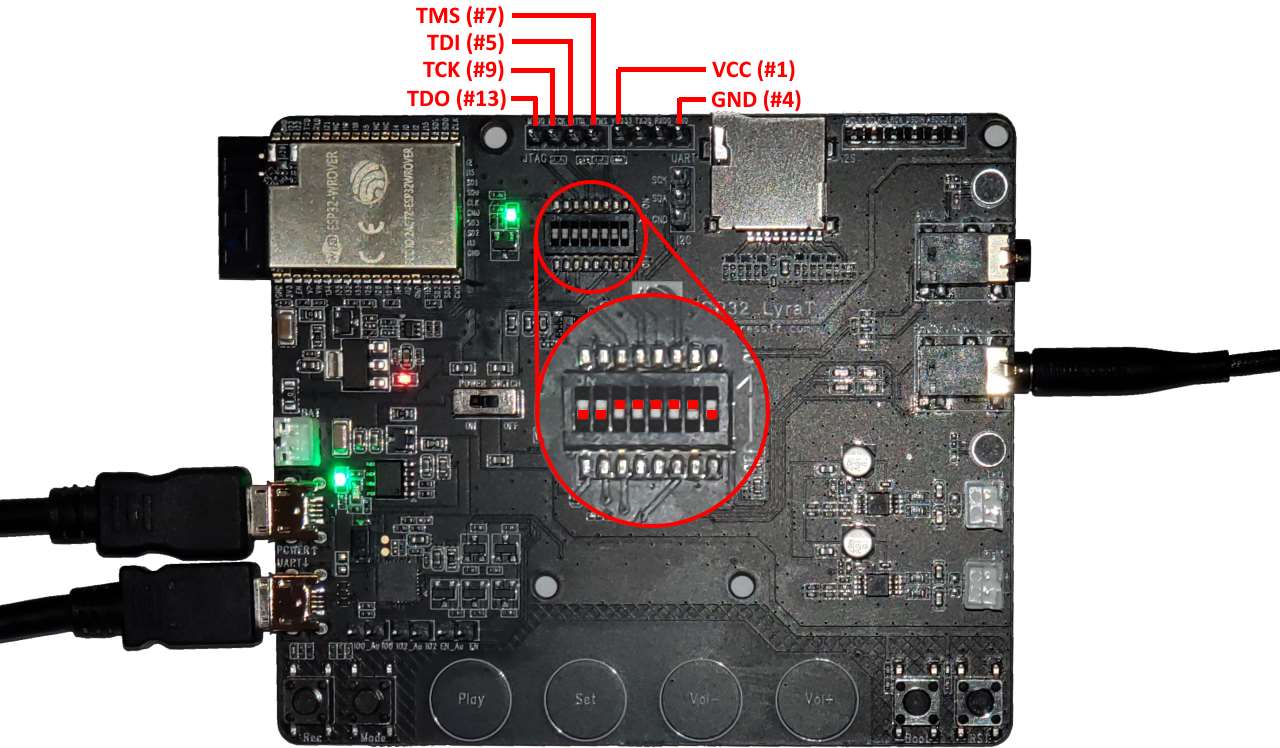 The final setup including the board and the JTAG programmer should look similar to this:
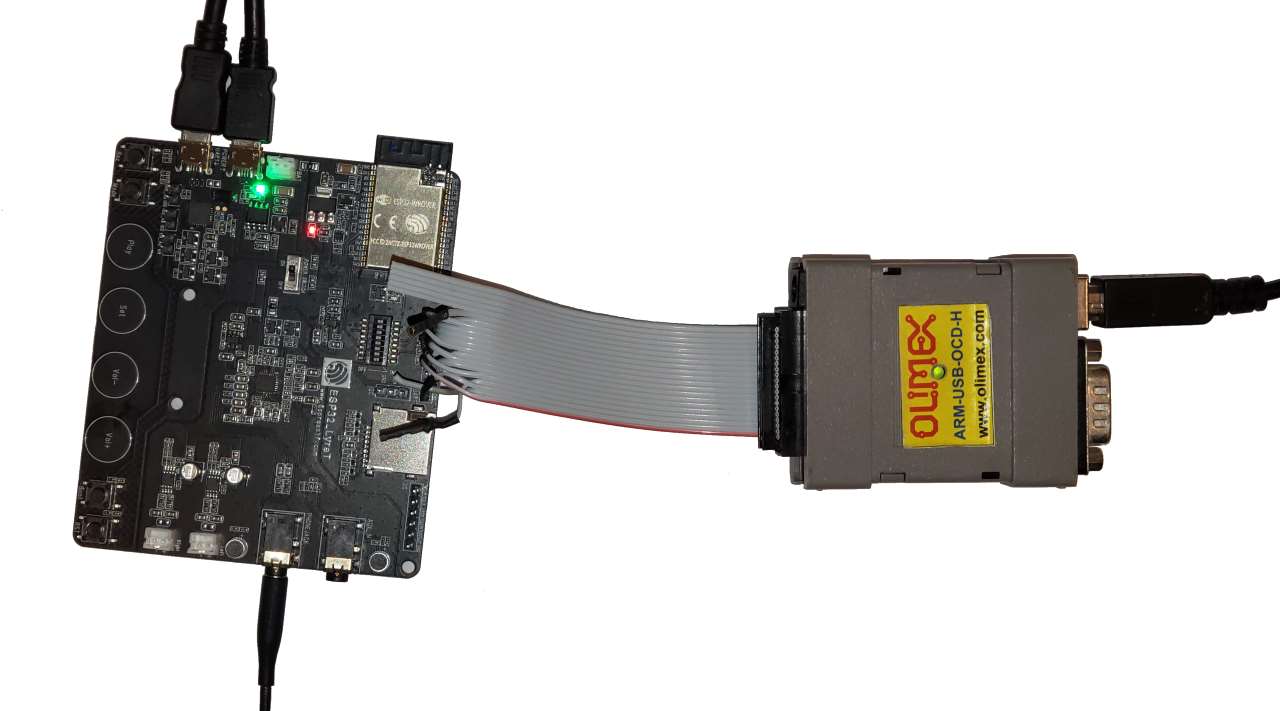 Now we are ready to create a basic project and begin debugging it:
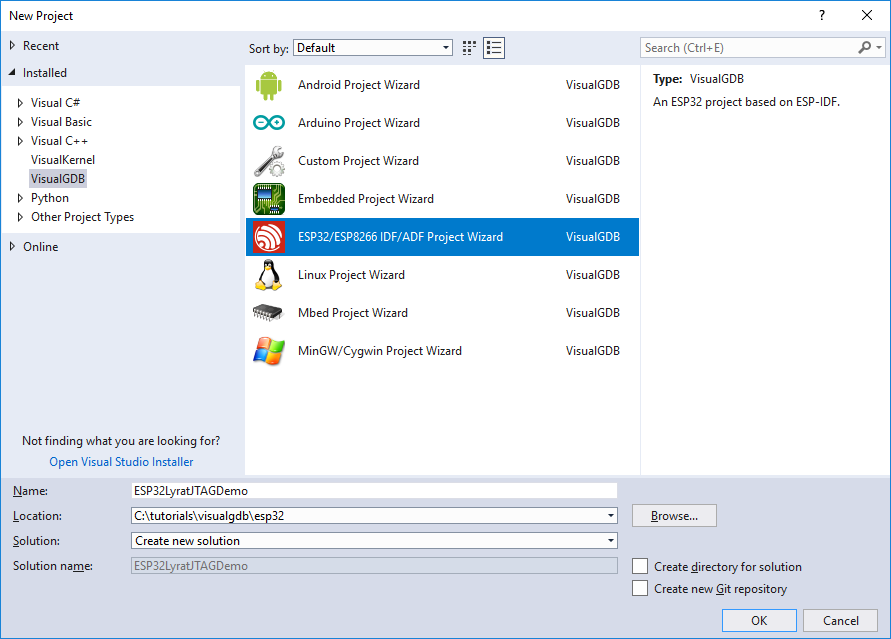
- Start Visual Studio and open the VisualGDB ESP-IDF/ESP-ADF project wizard:
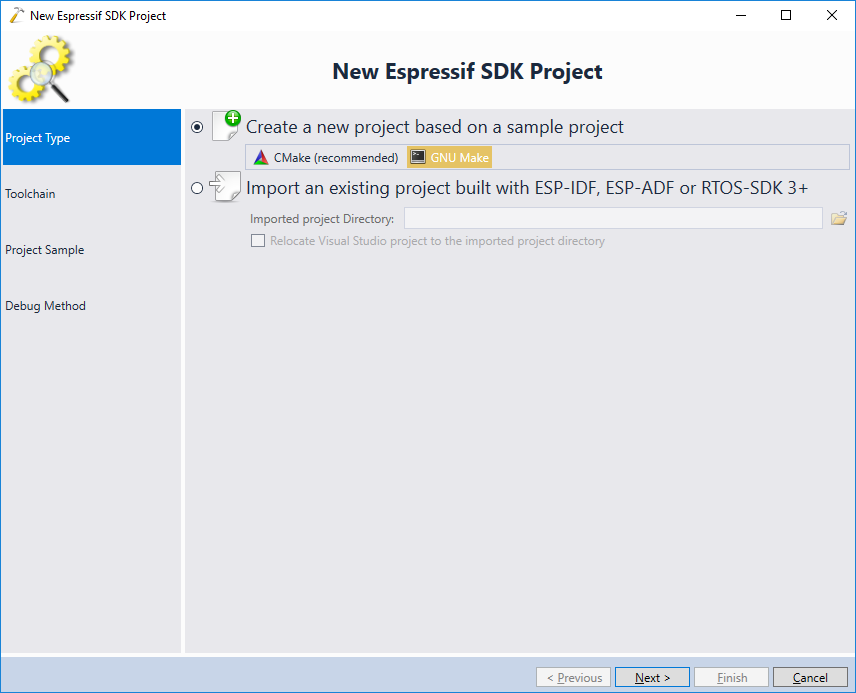
- On the first page of the wizard select the GNU Make build subsystem, as it is the only build subsystem supported by the ESP-ADF framework:
- On the next page select your ESP32 toolchain and the ESP-ADF checkout. If you have not created ESP-ADF projects before, follow our ESP-ADF tutorial to import the ESP-ADF framework into VisualGDB:
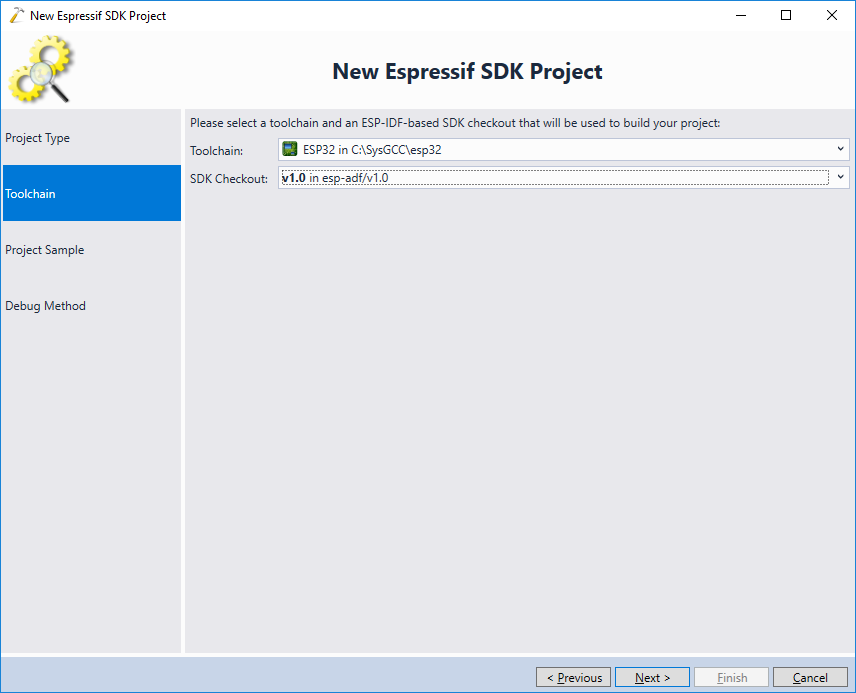 Update: For better compatibility with the latest ESP32 tools, we recommend selecting the consolidated toolchain instead.
 - On the next page of the wizard select the play_mp3 example under get-started:
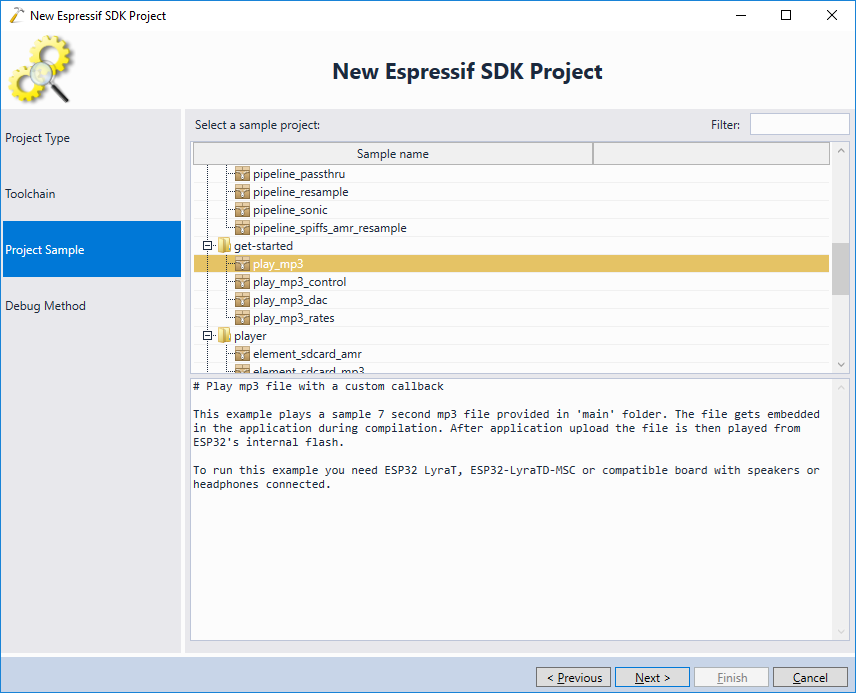 Warning: do not select the play_mp3_control example, as it uses GPIO pins that make JTAG debugging impossible.
 - Ensure both the board and the JTAG debugger are plugged into USB and select your debugger on the Debug Method page of the VisualGDB’s project wizard:

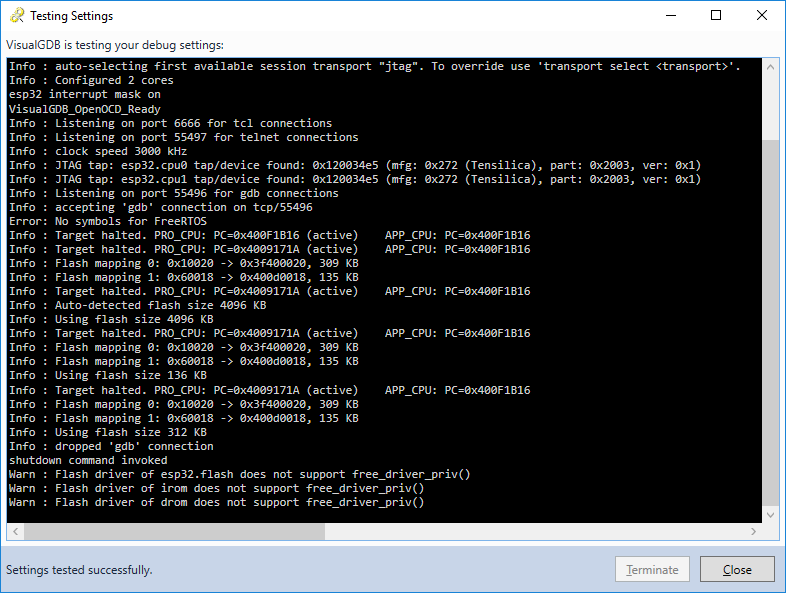
- Press the “Test” button to test the wiring and ensure that the JTAG programmer can communicate to the ESP32 chip:
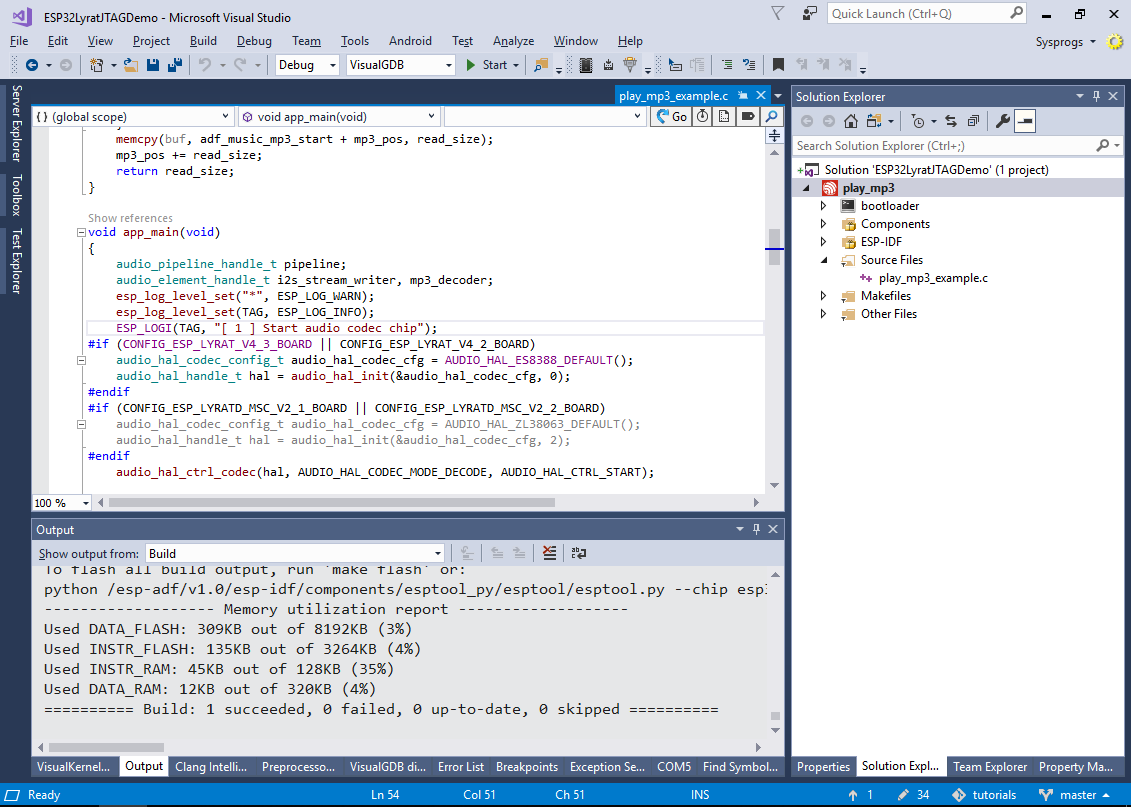
- Finally, press “Finish” to create the project and build it via Build->Build Solution:
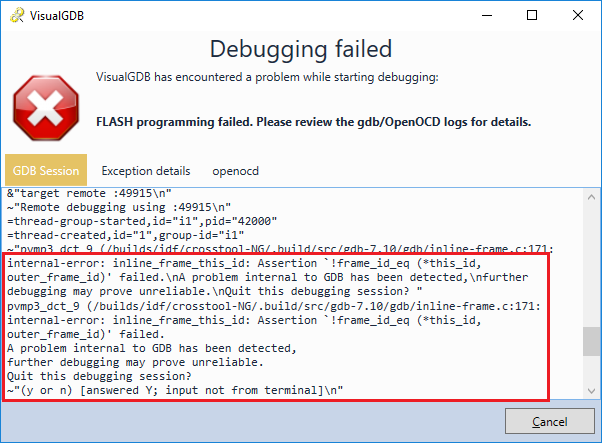
- Once the build succeeds, set a breakpoint in app_main() and start debugging by pressing F5. Note that the previous firmware programmed into the FLASH memory might trigger an internal error in the Espressif’s port of GDB:
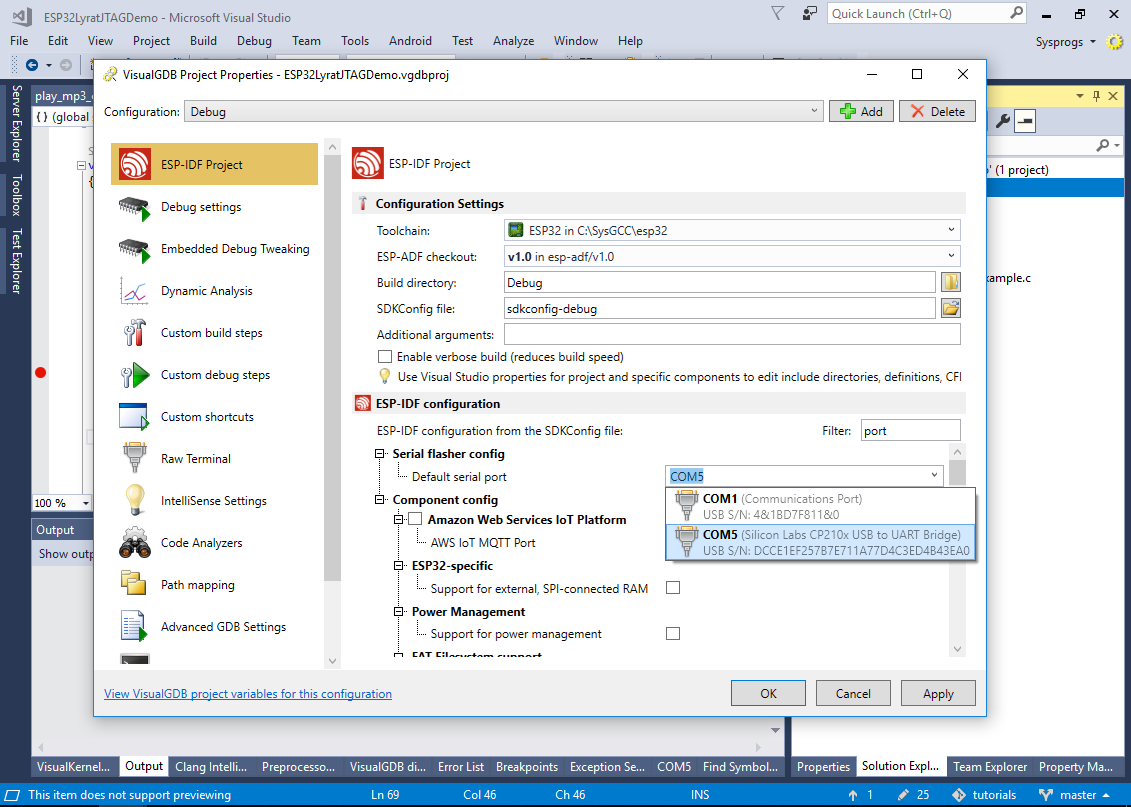
- If this happens, try programming the FLASH memory using the COM port. First, select it via VisualGDB Project Properties -> ESP-IDF Project -> ESP-IDF configuration -> Default serial port:
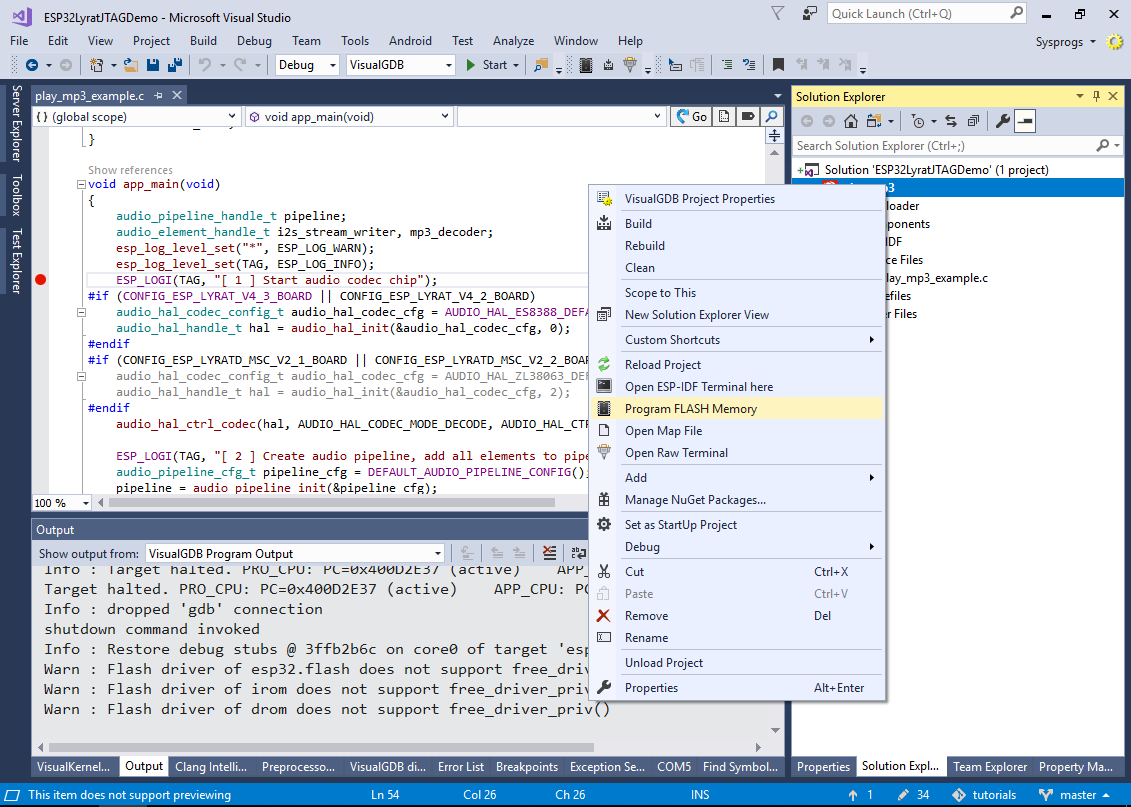
- Then right-click in Solution Explorer and select “Program FLASH memory”:
 Once the new firmware is programmed, reset the board by pressing the RST button and the further FLASH programming via JTAG should work as expected.
 - Set a breakpoint inside the app_main() function and hit F5 to begin debugging. Once VisualGDB finishes programming the FLASH memory and the breakpoint hits, step through the app_main() function to see the main tasks performed in it:
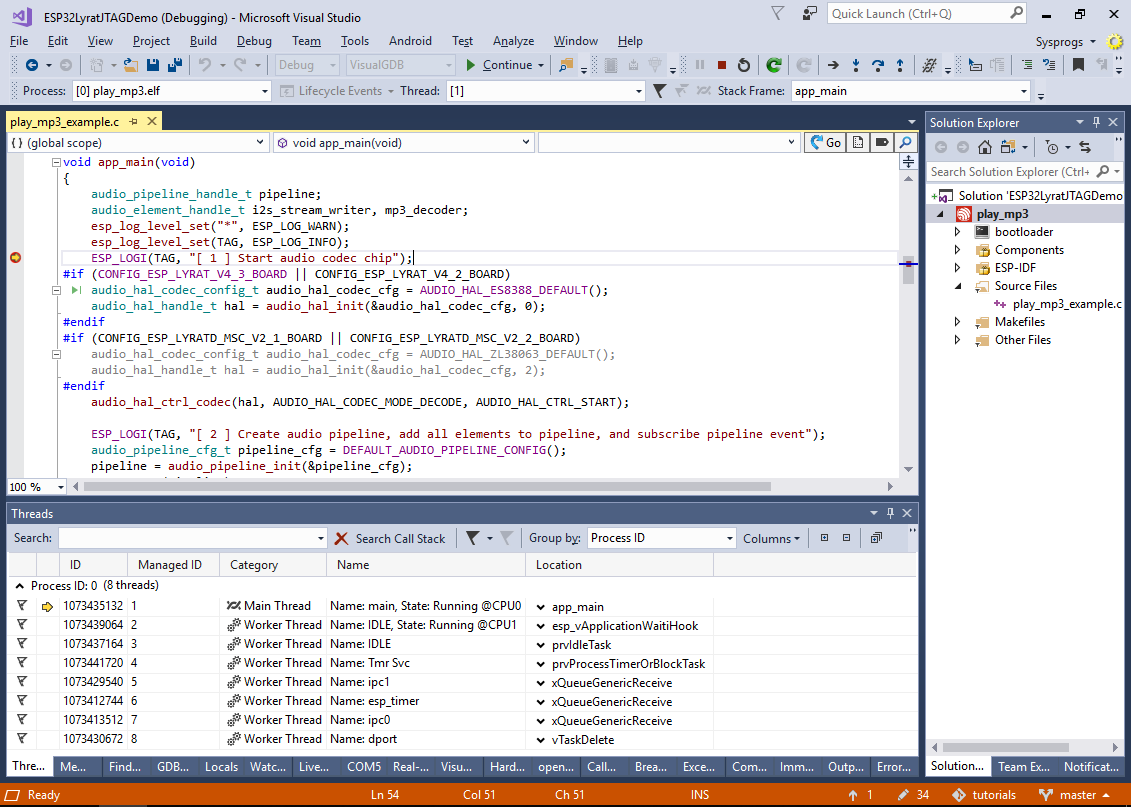 The app_main() function in the play_mp3 example performs the following tasks:
- Creates a new audio pipeline by calling audio_pipeline_init().
- Creates an mp3 decoder with a custom callback function to the pipeline (mp3_decoder_init()).
- Creates an I2S stream writer (is2_stream_init()) that will output the decoded waveforms to an I2S codec.
- Adds the created objects to the pipeline and links them together (audio_pipeline_register() and audio_pipeline_link()).
- Starts the pipeline by calling audio_pipeline_run().
- Set a breakpoint in the mp3_music_read_cb() function that is called by the mp3 decoder to read the mp3 stream, then resume the program and wait for the breakpoint to hit:
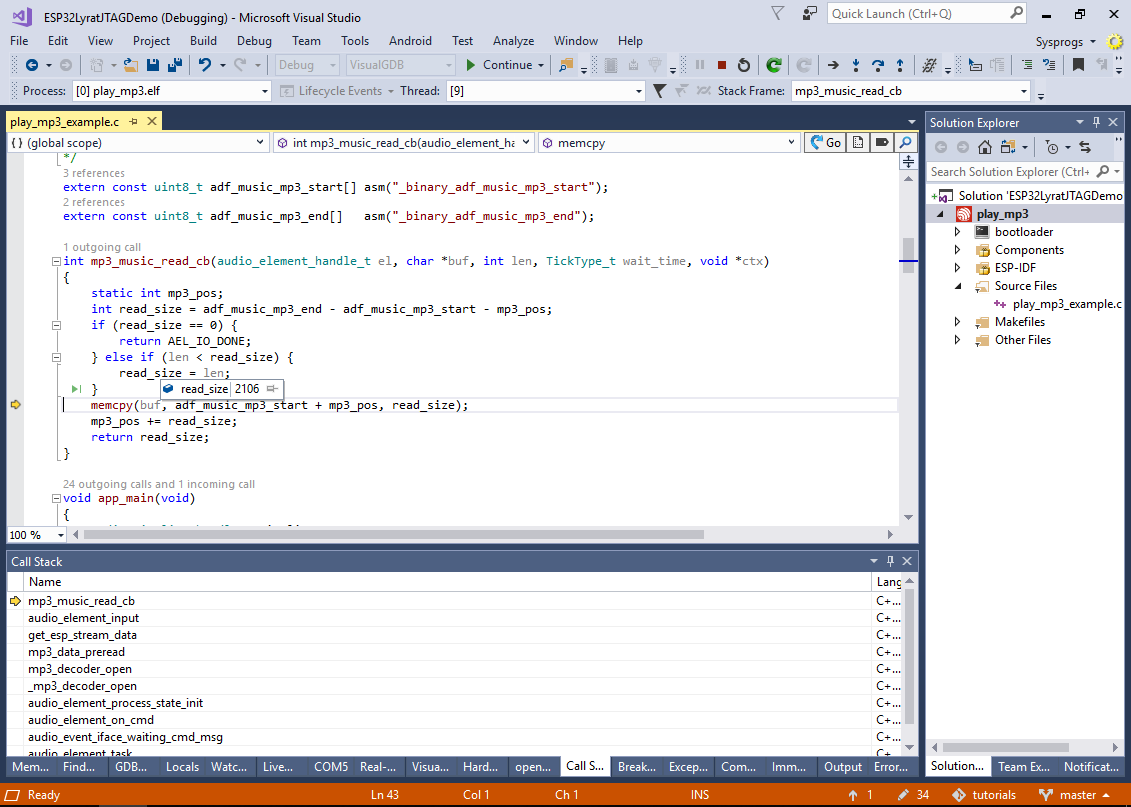 Note how the mp3_music_read_cb() function simply copies the data from the mp3 file in the FLASH memory to the buffer provided by the caller (audio_element_input()) .
 - Set a breakpoint in app_main() after the call to audio_element_getinfo() and wait for it to trigger:
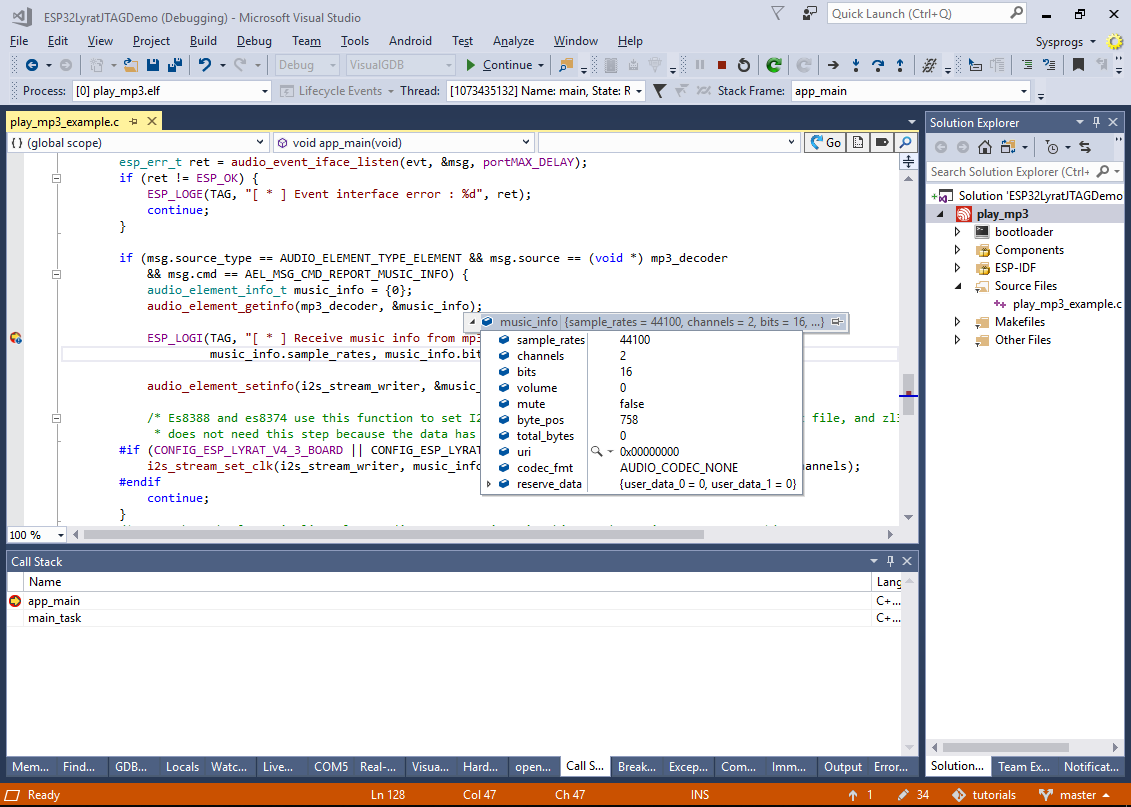 Note how the mp3 decoder has sent an AEL_MSG_CMD_REPORT_MUSIC_INFO message with the details on the decoded mp3 stream and the app_main() function received it by calling audio_event_iface_listen().