Using Azure RTOS with STM32 Devices and VisualGDB
This tutorial shows how to create, build and debug a basic project using the Azure RTOS (ThreadX) running on an STM32 device with Visual Studio and VisualGDB.
Before you begin, install VisualGDB 5.6R3 or later.
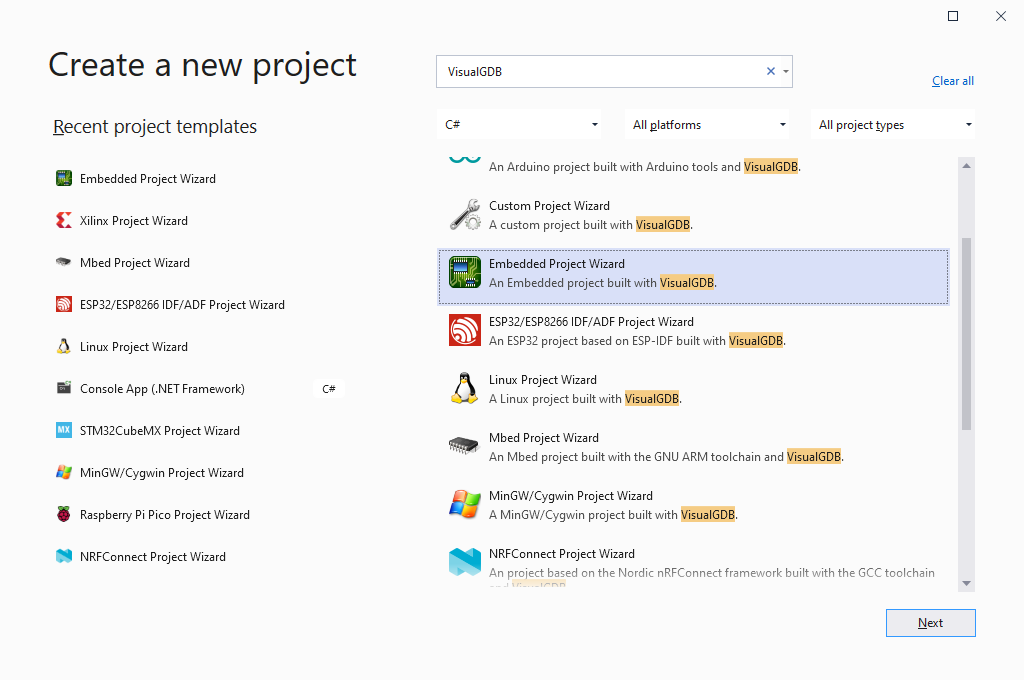
- Start Visual Studio, click “File->New Project” and locate the VisualGDB Embedded Project Wizard:
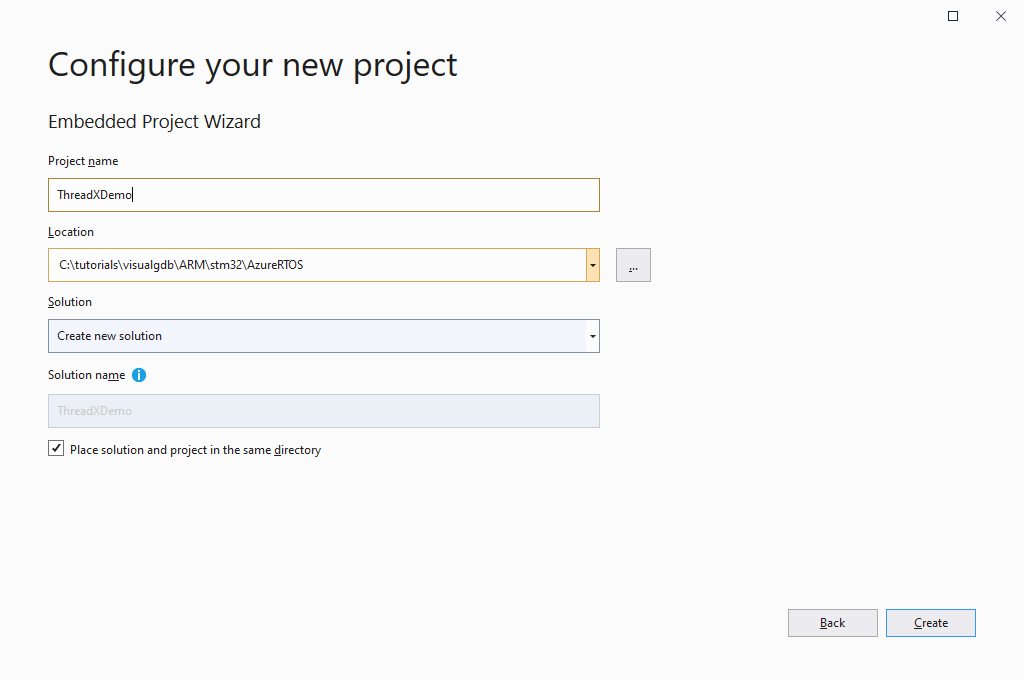
- Enter the name and location for the newly created project, then click “Create” to proceed to the VisualGDB-specific part of the wizard:
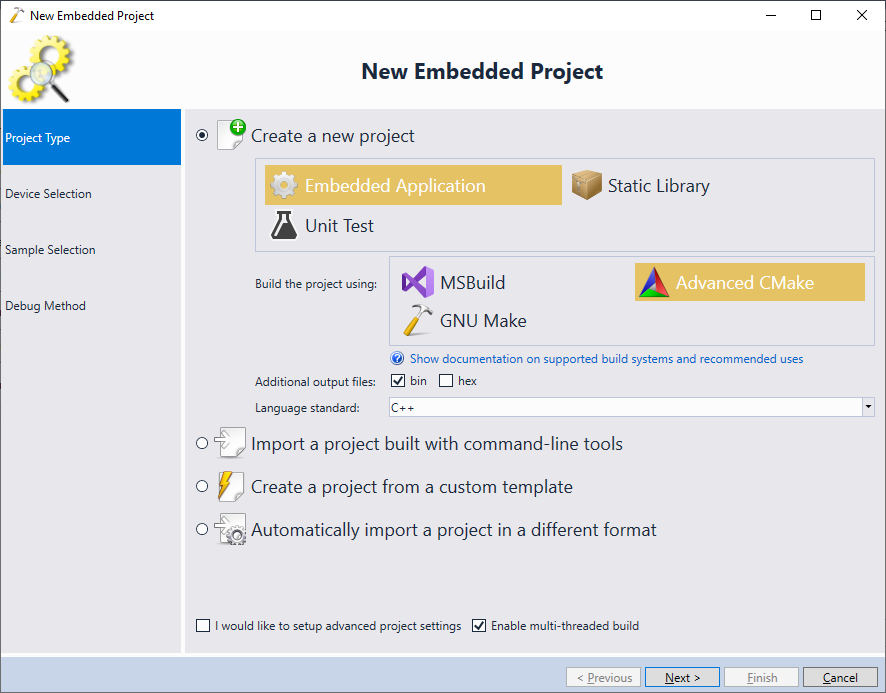
- Proceed with the default settings on the “Project Type” page. We recommend using the Advanced CMake project subsystem for the best results:
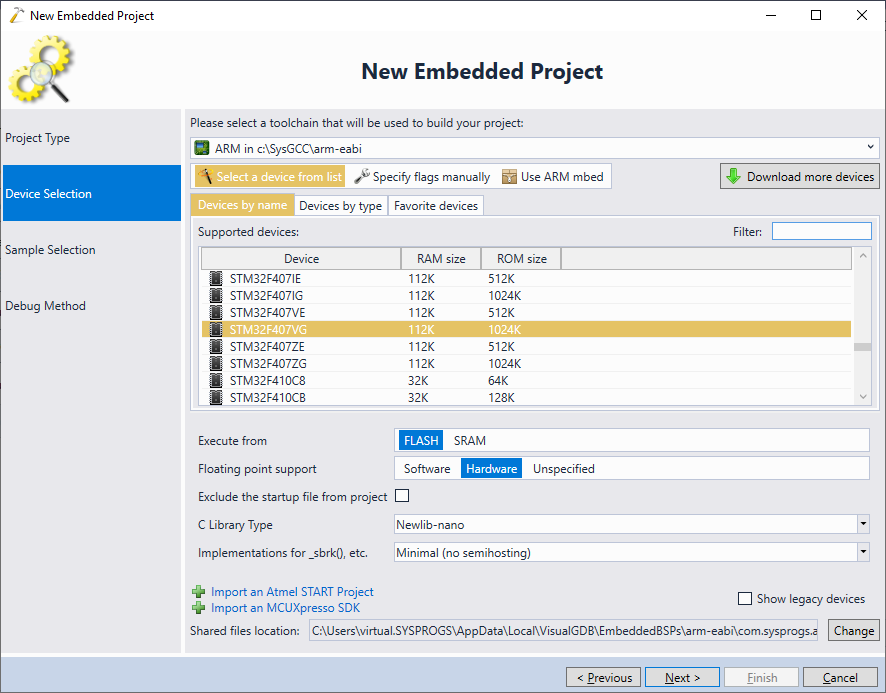
- On the next page select the ARM toolchain and pick the device you would like to use:
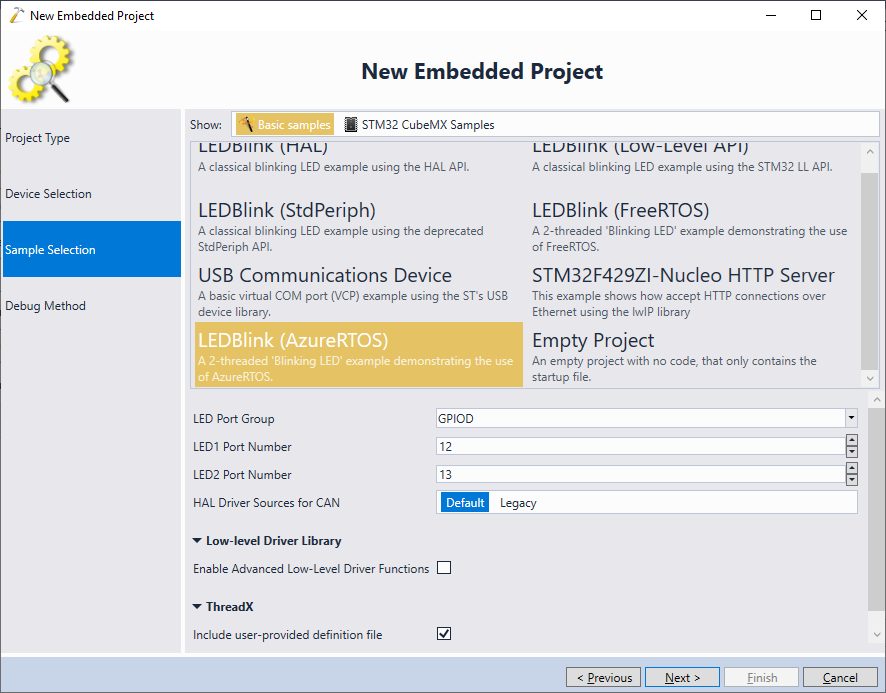
- On the sample selection page, pick the “LEDBlink (AzureRTOS)” sample. It uses the same structure as the FreeRTOS-based sample, creating 2 independent threads, each one controlling one LED. You can configure the LED port/pins to match your board pinout, or simply proceed with the default values:
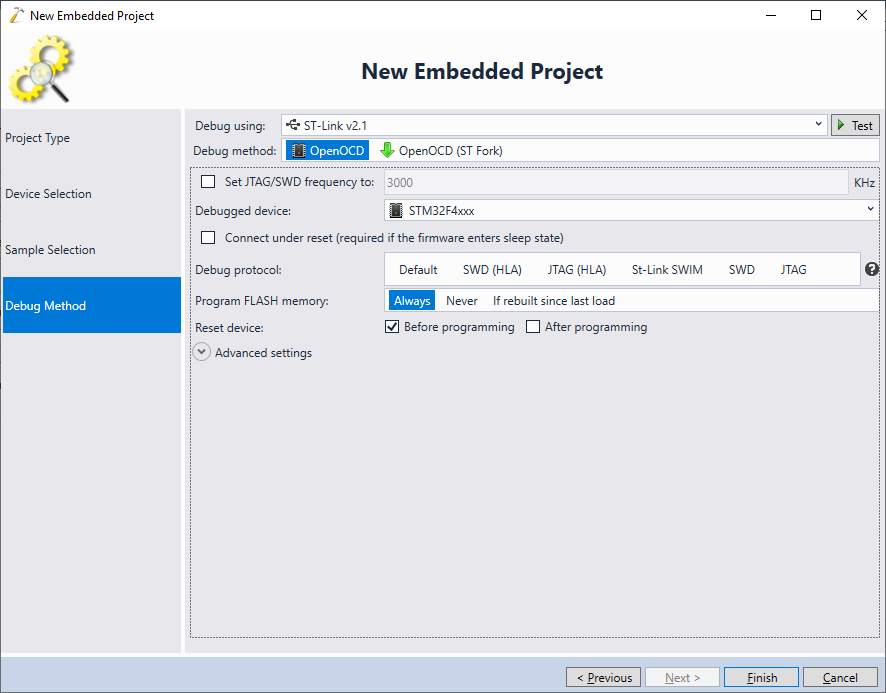
- On the last page of the wizard, pick the debug settings that work with your board and click “Finish” to create the project:
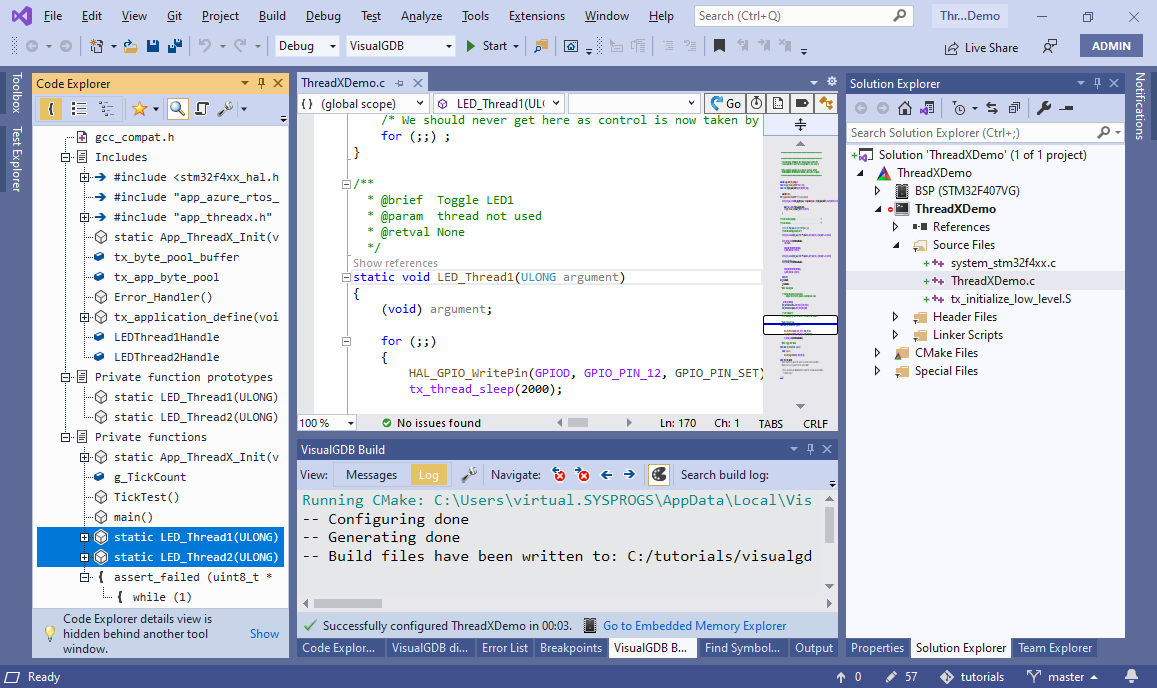
- Once the project has been created, locate the main source file. Note how it contains one function for each thread (LED_Thread1 and LED_Thread2). You can use Code Explorer to conveniently view the outline of a specific source file, or look through the symbols in the entire project:
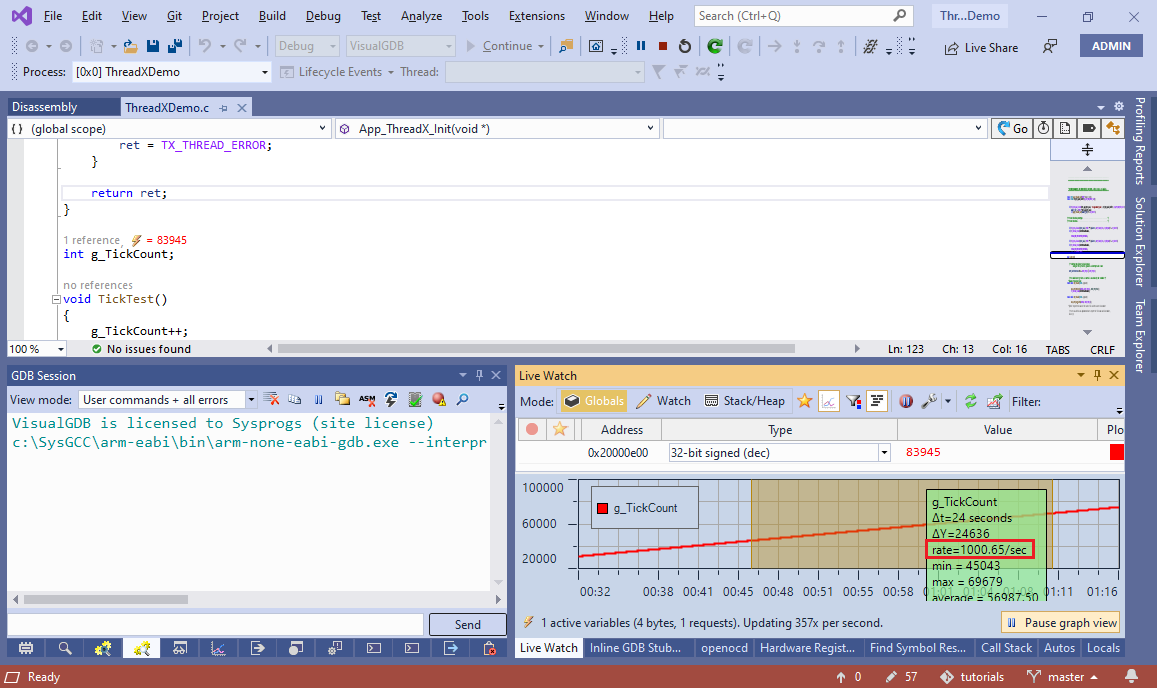
- Press F5 to build the project and start debugging it. If you have configured the correct LED ports/pins in the wizard, you will see the LEDs blink. If not, you can confirm that the program is running by locating the g_TickCount variable in Live Watch:

- Pause the graph view in Live Watch and check the rate at which g_TickCount is incremented. It should be close to 1000 ticks per second:
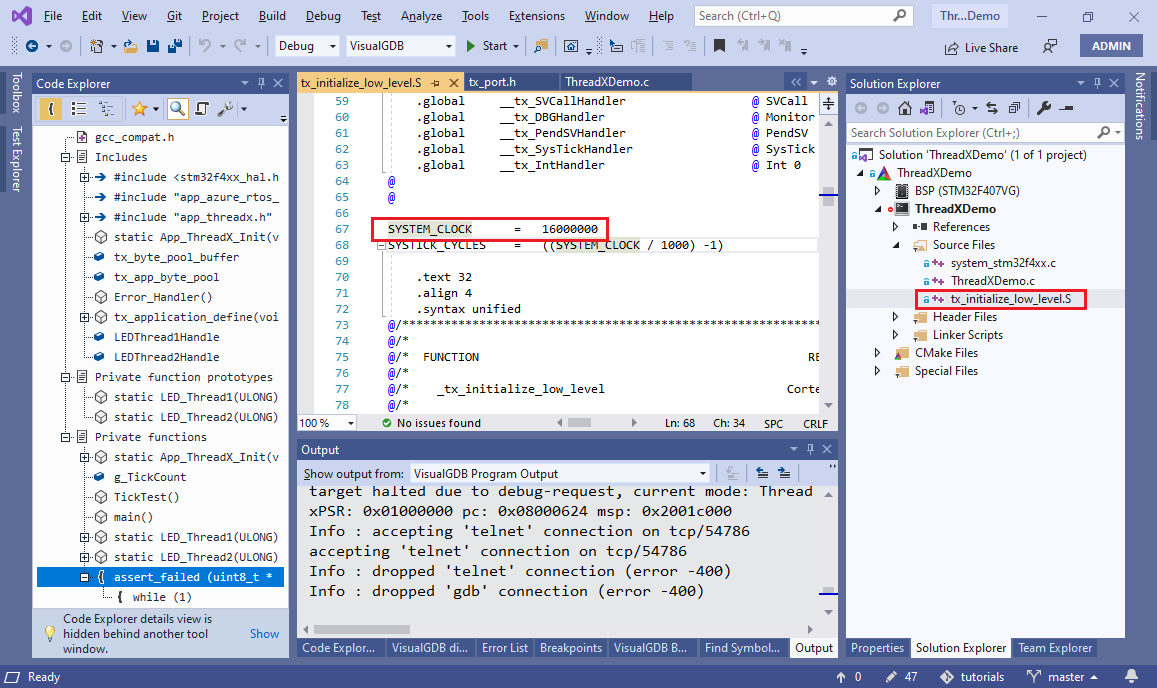
- If the observed timer frequency is different, adjust the SYSTEM_CLOCK variable in the tx_initialize_low_level.S file to match the clock frequency of your board:
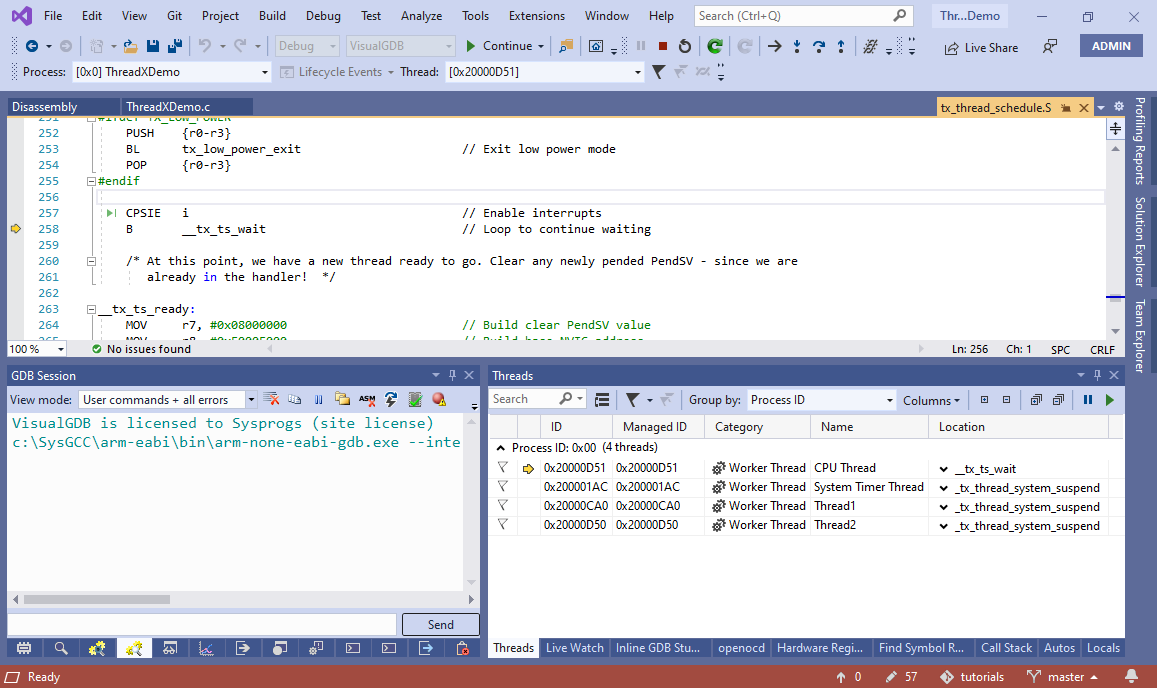
- Use the Debug->Break All command to force the program to stop (alternatively, simply set a breakpoint in one of the thread functions). VisualGDB will automatically recognize and display the ThreadX threads using our open-source ThreadX plugin (requires the Custom edition or higher):
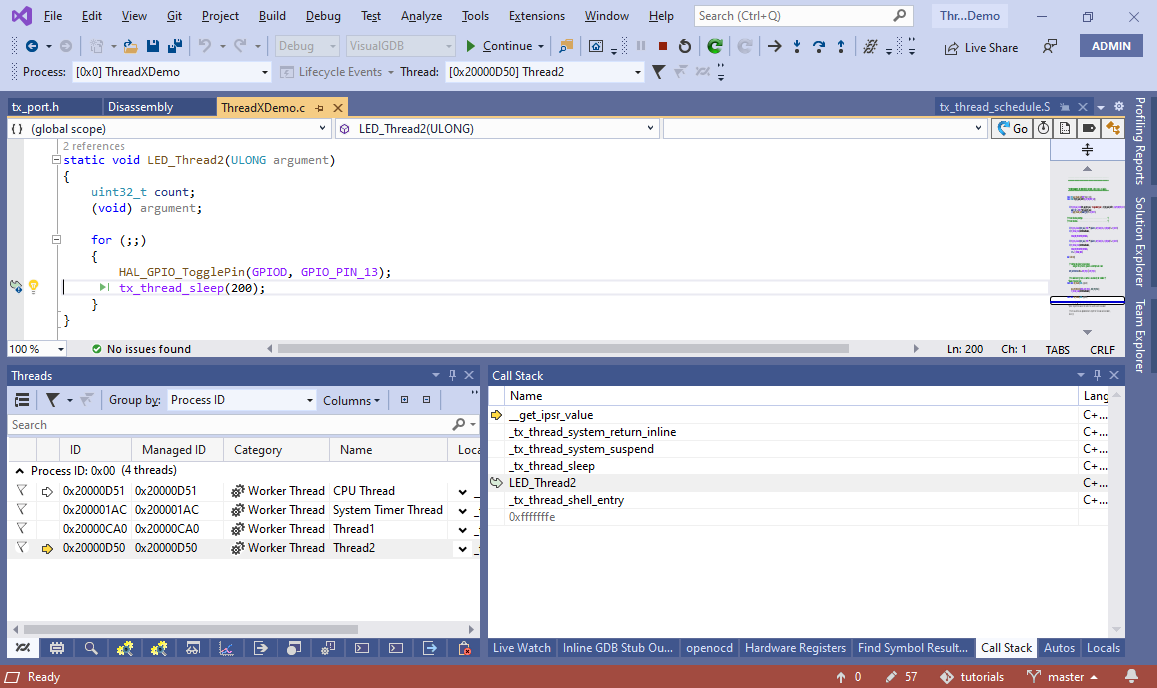
- You can select any thread in the Threads window and use the Call Stack window to see what exactly it was doing before the execution switched to another thread. In this example, both threads were waiting via a call to tx_thread_sleep():
- You can use the Globals view in VisualGDB Code Explorer to quickly explore the relations between different parts of your code (and the AzureRTOS), and locate the relevant functions, variables or types. E.g. try searching for TX_THREAD in the main Code Explorer window, and expanding the details to show references. VisualGDB will show all functions and structs that have a parameter (or field) of this type:
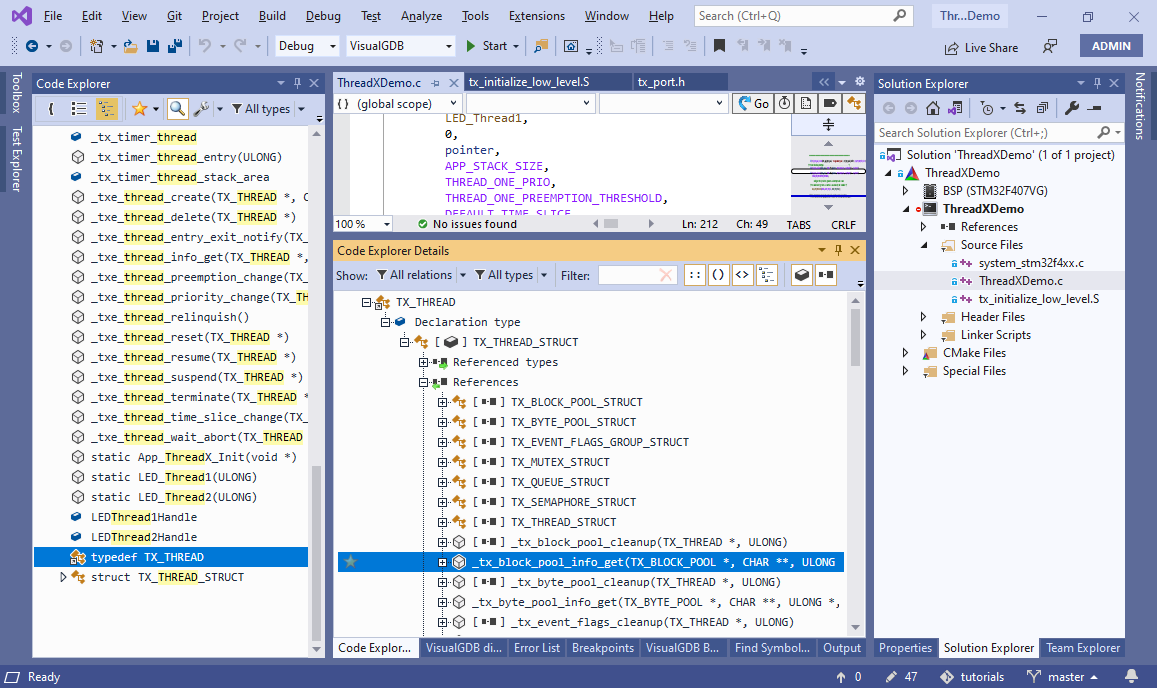 Code Explorer can also quickly explore the call tree, inheritance tree, or find functions allocating/deleting specific types.