Modern Embedded Tools at Your Fingertips
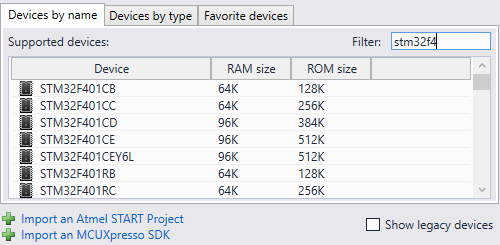
VisualGDB provides out-of-the-box support for STM32, NXP, Atmel, TI, Infineon, Nordic, SiLabs, MSP430, AVR, ESP32, ESP8266 and many other devices.
You can use the GCC compiler, Keil or IAR to build your projects with CMake, MSBuild or GNU Make, and easily manage them from within Visual Studio.
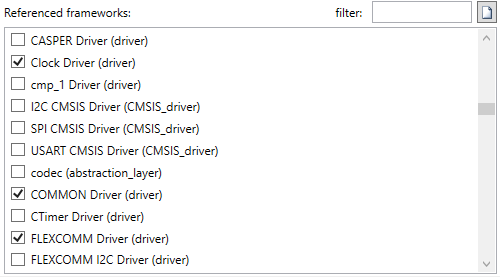
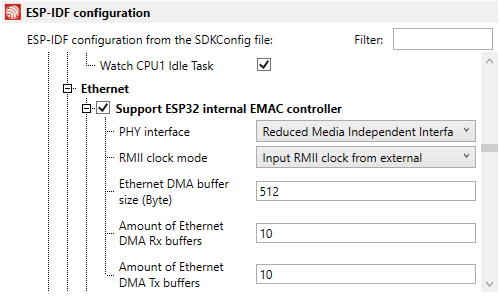
VisualGDB recognizes the Arduino, ESP-IDF, Mbed, NRFConnect, Cypress WICED, Xilinx Vitis, Pico SDK, STM32CubeMX tool, Atmel START and MCUXpresso frameworks, providing GUI for editing most commonly used settings.
Real-time Debugging without Stops
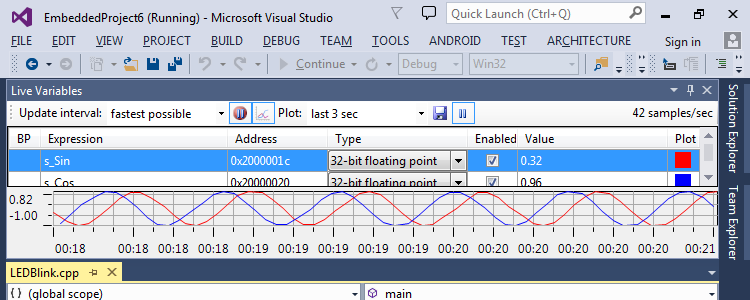
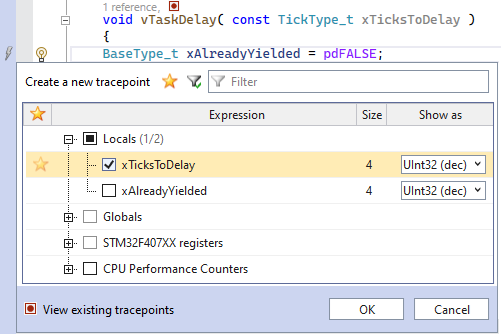
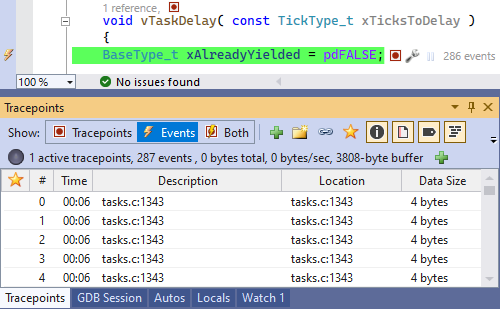
With Software Tracing you can set tracepoints in your code to record variable values or hardware registers. Want to see what threads were running before a crash, plot every incoming ADC sample or measure how each interrupt handler takes? Just set a tracepoint and you got it. Tracing runs by dynamically patching the program and introduces very little overhead.
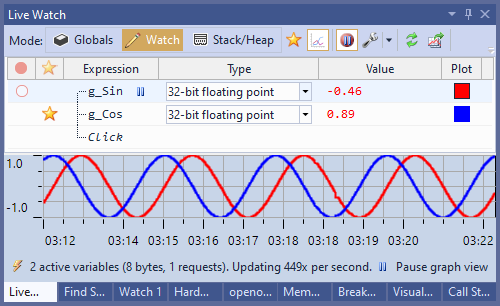
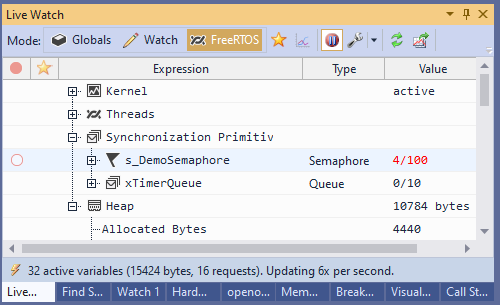
With Live Watch you can sample and plot global variables, view RTOS threads, live stack usage, or heap structure without pausing your program for a single cycle.
Live Coverage lets you see the running functions and code branches in real time, or you can use it for classical code coverage analysis.
Advanced Static and Dynamic Analysis
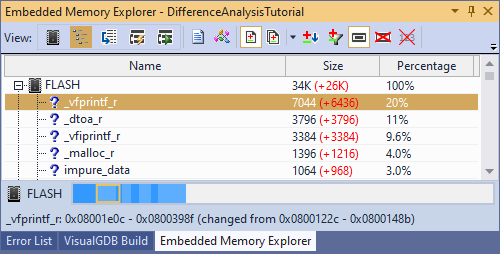
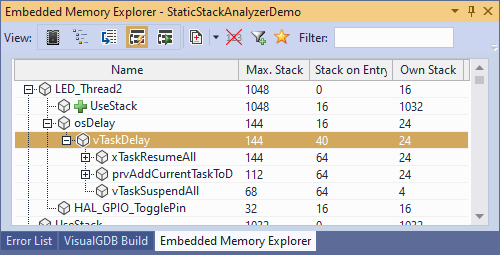
Explore the detailed memory footprint and compare different builds with the Memory Explorer.
View the worst-case stack usage of each function with the extensible static stack analyzer.
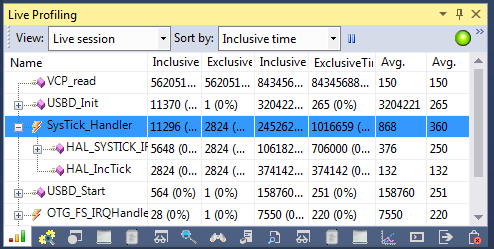
Use the sampling or instrumentation-based profiler to quickly find what paths of the program spend the most time.
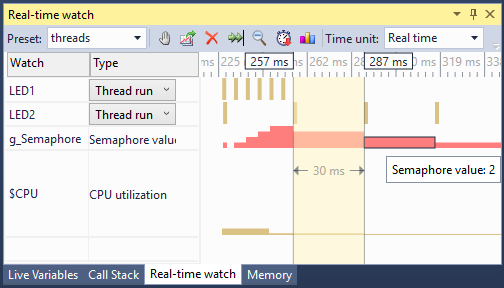
Use Real-Time Watch to see the exact timing of select functions, RTOS threads, or synchronization primitives.
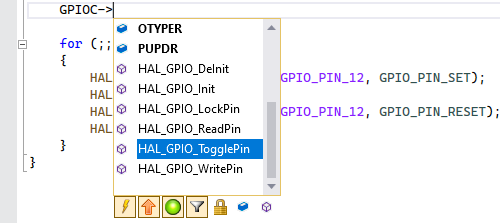
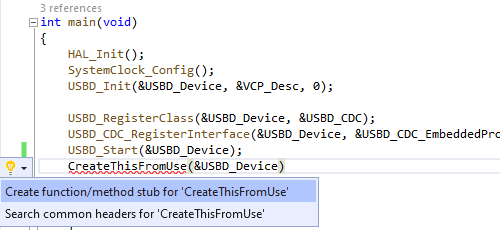
Embedded-friendly IntelliSense
VisualGDB includes a Clang-based IntelliSense engine that is optimized for commonly used embedded frameworks.
Enjoy precise code completion and navigation that fully understands GCC-specific syntax.
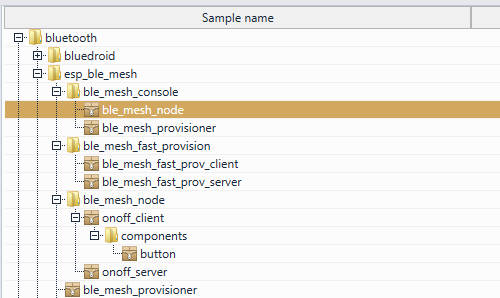
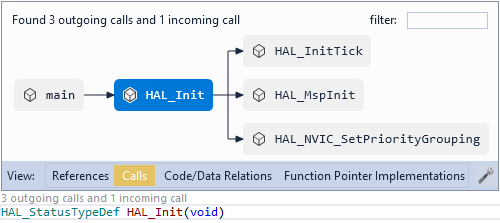
Use CodeJumps, Code Explorer to quickly navigate large embedded code frameworks.
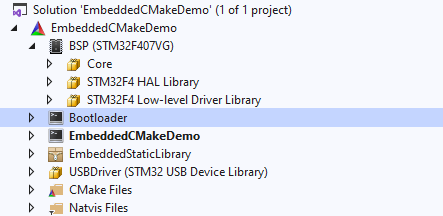
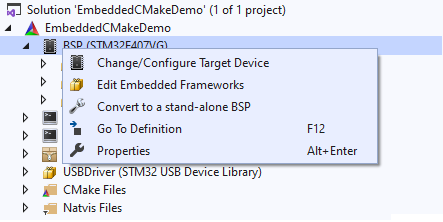
Easy Support for Complex Projects
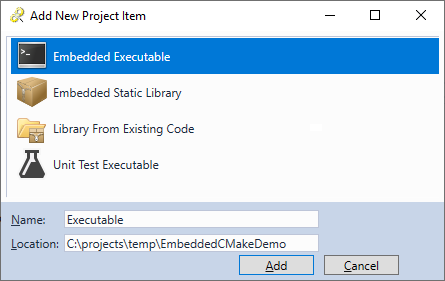
The new Advanced CMake Project Subsystem provides intuitive support for huge and complex project setups by supporting:
- Multiple applications and libraries per project
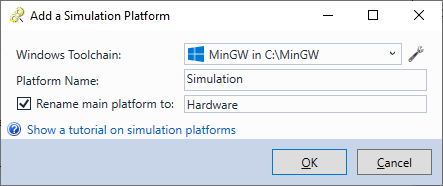
- Multiple platforms targeting different devices
- Simulation platforms for running tests on Windows
- Easy cloning, moving and editing of BSPs and frameworks
Advanced Debugging GUI
Enjoy advanced productivity GUI for embedded debugging.
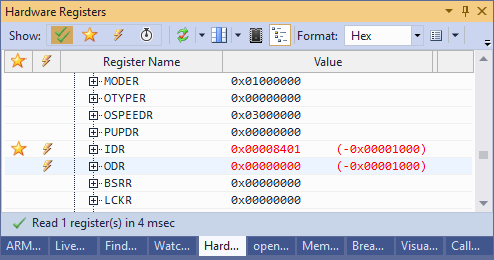
Analyze what the exactly hardware is doing with the powerful Hardware Registers window.
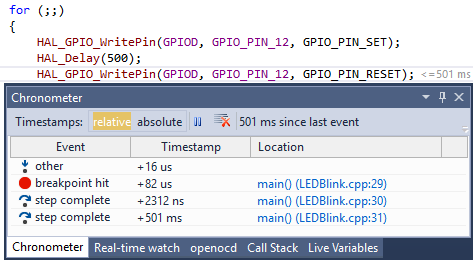
See the exact amount of cycles between breakpoints or steps without any instrumentation using Chronometer.
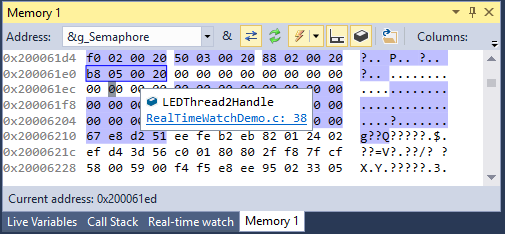
Observe the real-time memory contents and highlight variable bounds with the Advanced Memory window.
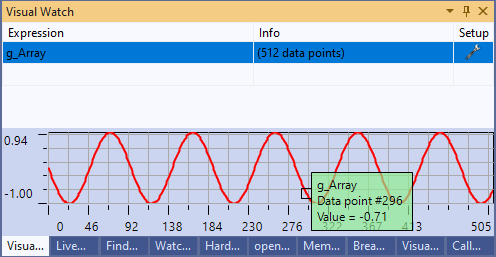
Easily understand large array contents with Visual Watch.
Easy project importing
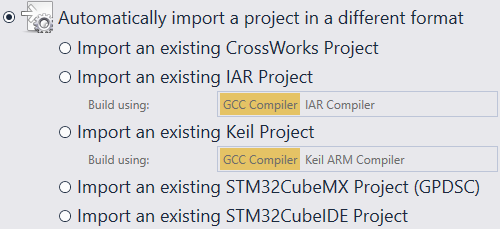
VisualGDB comes with plugins for automatically importing projects from most popular IDEs and project generators. Simply point a an existing project and get it converted to a Visual Studio project in no time.
The project importing plugins are open-source and the SDK is documented, so you can easily customize the plugins for your needs, or add support for custom project formats and build systems.
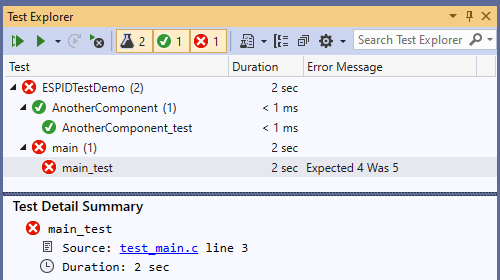
Unit Tests and Integration Tests
With VisualGDB you can create unit and integration tests and run them directly on your hardware:
- Use Visual Studio Test Explorer for Sorting and Grouping
- Easily create unit tests for ARM and ESP32-based projects
- Record and run Embedded Integration tests with zero overhead
- Conveniently manage mbed test cases, as well as individual tests
- Easily switch between debugging the main program or its unit tests
Most test projects (except mbed) require no separate serial port and communicate test results directly over JTAG/SWD.